 Multi-family
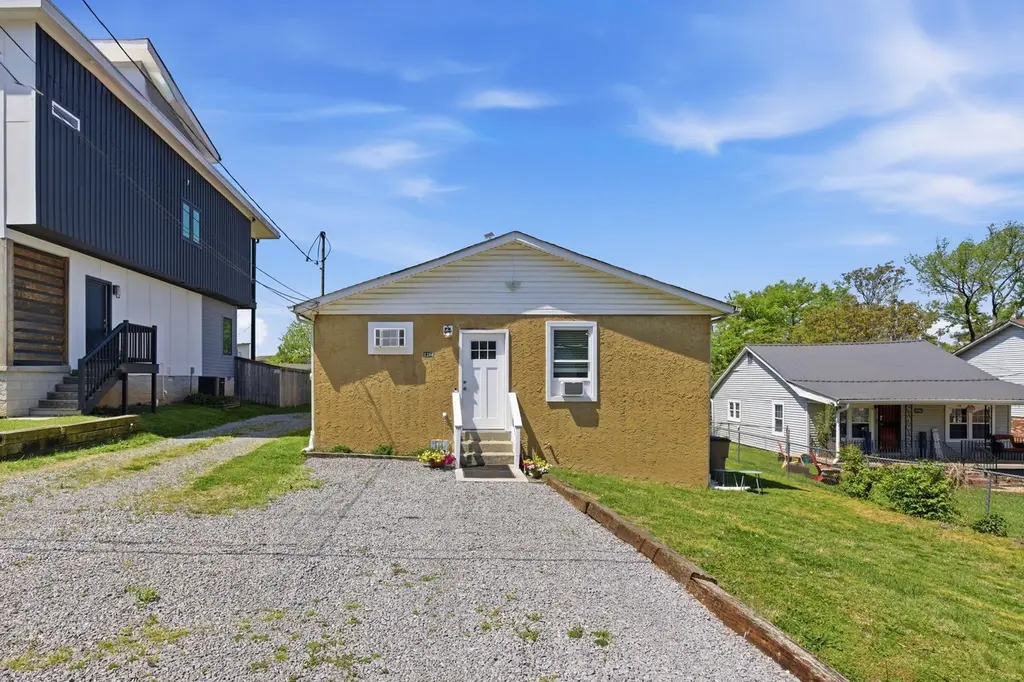
1214 Katie Ave · Nashville-Davidson metropolitan government (balance), TN
Flood risk 1/10 · Minimal
- FEMA flood zone
- X (unshaded)
- Chance of flooding over 30 yrs
- 0.0%
- Est. flood insurance / yr
- $507 – $1,088
Fire risk 1/10 · Minimal
- Est. fire insurance / yr
- $949 – $1,763
Heat risk 5/10 · Moderate
- Hot days now (above 106°F)
- 7 days/yr
- Hot days in 30 yrs
- 20 days/yr
Wind risk 4/10 · Minor
- Chance of severe wind over 30 yrs
- 9.0%
Air-quality risk 2/10 · Minimal
- Unhealthy air days now
- 1 days/yr
- Unhealthy air days in 30 yrs
- 2 days/yr
Risk factors via First Street. Map © Google.
Why this score? — see what drove the B- grade
The composite is a weighted blend of 9 inputs, each scored 0–100. Each bar is that input's sub-score; the figure is the points it added to the 100-point composite (weight × sub-score).
- Cash flow +29.7/30.0
- DSCR +10.0/10.0
- ARV discount +10.0/15.0
- 1% rule +7.9/10.0
- Rent growth +2.8/5.0
- Livability +2.5/5.0
- Condition / age +2.5/5.0
- Schools +1.4/10.0
- Appreciation +0.0/10.0
$369,500
🖨 Deal sheet 📄 Offer letter ✓ Due diligence
Multi-family units
County records classify this as Multi-Family (2-4 Unit). Listing-text estimate: 1 unit. estimate disagrees with records
Listing remarks
Charming duplex with strong rental history in one of Nashville's most sought after pockets. Codes confirmed — Lot can be split to create an HPR in the back if the duplex is converted to single family -unlocking serious value-add potential. Great opportunity for an investor looking to maximize returns or an owner-occupant ready to offset carrying costs.
Key facts
- Lot can be split
- 6,950 sq ft lot
- Built 1981
Tags
Property features AI
Finance
- Other: Zoning: RS5
- Financial info: Gross income reported: $2,600; Net operating income reported: $2,340; Owner pays: None; Tenants pay gas and water
- HOA & community:
Exterior
- Parking: No covered spaces reported; No parking total reported
- Security:
- Utilities: Public water; Public sewer; Water available
- Home design: Duplex; One story; Attached property
- Construction: Stucco exterior; Existing structure
- Exterior features: Lot approximately 50 x 139
Interior
- Kitchen:
- Bedrooms: Two 2-bedroom units (each unit is 2 bedrooms)
- Flooring: Carpet; Vinyl
- Bathrooms: Each unit has 1 bathroom
- Heating & cooling: Baseboard heating; Wall/window air conditioning units
- Interior features: Carpet and vinyl flooring
- Laundry & utility: Individual (in-unit) laundry
Neighborhood map
What this means for you Summary
Snapshot
- This is a 4-bed/2.0-bath multifamily listed at $370k.
Deal economics
- At list price, monthly cash flow is $1k ($16k/yr) — positive.
- The deal already cash-flows at list — no discount required.
- Meets the 1% rule at list price ($5k rent vs $370k).
- Recommended offer: $364k (1.5% below list) — sets the bar for market timing.
- Cap rate 10.7% vs local median 2.9% in Nashville-Davidson metropolitan government (balance) — top-decile yield for the area; either an underpriced asset or a hidden risk that comps aren't pricing in. Stress-test before assuming the spread holds.
Location & tenants
- Location reads: area grade B — affects rentability + tenant quality, not the cash-flow math above.
- Davidson County (urban): math 12% / reading 19% proficiency, ranked #126 of 139 in TN (top 91%) — low school quality limits family demand, transient renter base, plan for 1-2y turnover; 66% free/reduced lunch — lower-income household profile, screen leases tightly.
- Zoned schools: Shwab Elementary (math 12% / reading 12%, grade F, #786 of 952 statewide, top 84%, 337 students, 0% FRL); Maplewood High (math 2% / reading 12%, grade F, #294 of 332 statewide, top 91%, 691 students, 0% FRL) — zoned schools average 0% FRL vs 66% district-wide (66 pts lower); this property's tenant base skews higher-income than the district average.
- Market conditions: Rents rising (+1.3%/yr); 535 active listings in the ZIP; 24 comparable units currently listed for rent nearby; rentals at typical pace (median 20d on market — plan ~3-4 weeks tenant-placement turnaround); 6,873 units permitted in Davidson County in 2024 (4,138 in 5+ unit buildings).
- At $4,767/mo this rent would consume 93% of the median local household income ($62k/yr) (locally 1969% of renters already pay >50% of income on rent) — very limited rent-growth headroom before tenants either downsize or default.
Forward outlook
- Local home prices are declining (-3.0%/yr); year-one equity from $3k of loan paydown is wiped out by about $11k of value loss. Plan a longer hold.
- Davidson County population projected at +42% by 2050 — long-run rental-demand tailwind backs the buy-and-hold thesis.
- At projected returns (-3.0% appreciation + 1.3% rent growth), your $103k cash investment doubles in ~9 years — after that, you're playing with house money.
Negotiation context
- It's been on market 17 days — a 2% lower offer ($364k) is reasonable based on typical stale-listing flexibility.
Risks & watch-outs
- Climate carrying-cost: extreme-heat days projected 7→20/yr by 2055 (HVAC capex compounding) — expect insurance premiums to compound above CPI over the hold.
Questions for the listing agent
- Is there a deadline driving the sale (1031 exchange, divorce, estate, relocation)? That informs how much negotiation room exists.
- What's the average days-on-market for RENTAL listings here right now (not sales)? A rising rental-DOM trend means longer vacancies and softer asking-rent achievability than the comps imply.
- What's the recent tenant-quality profile in this submarket — average credit score on applications, eviction rate, late-payment / NSF rate, and stable-employment percentage? A property-management company in the area should have these aggregated.
- How much new apartment / multifamily construction is in the pipeline within 1–3 miles? Heavy new supply (>2% of stock underway) typically softens rents 12–24 months out; light construction supports rent growth.
Investment metrics
- 1% rule
- 1.29% ✓
- Cap rate
- 10.66%
- Cash-on-cash
- 15.59%
- DSCR
- 1.69
- GRM
- 6.5
CMA / ARV
- ARV (on-the-fly)
- $391,608
- Comps found
- 2
Show comp detail 2 sales within ~0.75 mi
| Address | Dist | Beds/Ba | Sqft | Sold | Price | $/sf | Match |
|---|---|---|---|---|---|---|---|
| 1214 Katie Ave | 0.00mi | 4/2.0 | 1,323 (0%) | 1mo | $375,000 | $283 | 99 |
| 203 Gatewood Ave | 0.72mi | 4/— | 1,377 (+4%) | 9mo | $408,200 | $296 | 53 |
Match score weights: distance 35% · size 25% · config 20% · recency 20%. Top-matched comps best support the ARV.
Projected returns pro-forma
-3.0% appreciation · 1.33% rent growth · sell at horizon
- IRR
- 4.5%
- Equity multiple
- 1.17×
- Total profit
- $17,837
- Equity at exit
- $55,094
- IRR
- 12.5%
- Equity multiple
- 1.91×
- Total profit
- $94,456
- Equity at exit
- $31,948
Cash invested: $103,460 (down + closing). Projections, not guarantees.
Landlord ↔ Tenant lean methodology
- Overall (STATE)
- 87 Strongly Landlord-Friendly
- State Tennessee
- 87 Strongly Landlord-Friendly · R+13
- County
- — inherits STATE
- City
- — inherits STATE
ZIP-level market 37207
- Home prices YoY
- -27.8%
- Rents YoY
- 1.3%
- Active inventory
- 535
- Price-to-rent
- 12.9×
Monthly cashflow live
- Estimated rent
- $4,767 high interval (Pro) →
- Mortgage (P&I)
- −$1,938
- Tax from tax record
- −$330 /mo · $3,963/yr
- Insurance
- −$154
- HOA
- −$0
- Vacancy / Maint / Mgmt
- −$1,001
- Net cashflow
- $1,344
Break-even live
2-unit breakdown (identical units grouped — click to expand)
| Units | Beds | Baths | Est. rent |
|---|---|---|---|
| 2× units | 2 | 1 | $4,768 |
| #1 | 2 | 1 | $2,384 |
| #2 | 2 | 1 | $2,384 |
| Total (2 units) | $4,767 | ||
UW: 25.0% down · 7.5% · 30yr · 1.5% tax · 5.0% vac · 8.0% maint · 8.0% mgmt
Financing live
Cash to close
- Down payment
- $92,375
- Closing costs
- $11,085
- Reserves months
- —
- Total cash needed
- —
Loan-product check · same deal, 3 products live
Conventional
25% down · 7.5% · 30yr
- Down + closing
- —
- Monthly P&I
- —
- Monthly cashflow
- —
- DSCR
- —
- Eligible?
- —
Personal DTI + credit; lowest rate.
DSCR
20% down · 8.5% · 30yr
- Down + closing
- —
- Monthly P&I
- —
- Monthly cashflow
- —
- DSCR
- —
- Eligible?
- —
No personal income docs; deal must DSCR.
Hard money
10% down · 12.0% · 12mo
- Down + closing
- —
- Monthly P&I
- —
- Monthly cashflow
- —
- DSCR
- —
- Eligible?
- —
Short-term bridge; refi at stabilization.
Rent comps 24 comps
| Address | Beds | Baths | Sqft | Rent | $/sqft | DOM | Units | Dist |
|---|---|---|---|---|---|---|---|---|
| 64 Fern Ave Nashville, TN | 3.0 | 2.5 | 1468 | $3,149 | $2.15 | 1d | 1 | 0.24mi |
| 5515 Scruggs Ln Nashville, TN | 2.0–3.0 | 2.0 | 1128 | $1,799 | $1.59 | 2d | 42 | 0.42mi |
| 1221 Joseph Ave Nashville, TN | 3.0 | 2.5 | 1600 | $2,800 | $1.75 | 21d | 1 | 0.60mi |
| 1112 Joseph Ave Unit A Nashville, TN | 3.0 | 2.0 | 1224 | $2,800 | $2.29 | 4d | 1 | 0.66mi |
| 1205 Meridian St Nashville, TN | 3.0 | 2.0 | 1152 | $2,100 | $1.82 | 7d | 1 | 0.82mi |
| 2316 Woodridge Dr Nashville, TN | 3.0 | 1.0 | 950 | $1,595 | $1.68 | 23d | 1 | 0.95mi |
| 310 Evanston Ave Nashville, TN | 3.0 | 2.5 | 1770 | $2,850 | $1.61 | 14d | 1 | 0.95mi |
| 105 Duke St #9 Nashville, TN | 3.0 | 2.5 | 1631 | $3,300 | $2.02 | 23d | 1 | 1.02mi |
| 1806 Lischey Ave #1 Nashville, TN | 3.0 | 3.0 | 1800 | $4,800 | $2.67 | 23d | 1 | 1.07mi |
| 1806 Lischey Ave #3 Nashville, TN | 3.0 | 3.0 | 1800 | $2,895 | $1.61 | 23d | 1 | 1.07mi |
| 229 Duke St Nashville, TN | 3.0 | 3.0 | 1751 | $3,150 | $1.80 | 23d | 1 | 1.14mi |
| 712 Meridian St Nashville, TN | 3.0 | 1.0 | 1065 | $2,100 | $1.97 | 23d | 1 | 1.17mi |
| 1018 N 6th St Nashville, TN | 3.0 | 2.0 | 1476 | $2,995 | $2.03 | 13d | 1 | 1.19mi |
| 1018 N 6th St Nashville, TN | 3.0 | 2.0 | 1476 | $2,995 | $2.03 | 14d | 1 | 1.19mi |
| 1804 5th Ave N Nashville, TN | 3.0 | 2.0 | 1480 | $3,900 | $2.64 | 23d | 1 | 1.22mi |
| 315 Grace St Nashville, TN | 3.0 | 1.0 | 1200 | $1,800 | $1.50 | 23d | 1 | 1.27mi |
| 315 Grace St Nashville, TN | 3.0 | 1.0 | 1200 | $1,995 | $1.66 | 7d | 1 | 1.27mi |
| 203 Treutland Ave Unit A Nashville, TN | 4.0 | 2.0 | 1476 | $2,195 | $1.49 | 20d | 1 | 1.30mi |
| 2323 Ilolo St Unit 1 Nashville, TN | 3.0 | 1.5 | 1116 | $1,995 | $1.79 | 23d | 1 | 1.32mi |
| 1401 3rd Ave N Nashville, TN | 3.0 | 1.0–2.0 | 973 | $3,683 | $3.79 | 1d | 24 | 1.33mi |
| 2628 Old Matthews Rd Nashville, TN | 4.0 | 1.5 | 1584 | $2,185 | $1.38 | 20d | 1 | 1.33mi |
| 128 Gordon Ter Nashville, TN | 3.0 | 2.0 | 1400 | $2,600 | $1.86 | 10d | 1 | 1.37mi |
| 377 Athens Way Nashville, TN | 1.0–3.0 | 1.0–2.0 | 897 | $2,373 | $2.64 | 1d | 13 | 1.38mi |
| 862 W Sharpe Ave #4 Nashville, TN | 3.0 | 3.5 | 1646 | $2,895 | $1.76 | 23d | 1 | 1.39mi |
Listing history 7 events
-
2026-05-01status Pending
-
2026-04-23price $369,500
-
2026-04-14$389,700 Active
-
2026-04-07soldstatus $340,000
-
2006-09-19soldstatus $69,200
-
2006-07-26soldstatus $69,200
-
1985-07-01soldstatus $25,000
ⓘ Source: listings_history table (triggers on properties + properties_extension) + one-shot
backfill from property_details.listing_events for pre-trigger history.
Tax reassessment forecast TN · Resets to sale price
- Current annual tax
- $3,963 · $330/mo
- Projected year-2 tax
- $3,963 · $330/mo
- Expected delta
- $0/yr ($0/mo · 0.0%)
ⓘ Screening estimate from a state-policy table — verify with the county assessor before closing.
Climate risk First Street
- Flood 1/10 Low FEMA zone X (unshaded) · 0% chance over 30 yrs
- Wildfire 1/10 Low
- Heat 5/10 Major 7 d/yr ≥106°F today · 20 d/yr by 30 yrs out
- Wind 4/10 Moderate 9% chance of damaging wind over 30 yrs
- Air quality 2/10 Low 1 unhealthy d/yr today · 2 by 30 yrs out
Nearby sold comps map
Loading sold comps map…
Walkable amenities ~0.75 mi
Loading nearby amenities…
Taxation est. · year 1
- Rental income
- $57,204
- − Mortgage interest
- −$20,698
- − Property taxes
- −$3,963
- − Insurance
- −$1,848
- − Repairs & maintenance
- −$4,576
- − Management
- −$4,576
- − Depreciation
- −$10,749
- Taxable income
- $10,794
- Est. tax owed @ 24.0%
- −$2,591
- After-tax cash flow
- $13,538/yr
For passive investors: Depreciation is non-cash, so a rental often shows a tax loss while cash-flowing — sheltering income. Rental losses are passive: they offset passive income freely, and up to $25,000/yr can offset ordinary (W-2) income if you actively participate and your MAGI is under $100k (phasing out to $0 by $150k); unused losses carry forward. On sale, claimed depreciation is recaptured at up to 25%, and gains may owe capital-gains tax (a 1031 exchange can defer both). Figures are a year-1 estimate at your 24.0% rate — not tax advice; consult a CPA.
Schools (NCES district)
- District
- Davidson County
- NCES district ID
- 4703180
- Math proficiency
- 12% ▼ -17.00%
- Reading proficiency
- 19% ▼ -7.00%
- Median HH income
- $48,667
- Composite
- 14.03/100
- National rank
- #9472
- State rank
- #126 of 139 in TN
Livability — Nashville-Davidson metropolitan government (balance)
No livability data for this city. (Only ~50 U.S. cities are tracked.)
Census & demographics
- Census place
- Nashville-Davidson metropolitan government (balance), TN
- County
- Davidson County · 680,067 people
- City population
- 677,595
- Metro
- Nashville-Davidson--Murfreesboro--Franklin, TN
- Population (ZIP)
- 41,366
- Household income
- $61,744
- Rent vs Own
- Severe rent burden
- 1969.0
Population outlook (Davidson County) Hauer SSP2
- Today (2025)
- 808,568 people
- By 2030
- 874,489 · +8.2%
- By 2040
- 1,009,046 · +24.8%
- By 2050
- 1,147,294 · +41.9%
- By 2075
- 1,475,439 · +82.5%
- By 2100
- 1,714,101 · +112.0%
Race, ethnicity, and origin ACS 2023
- Neighborhood character
- Diverse neighborhood (Simpson 0.60)
- Race & ethnicity
- Black 57% White 24% Hispanic / Latino 13% Two or more races 8%
- Hispanic origin (detail)
- Mexican 6%
- Common ancestry
- Slovak 2% Serbian 1% Romanian 1%
- Foreign-born
- 10% · Canada, Jamaica
- Languages at home
- 88% English-only · Spanish 10%
Political lean MEDSL · Davidson
- 2024 margin
- Strong D (+27.4) · D 62.7% · R 35.3% · Other 2.0%
- 2008→2024 swing
- +6.5pp toward D · 2008: 21.0pp · 2024: 27.4pp
- All cycles
- 2024: D+27.4 2020: D+32.1 2016: D+26.0 2012: D+18.7 2008: D+21.0
Not yet ingested
- Civics
- —
Market trends
- HPI YoY
- ▼ -135.21%
- Current HPI
- 351.9628
- Rent YoY
- ▲ 1.33%
- Metro
- Nashville-Davidson--Murfreesboro--Franklin, TN
- State GDP YoY
- ▲ 2.78%
- F500 in state
- 22
Industry mix (Fortune 500 HQ in TN)
| Industry | F500 HQs | Revenue |
|---|---|---|
| Healthcare | 3 | $91B |
|
||
| Retail | 3 | $72B |
|
||
| Transportation / Logistics | 1 | $88B |
|
||
| Paper / Packaging | 1 | $19B |
|
||
| Insurance | 1 | $13B |
|
||
| Energy | 1 | $12B |
|
||
Price history
+1378.0% since first listed7 events — show timeline
- 2026-05-01 Pending — REALTRACS as Distributed by MLS Grid
- 2026-04-23 Price Changed $369,500 REALTRACS as Distributed by MLS Grid
- 2026-04-14 Listed $389,700 REALTRACS as Distributed by MLS Grid
- 2026-04-07 Sold (Public Records) $340,000 Public Records
- 2006-09-19 Sold (Public Records) $69,200 Public Records
- 2006-07-26 Sold (Public Records) $69,200 Public Records
- 1985-07-01 Sold (Public Records) $25,000 Public Records
Property tax history
+14.3%/yrLatest (2025): $3,963 · +83.3% YoY. Source: county tax records.
Cash-flow waterfall
monthlySold comps — $/sqft
last 12 mo · ≤1 miLoading sold comps…