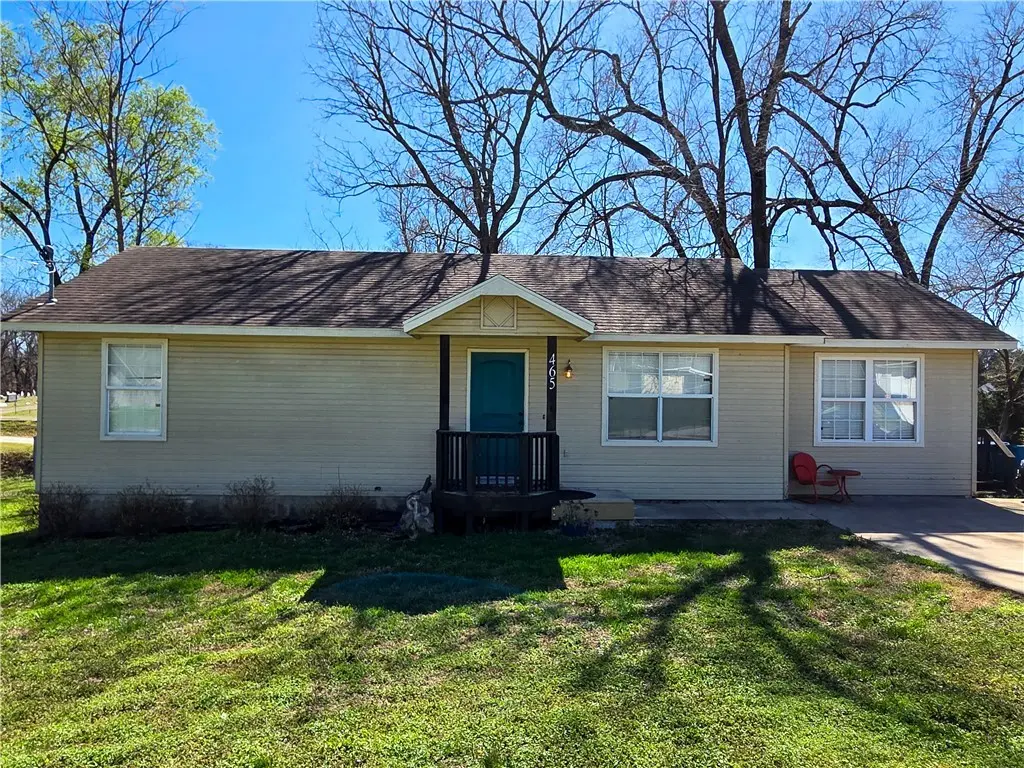
465 Greene St · Pea Ridge, AR
Flood risk 1/10 · Minimal
- FEMA flood zone
- X (unshaded)
- Chance of flooding over 30 yrs
- 0.0%
- Est. flood insurance / yr
- $507 – $1,088
Fire risk 5/10 · Moderate
- Est. fire insurance / yr
- $1,499 – $2,785
Heat risk 4/10 · Minor
- Hot days now (above 105°F)
- 7 days/yr
- Hot days in 30 yrs
- 21 days/yr
Wind risk 2/10 · Minimal
- Chance of severe wind over 30 yrs
- 2.0%
Air-quality risk 2/10 · Minimal
- Unhealthy air days now
- 1 days/yr
- Unhealthy air days in 30 yrs
- 1 days/yr
Risk factors via First Street. Map © Google.
Why this score? — see what drove the C- grade
The composite is a weighted blend of 9 inputs, each scored 0–100. Each bar is that input's sub-score; the figure is the points it added to the 100-point composite (weight × sub-score).
- Cash flow +15.0/30.0
- ARV discount +9.6/15.0
- Appreciation +8.7/10.0
- DSCR +4.6/10.0
- Schools +3.7/10.0
- Livability +3.4/5.0
- 1% rule +3.2/10.0
- Rent growth +2.5/5.0
- Condition / age +2.5/5.0
$212,500
🖨 Deal sheet 📄 Offer letter ✓ Due diligence
Listing remarks
Well-maintained home in a great Pea Ridge location! This property features granite countertops, a functional layout, and is in good overall condition, making it move-in ready for its next owner. Conveniently located just minutes from Bentonville, this home offers easy access to shopping, dining, and major employers while still enjoying the quiet, small-town feel of Pea Ridge. Nearby parks, schools, and quick access to Hwy 72 make commuting simple. A great opportunity for buyers looking for affordability, convenience, and a well-kept home in a growing area.
Key facts
- Nearby parks
- Functional layout
- Granite countertops
Tags
Neighborhood map
What this means for you Summary
Snapshot
- This is a 3-bed/1.0-bath single-family listed at $212k.
Deal economics
- At list price, monthly cash flow is $66 ($792/yr) — positive.
- The deal already cash-flows at list — no discount required.
- To meet the 1% rule (rent ≥ 1% of price), the offer needs to be $174k (18.1% below list).
- Recommended offer: $174k (18.1% below list) — sets the bar for 1% rule.
- Cap rate 6.7% vs local median 3.4% in Pea Ridge — top-decile yield for the area; either an underpriced asset or a hidden risk that comps aren't pricing in. Stress-test before assuming the spread holds.
Location & tenants
- Location reads 67/100 on livability (#98 in AR) — a middle-class / working-renter tenant base. Strengths: employment A+, housing A+, cost of living A-; Watch: amenities F, commute F.
- Pea Ridge School District (suburban): math 43% / reading 42% proficiency, ranked #43 of 238 in AR (top 18%) — families likely to look elsewhere, expect single-tenant / working-renter base with shorter leases.
- Market conditions: 423 active listings in the ZIP; 16 comparable units currently listed for rent nearby; rentals at typical pace (median 21d on market — plan ~3-4 weeks tenant-placement turnaround); solid renter incomes; 4,359 units permitted in Benton County in 2024 (402 in 5+ unit buildings).
Forward outlook
- In year one you build about $17k of equity ($1k loan paydown + $16k appreciation (7.5% local appreciation)).
- Benton County population projected at +56% by 2050 — long-run rental-demand tailwind backs the buy-and-hold thesis.
- At projected returns (7.5% appreciation + 3.0% rent growth), your $60k cash investment doubles in ~3 years — after that, you're playing with house money.
- By year 3, paydown + projected appreciation supports a ~$43k cash-out refi (75% LTV) — recoverable capital for the next deal without selling this one.
Negotiation context
- It's been on market 21 days — a 2% lower offer ($209k) is reasonable based on typical stale-listing flexibility.
- Current owner paid $119k; list at $212k implies a 79% gain — meaningful room to come down on a strong offer.
Risks & watch-outs
- Climate carrying-cost: moderate wildfire risk — expect insurance premiums to compound above CPI over the hold.
Questions for the listing agent
- Is there a deadline driving the sale (1031 exchange, divorce, estate, relocation)? That informs how much negotiation room exists.
- What's the average days-on-market for RENTAL listings here right now (not sales)? A rising rental-DOM trend means longer vacancies and softer asking-rent achievability than the comps imply.
- What's the recent tenant-quality profile in this submarket — average credit score on applications, eviction rate, late-payment / NSF rate, and stable-employment percentage? A property-management company in the area should have these aggregated.
- How much new for-sale + rental construction is in the pipeline within 1–3 miles? Heavy new supply typically softens prices + rents 12–24 months out; constrained supply supports both.
Investment metrics
- 1% rule
- 0.82% ✗
- Cap rate
- 6.67%
- Cash-on-cash
- 1.33%
- DSCR
- 1.06
- GRM
- 10.2
CMA / ARV
- ARV (on-the-fly)
- $222,768
- Comps found
- 12
Show comp detail 12 sales within ~0.75 mi
| Address | Dist | Beds/Ba | Sqft | Sold | Price | $/sf | Match |
|---|---|---|---|---|---|---|---|
| 465 Greene St | 0.00mi | 3/2.0 | 1,224 (0%) | 1mo | $215,000 | $176 | 96 |
| 446 W Pickens Rd | 0.16mi | 3/1.5 | 1,300 (+6%) | 4mo | $216,000 | $166 | 77 |
| 134 Mcculloch St | 0.30mi | 3/1.0 | 1,294 (+6%) | 1mo | $237,500 | $184 | 76 |
| 2018 Hayden Rd | 0.36mi | 3/1.5 | 1,260 (+3%) | 2mo | $225,000 | $179 | 75 |
| 400 W Pickens Rd | 0.17mi | 3/2.0 | 1,308 (+7%) | 6mo | $285,000 | $218 | 72 |
| 1893 Hayden Rd | 0.29mi | 3/2.0 | 1,304 (+6%) | 2mo | $254,900 | $195 | 70 |
| 173 Watie St | 0.44mi | 2/1.0 (-1) | 1,222 (-0%) | 9mo | $217,000 | $178 | 67 |
| 2015 Mcnair St | 0.44mi | 3/2.0 | 1,246 (+2%) | 10mo | $253,000 | $203 | 64 |
| 1562 Hutchinson St | 0.49mi | 3/2.0 | 1,288 (+5%) | 5mo | $234,000 | $182 | 61 |
| 263 Van Dorn St | 0.27mi | 3/1.5 | 1,363 (+11%) | 10mo | $228,300 | $167 | 58 |
| 1031 Charles St | 0.64mi | 3/2.0 | 1,236 (+1%) | 11mo | $262,000 | $212 | 55 |
| 1051 Asboth St | 0.29mi | 2/1.5 (-1) | 1,392 (+14%) | 5mo | $215,000 | $154 | 52 |
Match score weights: distance 35% · size 25% · config 20% · recency 20%. Top-matched comps best support the ARV.
Projected returns pro-forma
7.48% appreciation · 3.0% rent growth · sell at horizon
- IRR
- 19.8%
- Equity multiple
- 2.42×
- Total profit
- $84,616
- Equity at exit
- $153,939
- IRR
- 18.6%
- Equity multiple
- 5.07×
- Total profit
- $242,217
- Equity at exit
- $298,675
Cash invested: $59,500 (down + closing). Projections, not guarantees.
Landlord ↔ Tenant lean methodology
- Overall (STATE)
- 92 Strongly Landlord-Friendly
- State Arkansas
- 92 Strongly Landlord-Friendly · R+14
- County
- — inherits STATE
- City
- — inherits STATE
ZIP-level market 72751
- Home prices YoY
- 2.2%
- Active inventory
- 423
- Price-to-rent
- 10.2×
Monthly cashflow live
- Estimated rent
- $1,740 high interval (Pro) →
- Mortgage (P&I)
- −$1,114
- Tax from tax record
- −$106 /mo · $1,269/yr
- Insurance
- −$89
- HOA
- −$0
- Vacancy / Maint / Mgmt
- −$365
- Net cashflow
- $66
Break-even live
UW: 25.0% down · 7.5% · 30yr · 1.5% tax · 5.0% vac · 8.0% maint · 8.0% mgmt
Financing live
Cash to close
- Down payment
- $53,125
- Closing costs
- $6,375
- Reserves months
- —
- Total cash needed
- —
Loan-product check · same deal, 3 products live
Conventional
25% down · 7.5% · 30yr
- Down + closing
- —
- Monthly P&I
- —
- Monthly cashflow
- —
- DSCR
- —
- Eligible?
- —
Personal DTI + credit; lowest rate.
DSCR
20% down · 8.5% · 30yr
- Down + closing
- —
- Monthly P&I
- —
- Monthly cashflow
- —
- DSCR
- —
- Eligible?
- —
No personal income docs; deal must DSCR.
Hard money
10% down · 12.0% · 12mo
- Down + closing
- —
- Monthly P&I
- —
- Monthly cashflow
- —
- DSCR
- —
- Eligible?
- —
Short-term bridge; refi at stabilization.
Rent comps 16 comps
| Address | Beds | Baths | Sqft | Rent | $/sqft | DOM | Units | Dist |
|---|---|---|---|---|---|---|---|---|
| 521 W Pickens Rd Pea Ridge, AR | 3.0 | 2.5 | 1500 | $1,600 | $1.07 | 14d | 1 | 0.12mi |
| 533 W Pickens Rd Pea Ridge, AR | 3.0 | 2.5 | 1500 | $1,600 | $1.07 | 14d | 1 | 0.12mi |
| 547 W Pickens Rd Pea Ridge, AR | 3.0 | 2.5 | 1500 | $1,600 | $1.07 | 14d | 1 | 0.12mi |
| 575 W Pickens Rd Pea Ridge, AR | 3.0 | 2.5 | 1500 | $1,600 | $1.07 | 43d | 1 | 0.13mi |
| 581 W Pickens Rd Pea Ridge, AR | 3.0 | 2.5 | 1500 | $1,600 | $1.07 | 43d | 1 | 0.14mi |
| 1703 Booker Cir Pea Ridge, AR | 3.0 | 2.0 | 1056 | $1,525 | $1.44 | 14d | 1 | 0.33mi |
| 1914 Booker Cir Pea Ridge, AR | 2.0 | 2.0 | 1052 | $1,525 | $1.45 | 21d | 1 | 0.34mi |
| 1723 Booker Cir Pea Ridge, AR | 3.0 | 2.0 | 1056 | $1,650 | $1.56 | 23d | 1 | 0.39mi |
| 1803 Booker Cir Pea Ridge, AR | 3.0 | 2.0 | 1056 | $1,525 | $1.44 | 14d | 1 | 0.39mi |
| 1801 Booker Cir Pea Ridge, AR | 3.0 | 2.0 | 1056 | $1,525 | $1.44 | 43d | 1 | 0.39mi |
| 1735 Booker Cir Pea Ridge, AR | 3.0 | 2.0 | 1056 | $1,525 | $1.44 | 21d | 1 | 0.40mi |
| 200 Ryan Rd Pea Ridge, AR | 1.0–2.0 | 1.0–2.0 | 895 | $1,405 | $1.57 | 13d | 18 | 0.96mi |
| 112 Alder St Pea Ridge, AR | 3.0 | 2.0 | 1350 | $1,625 | $1.20 | 44d | 1 | 1.07mi |
| 308 Alder St Pea Ridge, AR | 3.0 | 2.0 | 1425 | $1,625 | $1.14 | 43d | 1 | 1.17mi |
| 308 Alder St Pea Ridge, AR | 3.0 | 2.0 | 1425 | $1,625 | $1.14 | 23d | 1 | 1.17mi |
| 1400 Hickery St Pea Ridge, AR | 3.0 | 2.0 | 1400 | $1,700 | $1.21 | 21d | 1 | 1.24mi |
Listing history 5 events
-
2026-04-13status Pending
-
2026-04-10price $212,500
-
2026-03-23$220,000 Active
-
2018-09-17soldstatus $118,900
-
1993-08-31soldstatus $45,000
ⓘ Source: listings_history table (triggers on properties + properties_extension) + one-shot
backfill from property_details.listing_events for pre-trigger history.
Tax reassessment forecast AR · Resets to sale price
- Current annual tax
- $1,269 · $106/mo
- Projected year-2 tax
- $1,360 · $113/mo
- Expected delta
- +$91/yr (+$8/mo · 7.1%)
ⓘ Screening estimate from a state-policy table — verify with the county assessor before closing.
Climate risk First Street
- Flood 1/10 Low FEMA zone X (unshaded) · 0% chance over 30 yrs
- Wildfire 5/10 Major
- Heat 4/10 Moderate 7 d/yr ≥105°F today · 21 d/yr by 30 yrs out
- Wind 2/10 Low 2% chance of damaging wind over 30 yrs
- Air quality 2/10 Low 1 unhealthy d/yr today · 1 by 30 yrs out
Nearby sold comps map
Loading sold comps map…
Walkable amenities ~0.75 mi
Loading nearby amenities…
Taxation est. · year 1
- Rental income
- $20,881
- − Mortgage interest
- −$11,903
- − Property taxes
- −$1,269
- − Insurance
- −$1,062
- − Repairs & maintenance
- −$1,671
- − Management
- −$1,671
- − Depreciation
- −$6,182
- Taxable loss
- −$2,877
- Est. tax savings @ 24.0%
- +$690
- After-tax cash flow
- $1,482/yr
For passive investors: Depreciation is non-cash, so a rental often shows a tax loss while cash-flowing — sheltering income. Rental losses are passive: they offset passive income freely, and up to $25,000/yr can offset ordinary (W-2) income if you actively participate and your MAGI is under $100k (phasing out to $0 by $150k); unused losses carry forward. On sale, claimed depreciation is recaptured at up to 25%, and gains may owe capital-gains tax (a 1031 exchange can defer both). Figures are a year-1 estimate at your 24.0% rate — not tax advice; consult a CPA.
Schools (NCES district)
- District
- Pea Ridge School District
- NCES district ID
- 0503030
- Math proficiency
- 43% ▼ -3.00%
- Reading proficiency
- 42% ▼ -8.00%
- Median HH income
- $53,156
- Composite
- 36.88/100
- National rank
- #4546
- State rank
- #43 of 238 in AR
Livability — Pea Ridge
- Score
- 67/100
- State rank
- #98
- US rank
- #10429
Category grades
Schools grade is shown separately in the Schools card above.
Census & demographics
- Census place
- Pea Ridge, AR
- County
- Benton County · 259,241 people
- City population
- 9,997
- Metro
- Fayetteville-Springdale-Rogers, AR
- Population (ZIP)
- 9,997
- Household income
- $95,299
- Rent vs Own
- Severe rent burden
- 83.0
Population outlook (Benton County) Hauer SSP2
- Today (2025)
- 318,683 people
- By 2030
- 353,481 · +10.9%
- By 2040
- 425,280 · +33.4%
- By 2050
- 497,239 · +56.0%
- By 2075
- 662,114 · +107.8%
- By 2100
- 776,431 · +143.6%
Race, ethnicity, and origin ACS 2023
- Neighborhood character
- Predominantly White (72%)
- Race & ethnicity
- White 72% Two or more races 17% Hispanic / Latino 7% Black 3%
- Hispanic origin (detail)
- Mexican 5%
- Common ancestry
- Slovak 4% Scottish 2% Lithuanian 2%
- Foreign-born
- 7% · Canada, Vietnam
- Languages at home
- 97% English-only · Spanish 2% Vietnamese 1%
Political lean MEDSL · Benton
- 2024 margin
- Strong R (+27.0) · D 35.2% · R 62.1% · Other 2.7%
- 2008→2024 swing
- +9.6pp toward D · 2008: -36.5pp · 2024: -27.0pp
- All cycles
- 2024: R+27.0 2020: R+26.4 2016: R+34.9 2012: R+40.4 2008: R+36.5
Not yet ingested
- Civics
- —
Market trends
- HPI YoY
- ▲ 7.48%
- Current HPI
- 352.7133
- Rent YoY
- —
- Metro
- Fayetteville-Springdale-Rogers, AR
- State GDP YoY
- ▲ 3.80%
- F500 in state
- 10
Industry mix (Fortune 500 HQ in AR)
| Industry | F500 HQs | Revenue |
|---|---|---|
| Retail | 1 | $681B |
|
||
| Food / Agriculture | 1 | $53B |
|
||
| Retail / Energy | 1 | $22B |
|
||
| Transportation / Logistics | 1 | $12B |
|
||
| Energy | 1 | $4B |
|
||
Price history
+372.2% since first listed5 events — show timeline
- 2026-04-13 Pending — NWARMLS
- 2026-04-10 Price Changed $212,500 NWARMLS
- 2026-03-23 Listed $220,000 NWARMLS
- 2018-09-17 Sold (Public Records) $118,900 Public Records
- 1993-08-31 Sold (Public Records) $45,000 Public Records
Property tax history
+11.1%/yrLatest (2025): $1,269 · +10.7% YoY. Source: county tax records.
Cash-flow waterfall
monthlySold comps — $/sqft
last 12 mo · ≤1 miLoading sold comps…