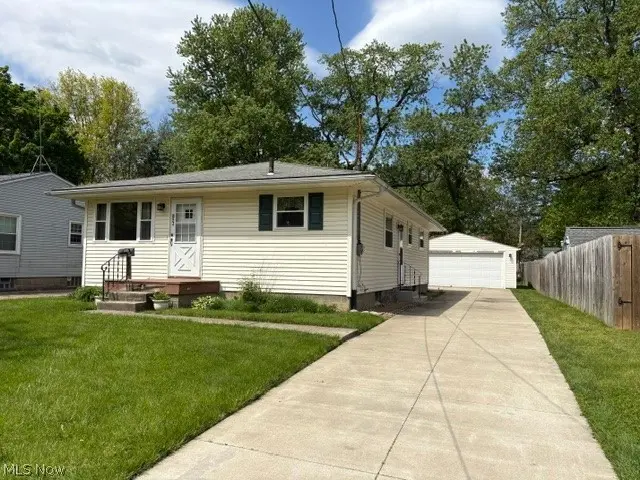
852 Manitou Ave · Akron, OH
Flood risk 1/10 · Minimal
- FEMA flood zone
- X (unshaded)
- Chance of flooding over 30 yrs
- 0.0%
- Est. flood insurance / yr
- $473 – $860
Fire risk 1/10 · Minimal
- Est. fire insurance / yr
- $713 – $1,323
Heat risk 3/10 · Minor
- Hot days now (above 97°F)
- 7 days/yr
- Hot days in 30 yrs
- 17 days/yr
Wind risk 1/10 · Minimal
- Chance of severe wind over 30 yrs
- —
Air-quality risk 3/10 · Minor
- Unhealthy air days now
- 2 days/yr
- Unhealthy air days in 30 yrs
- 4 days/yr
Risk factors via First Street. Map © Google.
Why this score? — see what drove the B grade
The composite is a weighted blend of 9 inputs, each scored 0–100. Each bar is that input's sub-score; the figure is the points it added to the 100-point composite (weight × sub-score).
- Cash flow +27.4/30.0
- ARV discount +13.7/15.0
- DSCR +9.6/10.0
- 1% rule +8.3/10.0
- Livability +4.0/5.0
- Rent growth +3.6/5.0
- Condition / age +2.5/5.0
- Schools +2.1/10.0
- Appreciation +0.0/10.0
$99,900
🖨 Deal sheet 📄 Offer letter ✓ Due diligence
Listing remarks
Check out this amazing well maintained 3 bedroom 1.5 bath ranch located in Goodyear Heights. As soon as you pull in you will notice the wide concrete driveway leading to the large two car detached garage with concrete floor and garage door opener. As you walk in the side door you will see a large 16x12 eat-in kitchen with fridge, microwave and gas stove. Next you walk into the living room with lots of natural light. Down the hall are 3 bedrooms, full bath and 2 hall closets great for storage. There is a half bath off master bedroom. There is a full dry basement that has been professionally waterproofed. It was finished at one time and is ready to be refinished again. Some updates include ro
Key facts
- Large eat-in kitchen
- Full dry basement
- 7,501 sq ft lot
Tags
Property features AI
Exterior
- Parking: Detached 2-car garage; Driveway with garage door opener
- Utilities: Public water; Public sewer
- Home design: Single-story home; Block foundation; Vinyl siding; Asphalt/fiberglass roof
- Construction: Built (year per public records); Vinyl siding construction; Block foundation; Asphalt/Fiberglass roof
- Exterior features: Patio; Shed(s); Block fencing; City lot (approx. 50 x 150)
Interior
- Kitchen: Eat-in kitchen with appliances included; Microwave, Range, Refrigerator
- Bedrooms: 3 main-level bedrooms
- Flooring: Carpet in living areas and bedrooms; Linoleum in kitchen
- Bathrooms: 1 full bathroom; 1 half bathroom (both on main level)
- Heating & cooling: Forced-air heating; Central air conditioning
- Interior features: Double-pane windows; Full walk-up basement
- Laundry & utility: Laundry room in the lower level / basement
Neighborhood map
What this means for you Summary
Snapshot
- This is a 3-bed/1.5-bath single-family listed at $100k.
Deal economics
- At list price, monthly cash flow is $292 ($3k/yr) — positive.
- The deal already cash-flows at list — no discount required.
- Meets the 1% rule at list price ($1k rent vs $100k).
- Cap rate 9.8% vs local median 6.6% in Akron — top-decile yield for the area; either an underpriced asset or a hidden risk that comps aren't pricing in. Stress-test before assuming the spread holds.
Location & tenants
- Location reads 81/100 on livability (#104 in OH, #1,591 nationally) — a professional / high-income tenant draw. Strengths: amenities A+, commute A+, cost of living A+; Watch: crime F, employment F.
- Akron City (urban): math 22% / reading 30% proficiency, ranked #602 of 656 in OH (top 92%) — low school quality limits family demand, transient renter base, plan for 1-2y turnover; 66% free/reduced lunch — lower-income household profile, screen leases tightly.
- Market conditions: Rents rising fast (+4.5%/yr); 101 active listings in the ZIP; 29 comparable units currently listed for rent nearby; rentals lingering (median 44d on market — plan ~5-8 weeks vacancy on turnover, expect pricing pressure); 52% of comp listings sitting > 30 days — soft ceiling on asking rent; 1,114 units permitted in Summit County in 2024 (397 in 5+ unit buildings).
- This rent runs 30% of the median local income ($53k/yr) — at the standard rent-burdened threshold; future hikes will face affordability resistance.
Forward outlook
- Local home prices are declining (-3.0%/yr); year-one equity from $691 of loan paydown is wiped out by about $3k of value loss. Plan a longer hold.
- Summit County population projected to shrink 6% by 2050 — rents likely to lag national; underwrite the cash flow, not the appreciation.
- At projected returns (-3.0% appreciation + 4.5% rent growth), your $28k cash investment doubles in ~8 years — after that, you're playing with house money.
Negotiation context
- Only 3 days on market — expect competitive offers; lowballing is unlikely to land.
Questions for the listing agent
- Built in 1970 — when were the roof, HVAC, electrical panel, plumbing, and water heater last replaced?
- Is there a deadline driving the sale (1031 exchange, divorce, estate, relocation)? That informs how much negotiation room exists.
- Crime grade is F in this area — have there been break-ins, vandalism, or insurance claims at this property in the last 3 years? What carrier currently insures it and at what premium?
- What's the average days-on-market for RENTAL listings here right now (not sales)? A rising rental-DOM trend means longer vacancies and softer asking-rent achievability than the comps imply.
- What's the recent tenant-quality profile in this submarket — average credit score on applications, eviction rate, late-payment / NSF rate, and stable-employment percentage? A property-management company in the area should have these aggregated.
- How much new for-sale + rental construction is in the pipeline within 1–3 miles? Heavy new supply typically softens prices + rents 12–24 months out; constrained supply supports both.
Investment metrics
- 1% rule
- 1.33% ✓
- Cap rate
- 9.79%
- Cash-on-cash
- 12.51%
- DSCR
- 1.56
- GRM
- 6.2
CMA / ARV
- ARV (on-the-fly)
- $115,752
- Comps found
- 12
Show comp detail 12 sales within ~0.75 mi
| Address | Dist | Beds/Ba | Sqft | Sold | Price | $/sf | Match |
|---|---|---|---|---|---|---|---|
| 852 Manitou Ave | 0.00mi | 3/1.5 | 1,092 (0%) | 1mo | $131,000 | $120 | 99 |
| 942 Caddo Ave | 0.21mi | 3/2.0 | 1,136 (+4%) | 1mo | $140,000 | $123 | 80 |
| 1267 Tioga Ave | 0.13mi | 3/1.0 | 960 (-12%) | 4mo | $93,500 | $97 | 68 |
| 810 Mohawk Ave | 0.40mi | 2/1.5 (-1) | 1,152 (+6%) | 2mo | $82,500 | $72 | 66 |
| 853 Brittain Rd | 0.48mi | 3/1.0 | 1,032 (-6%) | 4mo | $145,000 | $141 | 64 |
| 1082 Hazel St | 0.60mi | 3/1.0 | 1,056 (-3%) | 2mo | $112,100 | $106 | 63 |
| 1364 Eastwood Ave | 0.38mi | 2/1.0 (-1) | 1,027 (-6%) | 3mo | $83,000 | $81 | 63 |
| 1318 Arnold Ave | 0.62mi | 3/1.0 | 1,056 (-3%) | 5mo | $99,900 | $95 | 59 |
| 677 Eastland Ave | 0.48mi | 3/1.0 | 1,216 (+11%) | 1mo | $41,000 | $34 | 56 |
| 1465 Multnoma Ave | 0.67mi | 3/1.0 | 1,144 (+5%) | 5mo | $139,500 | $122 | 55 |
| 1102 Tonawanda Ave | 0.69mi | 3/1.0 | 960 (-12%) | 1mo | $97,000 | $101 | 45 |
| 1177 Smithfarm Ave | 0.71mi | 2/1.0 (-1) | 992 (-9%) | 2mo | $113,000 | $114 | 43 |
Match score weights: distance 35% · size 25% · config 20% · recency 20%. Top-matched comps best support the ARV.
Projected returns pro-forma
-3.0% appreciation · 4.51% rent growth · sell at horizon
- IRR
- 4.1%
- Equity multiple
- 1.16×
- Total profit
- $4,499
- Equity at exit
- $14,895
- IRR
- 15.1%
- Equity multiple
- 2.32×
- Total profit
- $36,788
- Equity at exit
- $8,638
Cash invested: $27,972 (down + closing). Projections, not guarantees.
Landlord ↔ Tenant lean methodology
- Overall (STATE)
- 73 Landlord-Friendly
- State Ohio
- 73 Landlord-Friendly · R+6
- County
- — inherits STATE
- City
- — inherits STATE
ZIP-level market 44305
- Rents YoY
- 4.5%
- Active inventory
- 101
- Price-to-rent
- 6.2×
Monthly cashflow live
- Estimated rent
- $1,334 high interval (Pro) →
- Mortgage (P&I)
- −$524
- Tax from tax record
- −$197 /mo · $2,359/yr
- Insurance
- −$42
- HOA
- −$0
- Vacancy / Maint / Mgmt
- −$280
- Net cashflow
- $292
Break-even live
UW: 25.0% down · 7.5% · 30yr · 1.5% tax · 5.0% vac · 8.0% maint · 8.0% mgmt
Financing live
Cash to close
- Down payment
- $24,975
- Closing costs
- $2,997
- Reserves months
- —
- Total cash needed
- —
Loan-product check · same deal, 3 products live
Conventional
25% down · 7.5% · 30yr
- Down + closing
- —
- Monthly P&I
- —
- Monthly cashflow
- —
- DSCR
- —
- Eligible?
- —
Personal DTI + credit; lowest rate.
DSCR
20% down · 8.5% · 30yr
- Down + closing
- —
- Monthly P&I
- —
- Monthly cashflow
- —
- DSCR
- —
- Eligible?
- —
No personal income docs; deal must DSCR.
Hard money
10% down · 12.0% · 12mo
- Down + closing
- —
- Monthly P&I
- —
- Monthly cashflow
- —
- DSCR
- —
- Eligible?
- —
Short-term bridge; refi at stabilization.
Rent comps 29 comps
| Address | Beds | Baths | Sqft | Rent | $/sqft | DOM | Units | Dist |
|---|---|---|---|---|---|---|---|---|
| 857 Kennebec Ave Akron, OH | 3.0 | 1.0 | 1008 | $1,350 | $1.34 | 44d | 1 | 0.07mi |
| 1190 Hazel St Akron, OH | 3.0 | 1.0 | 1124 | $1,425 | $1.27 | 43d | 1 | 0.42mi |
| 680 Grifton Ave Akron, OH | 2.0 | 1.0 | 828 | $1,050 | $1.27 | 23d | 1 | 0.44mi |
| 676 Grifton Ave Akron, OH | 2.0 | 1.0 | 703 | $1,000 | $1.42 | 43d | 1 | 0.44mi |
| 589 Eastland Ave Akron, OH | 3.0 | 1.5 | 1345 | $1,300 | $0.97 | 43d | 1 | 0.52mi |
| 1318 Arnold Ave Akron, OH | 3.0 | 1.0 | 1056 | $1,450 | $1.37 | 43d | 1 | 0.62mi |
| 1113 Smithfarm Ave Akron, OH | 3.0 | 2.0 | 1296 | $1,600 | $1.23 | 23d | 1 | 0.76mi |
| 1635 Bronson Rd Akron, OH | 3.0 | 1.0 | 1110 | $1,245 | $1.12 | 13d | 1 | 0.87mi |
| 208 Denver St Akron, OH | 3.0 | 1.0 | 1248 | $895 | $0.72 | 43d | 1 | 0.99mi |
| 1423 Creighton Ave Unit 1 Akron, OH | 3.0 | 1.0 | 1040 | $1,100 | $1.06 | 23d | 1 | 1.02mi |
| 1444 Hyde Park Ave Akron, OH | 3.0 | 1.0 | 1104 | $1,395 | $1.26 | 13d | 1 | 1.02mi |
| 72 S Thomas Rd Tallmadge, OH | 2.0 | 1.5 | 1100 | $1,295 | $1.18 | 43d | 1 | 1.05mi |
| 72 S Thomas Rd Unit 12 Tallmadge, OH | 2.0 | 1.5 | 1100 | $1,295 | $1.18 | 13d | 1 | 1.05mi |
| 1438 Newton St Akron, OH | 4.0 | 1.0 | 1429 | $1,375 | $0.96 | 23d | 1 | 1.06mi |
| 288 Kryder Ave Akron, OH | 4.0 | 1.0 | 1400 | $1,450 | $1.04 | 43d | 1 | 1.12mi |
| 134 N Arlington St Akron, OH | 2.0 | 1.0 | 964 | $900 | $0.93 | 23d | 1 | 1.17mi |
| 846 Lee Dr Akron, OH | 4.0 | 1.0 | 1433 | $1,325 | $0.92 | 14d | 1 | 1.18mi |
| 846 Lee Dr Akron, OH | 4.0 | 1.5 | 1433 | $1,325 | $0.92 | 23d | 1 | 1.18mi |
| 109 Kent Ct Akron, OH | 2.0 | 1.0 | 1032 | $1,142 | $1.11 | 23d | 1 | 1.20mi |
| 237 Kryder Ave Unit 237 Akron, OH | 2.0 | 1.0 | 860 | $850 | $0.99 | 44d | 1 | 1.21mi |
| 1598 Pilgrim St Akron, OH | 3.0 | 1.0 | 1352 | $1,550 | $1.15 | 43d | 1 | 1.22mi |
| 77 Kent Ct Akron, OH | 4.0 | 1.0 | 1300 | $1,200 | $0.92 | 43d | 1 | 1.22mi |
| 208 Barder Ave Akron, OH | 3.0 | 1.0 | 924 | $1,050 | $1.14 | 43d | 1 | 1.28mi |
| 1297 Pondview Ave Akron, OH | 4.0 | 1.0 | 1373 | $1,450 | $1.06 | 23d | 1 | 1.29mi |
| 797 E Market St Apt 220 Akron, OH | 2.0 | 1.5 | 1100 | $1,500 | $1.36 | 23d | 1 | 1.31mi |
| 240 Arch St Akron, OH | 3.0 | 1.0 | 1182 | $1,375 | $1.16 | 43d | 1 | 1.35mi |
| 248 Arch St Akron, OH | 3.0 | 1.0 | 1210 | $1,300 | $1.07 | 43d | 1 | 1.37mi |
| 1428 Sara Ave Akron, OH | 2.0 | 1.0 | 1080 | $1,050 | $0.97 | 14d | 1 | 1.47mi |
| 243 Watson St Akron, OH | 2.0 | 1.0 | 750 | $950 | $1.27 | 43d | 1 | 1.48mi |
Listing history 2 events
-
2026-05-14status Pending
-
2026-05-11$99,900 Active
ⓘ Source: listings_history table (triggers on properties + properties_extension) + one-shot
backfill from property_details.listing_events for pre-trigger history.
Tax reassessment forecast OH · Partial reset (capped growth)
- Current annual tax
- $2,359 · $197/mo
- Projected year-2 tax
- $2,359 · $197/mo
- Expected delta
- $0/yr ($0/mo · 0.0%)
ⓘ Screening estimate from a state-policy table — verify with the county assessor before closing.
Climate risk First Street
- Flood 1/10 Low FEMA zone X (unshaded) · 0% chance over 30 yrs
- Wildfire 1/10 Low
- Heat 3/10 Moderate 7 d/yr ≥97°F today · 17 d/yr by 30 yrs out
- Wind 1/10 Low
- Air quality 3/10 Moderate 2 unhealthy d/yr today · 4 by 30 yrs out
Nearby sold comps map
Loading sold comps map…
Walkable amenities ~0.75 mi
Loading nearby amenities…
Taxation est. · year 1
- Rental income
- $16,003
- − Mortgage interest
- −$5,596
- − Property taxes
- −$2,359
- − Insurance
- −$500
- − Repairs & maintenance
- −$1,280
- − Management
- −$1,280
- − Depreciation
- −$2,906
- Taxable income
- $2,083
- Est. tax owed @ 24.0%
- −$500
- After-tax cash flow
- $2,998/yr
For passive investors: Depreciation is non-cash, so a rental often shows a tax loss while cash-flowing — sheltering income. Rental losses are passive: they offset passive income freely, and up to $25,000/yr can offset ordinary (W-2) income if you actively participate and your MAGI is under $100k (phasing out to $0 by $150k); unused losses carry forward. On sale, claimed depreciation is recaptured at up to 25%, and gains may owe capital-gains tax (a 1031 exchange can defer both). Figures are a year-1 estimate at your 24.0% rate — not tax advice; consult a CPA.
Schools (NCES district)
- District
- Akron City
- NCES district ID
- 3904348
- Math proficiency
- 22% ▼ -17.00%
- Reading proficiency
- 30% ▼ -12.00%
- Median HH income
- $33,811
- Composite
- 21.31/100
- National rank
- #8383
- State rank
- #602 of 656 in OH
Livability — Akron
- Score
- 81/100
- State rank
- #104
- US rank
- #1591
Category grades
Schools grade is shown separately in the Schools card above.
Census & demographics
- Census place
- Akron, OH
- County
- Summit County · 440,783 people
- City population
- 174,375
- Metro
- Akron, OH
- Population (ZIP)
- 21,103
- Household income
- $52,768
- Rent vs Own
- Severe rent burden
- 1021.0
Population outlook (Summit County) Hauer SSP2
- Today (2025)
- 546,583 people
- By 2030
- 544,028 · -0.5%
- By 2040
- 531,363 · -2.8%
- By 2050
- 514,923 · -5.8%
- By 2075
- 481,765 · -11.9%
- By 2100
- 432,265 · -20.9%
Race, ethnicity, and origin ACS 2023
- Neighborhood character
- Diverse neighborhood (Simpson 0.57)
- Race & ethnicity
- White 62% Black 20% Two or more races 12% Asian 5% Hispanic / Latino 2%
- Common ancestry
- Lithuanian 3% Slovak 2% Romanian 2%
- Foreign-born
- 4% · India, Philippines, Canada
- Languages at home
- 94% English-only · Other Asian/Pacific 3% Other Indo-European 1% Spanish 1%
Political lean MEDSL · Summit
- 2024 margin
- Lean D (+7.0) · D 53.0% · R 46.0%
- 2008→2024 swing
- -9.6pp toward R · 2008: 16.6pp · 2024: 7.0pp
- All cycles
- 2024: D+7.0 2020: D+9.6 2016: D+8.2 2012: D+14.8 2008: D+16.6
Not yet ingested
- Civics
- —
Market trends
- HPI YoY
- ▼ -140.39%
- Current HPI
- 190.6223
- Rent YoY
- ▲ 4.51%
- Metro
- Akron, OH
- State GDP YoY
- ▲ 1.98%
- F500 in state
- 48
Industry mix (Fortune 500 HQ in OH)
| Industry | F500 HQs | Revenue |
|---|---|---|
| Insurance | 3 | $145B |
|
||
| Industrial Machinery | 3 | $49B |
|
||
| Financial Services | 3 | $24B |
|
||
| Consumer Goods | 2 | $93B |
|
||
| Aerospace / Defense | 2 | $47B |
|
||
| Utilities | 2 | $33B |
|
||
Price history
2 events — show timeline
- 2026-05-14 Pending — MLSNOW
- 2026-05-11 Listed $99,900 MLSNOW
Property tax history
+6.8%/yrLatest (2025): $2,359 · +0.2% YoY. Source: county tax records.
Cash-flow waterfall
monthlySold comps — $/sqft
last 12 mo · ≤1 miLoading sold comps…