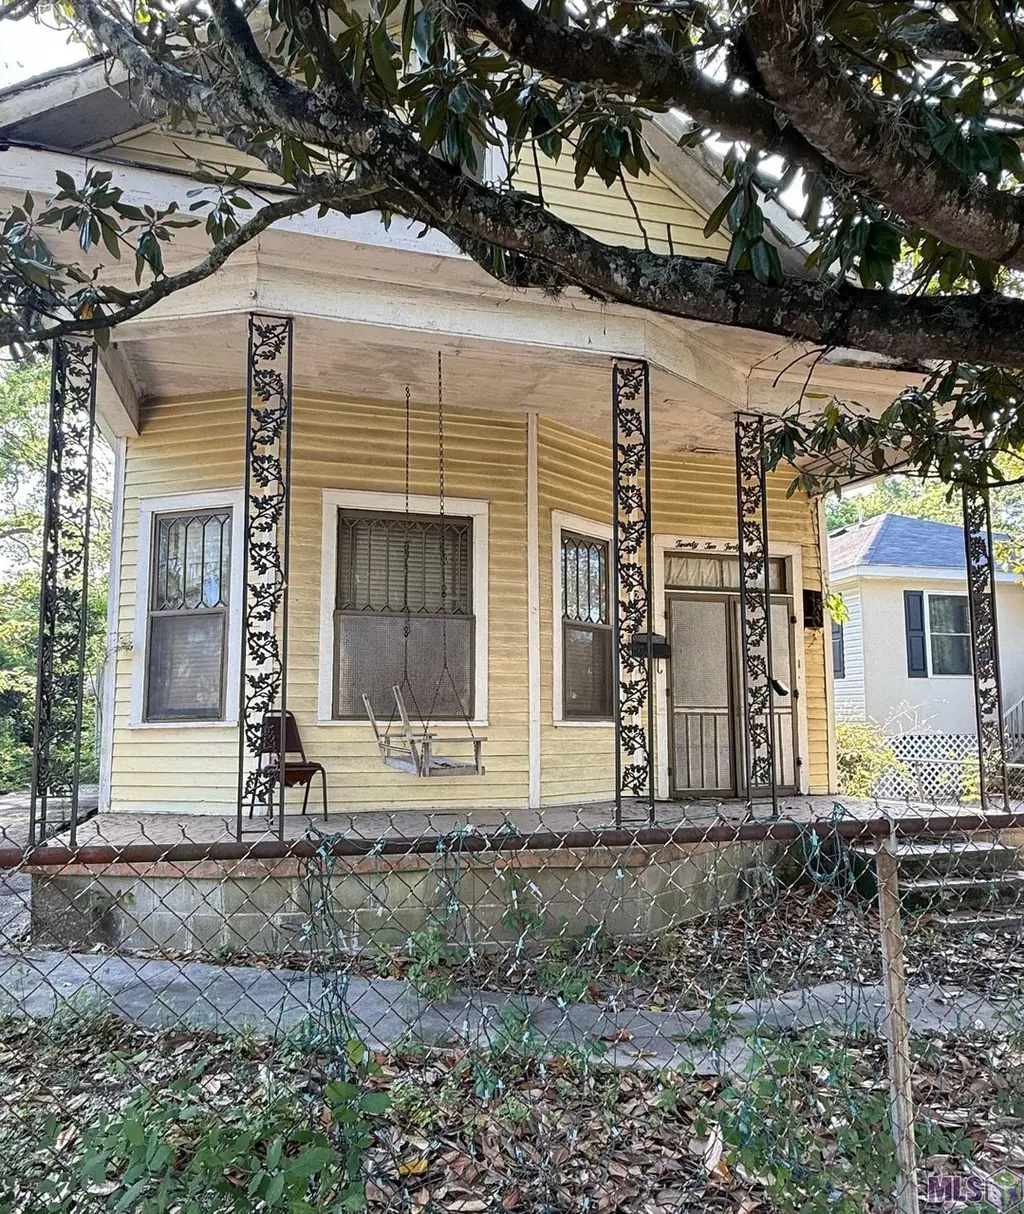
2245 Thomas H Delpit Dr · Baton Rouge, LA
Flood risk 6/10 · Moderate
- FEMA flood zone
- AE
- Chance of flooding over 30 yrs
- 0.74%
- Est. flood insurance / yr
- $1,737 – $8,500
Fire risk 1/10 · Minimal
- Est. fire insurance / yr
- $1,269 – $2,357
Heat risk 8/10 · Major
- Hot days now (above 108°F)
- 7 days/yr
- Hot days in 30 yrs
- 20 days/yr
Wind risk 9/10 · Severe
- Chance of severe wind over 30 yrs
- 99.0%
Air-quality risk 2/10 · Minimal
- Unhealthy air days now
- 1 days/yr
- Unhealthy air days in 30 yrs
- 1 days/yr
Risk factors via First Street. Map © Google.
Why this score? — see what drove the B+ grade
The composite is a weighted blend of 9 inputs, each scored 0–100. Each bar is that input's sub-score; the figure is the points it added to the 100-point composite (weight × sub-score).
- Cash flow +30.0/30.0
- ARV discount +15.0/15.0
- 1% rule +10.0/10.0
- DSCR +10.0/10.0
- Rent growth +4.1/5.0
- Livability +3.7/5.0
- Condition / age +2.5/5.0
- Schools +2.4/10.0
- Appreciation +0.0/10.0
$68,000
🖨 Deal sheet 📄 Offer letter ✓ Due diligence
Listing remarks MLS
Attention investors and renovators! This unique opportunity just 1 minute from LSU offers incredible upside with two homes and one vacant lot included in the sale. Whether you're looking to renovate, rebuild, or develop, this property is loaded with potential in a highly desirable location.
Key facts
- One vacant lot
- Two homes
- 3,920 sq ft lot
Tags
Neighborhood map
What this means for you Summary
Snapshot
- This is a 3-bed/2.0-bath single-family listed at $68k.
Deal economics
- At list price, monthly cash flow is $259 ($3k/yr) — positive.
- The deal already cash-flows at list — no discount required.
- Meets the 1% rule at list price ($1k rent vs $68k).
- Recommended offer: $64k (6.0% below list) — sets the bar for market timing.
- Cap rate 18.4% vs local median 4.3% in Baton Rouge — top-decile yield for the area; either an underpriced asset or a hidden risk that comps aren't pricing in. Stress-test before assuming the spread holds.
Location & tenants
- Location reads 74/100 on livability (#24 in LA, #4,535 nationally) — a middle-class / working-renter tenant base. Strengths: commute A+, cost of living A+, health & safety A+; Watch: amenities D, crime F, employment D-.
- East Baton Rouge Parish (urban): math 22% / reading 34% proficiency, ranked #47 of 98 in LA (top 48%) — low school quality limits family demand, transient renter base, plan for 1-2y turnover; 77% free/reduced lunch — lower-income household profile, screen leases tightly.
- Market conditions: Rents rising fast (+6.6%/yr); 188 active listings in the ZIP; 20 comparable units currently listed for rent nearby; rentals at typical pace (median 23d on market — plan ~3-4 weeks tenant-placement turnaround); 45% of comp listings sitting > 30 days — soft ceiling on asking rent; lower-income renter base — watch delinquency; 2,252 units permitted in East Baton Rouge Parish in 2024 (440 in 5+ unit buildings).
- At $1,380/mo this rent would consume 48% of the median local household income ($34k/yr) (locally 1831% of renters already pay >50% of income on rent) — very limited rent-growth headroom before tenants either downsize or default.
Forward outlook
- Local home prices are declining (-3.0%/yr); year-one equity from $470 of loan paydown is wiped out by about $2k of value loss. Plan a longer hold.
- East Baton Rouge County population projected at +4% by 2050 — modest demand growth; plan on rents tracking national, not racing it.
- At projected returns (-3.0% appreciation + 6.6% rent growth), your $19k cash investment doubles in ~6 years — after that, you're playing with house money.
Negotiation context
- It's been on market 69 days — a 6% lower offer ($64k) is reasonable based on typical stale-listing flexibility.
- 2 sale attempts since 10y ago with the ask held roughly flat each time — persistent listings suggest the price (not the market) is what's stuck; bring a comps-based counter.
Risks & watch-outs
- Watch-outs: flood insurance adds $427/mo.
- Climate carrying-cost: in FEMA flood zone AE (mandatory federal flood insurance); severe wind risk, 99% chance of damaging wind over 30y; extreme-heat days projected 7→20/yr by 2055 (HVAC capex compounding) — expect insurance premiums to compound above CPI over the hold.
Questions for the listing agent
- It's been on market 69 days. Have you received any prior offers? Is the seller open to a 6% concession, seller financing, or rate buy-down credit?
- Built in 1970 — when were the roof, HVAC, electrical panel, plumbing, and water heater last replaced?
- What's the actual annual flood-insurance premium (NFIP or private), and is the property in a SFHA with mandatory coverage?
- Why hasn't it sold? Are there any deal-killer items the seller is aware of (foundation, flood, title, zoning, code violations)?
- Is there a deadline driving the sale (1031 exchange, divorce, estate, relocation)? That informs how much negotiation room exists.
- Crime grade is F in this area — have there been break-ins, vandalism, or insurance claims at this property in the last 3 years? What carrier currently insures it and at what premium?
- What's the average days-on-market for RENTAL listings here right now (not sales)? A rising rental-DOM trend means longer vacancies and softer asking-rent achievability than the comps imply.
- What's the recent tenant-quality profile in this submarket — average credit score on applications, eviction rate, late-payment / NSF rate, and stable-employment percentage? A property-management company in the area should have these aggregated.
- How much new for-sale + rental construction is in the pipeline within 1–3 miles? Heavy new supply typically softens prices + rents 12–24 months out; constrained supply supports both.
Investment metrics
- 1% rule
- 2.03% ✓
- Cap rate
- 18.39%
- Cash-on-cash
- 43.21%
- DSCR
- 2.92
- GRM
- 4.1
CMA / ARV
- ARV (median comp)
- $93,529
- List price
- $68,000
- Delta
- -27.30%
- Verdict
- UNDERPRICED
- Comps
- 20 within 1.0 mi
Show comp detail 12 sales within ~0.75 mi
| Address | Dist | Beds/Ba | Sqft | Sold | Price | $/sf | Match |
|---|---|---|---|---|---|---|---|
| 2163 Colorado St | 0.16mi | 3/2.5 | 1,413 (-6%) | 9mo | $175,000 | $124 | 73 |
| 474 W Grant St | 0.40mi | 3/2.0 | 1,586 (+6%) | 1mo | $85,000 | $54 | 71 |
| 1915 Tennessee St | 0.25mi | 4/2.0 (+1) | 1,600 (+7%) | 8mo | $160,000 | $100 | 66 |
| 676 W Grant St | 0.50mi | 4/2.0 (+1) | 1,580 (+5%) | 4mo | $59,900 | $38 | 60 |
| 2002 Thomas H Delpit Dr | 0.19mi | 3/1.0 | 1,313 (-12%) | 9mo | $98,000 | $75 | 59 |
| 1555 Utah St | 0.51mi | 3/2.0 | 1,468 (-2%) | 20mo | $60,000 | $41 | 56 |
| 1940 Nebraska St | 0.30mi | 3/2.0 | 1,300 (-13%) | 14mo | $34,900 | $27 | 52 |
| 2651 June St | 0.45mi | 2/2.0 (-1) | 1,658 (+10%) | 9mo | $509,900 | $308 | 49 |
| 647 Cotton St | 0.62mi | 3/2.0 | 1,350 (-10%) | 9mo | $125,000 | $93 | 47 |
| 806 Violet St | 0.69mi | 3/2.0 | 1,419 (-5%) | 17mo | $169,900 | $120 | 45 |
| 1555 Fig St | 0.51mi | 3/2.0 | 1,308 (-13%) | 18mo | $215,000 | $164 | 40 |
| 1343 Eddie Robinson Sr Dr | 0.67mi | 3/2.0 | 1,658 (+10%) | 15mo | $67,000 | $40 | 38 |
Match score weights: distance 35% · size 25% · config 20% · recency 20%. Top-matched comps best support the ARV.
Projected returns pro-forma
-3.0% appreciation · 6.59% rent growth · sell at horizon
- IRR
- 13.4%
- Equity multiple
- 1.57×
- Total profit
- $10,886
- Equity at exit
- $10,139
- IRR
- 26.0%
- Equity multiple
- 3.86×
- Total profit
- $54,524
- Equity at exit
- $5,879
Cash invested: $19,040 (down + closing). Projections, not guarantees.
Landlord ↔ Tenant lean methodology
- Overall (STATE)
- 90 Strongly Landlord-Friendly
- State Louisiana
- 90 Strongly Landlord-Friendly · R+12
- County
- — inherits STATE
- City
- — inherits STATE
ZIP-level market 70802
- Rents YoY
- 6.6%
- Active inventory
- 188
- Price-to-rent
- 4.1×
Monthly cashflow live
- Estimated rent
- $1,380 high interval (Pro) →
- Mortgage (P&I)
- −$357
- Tax from tax record
- −$19 /mo · $233/yr
- Insurance
- −$28
- Flood insurance flood zone
- −$427 /mo · $5,118/yr
- HOA
- −$0
- Vacancy / Maint / Mgmt
- −$290
- Net cashflow
- $259
Break-even live
UW: 25.0% down · 7.5% · 30yr · 1.5% tax · 5.0% vac · 8.0% maint · 8.0% mgmt
Financing live
Cash to close
- Down payment
- $17,000
- Closing costs
- $2,040
- Reserves months
- —
- Total cash needed
- —
Loan-product check · same deal, 3 products live
Conventional
25% down · 7.5% · 30yr
- Down + closing
- —
- Monthly P&I
- —
- Monthly cashflow
- —
- DSCR
- —
- Eligible?
- —
Personal DTI + credit; lowest rate.
DSCR
20% down · 8.5% · 30yr
- Down + closing
- —
- Monthly P&I
- —
- Monthly cashflow
- —
- DSCR
- —
- Eligible?
- —
No personal income docs; deal must DSCR.
Hard money
10% down · 12.0% · 12mo
- Down + closing
- —
- Monthly P&I
- —
- Monthly cashflow
- —
- DSCR
- —
- Eligible?
- —
Short-term bridge; refi at stabilization.
Rent comps 20 comps
| Address | Beds | Baths | Sqft | Rent | $/sqft | DOM | Units | Dist |
|---|---|---|---|---|---|---|---|---|
| 470 E McKinley St Baton Rouge, LA | 3.0 | 1.0 | 1200 | $1,185 | $0.99 | 23d | 1 | 0.16mi |
| 1104 E Harrison St Unit A Baton Rouge, LA | 2.0 | 2.0 | 1100 | $975 | $0.89 | 43d | 1 | 0.29mi |
| 2273 Carolina St Baton Rouge, LA | 3.0 | 2.0 | 1244 | $1,050 | $0.84 | 43d | 1 | 0.34mi |
| 634 W Grant St Baton Rouge, LA | 3.0 | 2.0 | 1467 | $1,850 | $1.26 | 43d | 1 | 0.45mi |
| 417 E State St Baton Rouge, LA | 3.0 | 1.0–2.0 | 849 | $1,350 | $1.59 | 14d | 26 | 0.50mi |
| 1538 Fig St Baton Rouge, LA | 3.0 | 1.0 | 1100 | $1,100 | $1.00 | 23d | 1 | 0.52mi |
| 408 E State St Unit B Baton Rouge, LA | 2.0 | 2.0 | 1258 | $1,100 | $0.87 | 43d | 1 | 0.53mi |
| 1430 S 17th St Baton Rouge, LA | 3.0 | 2.0 | 1136 | $3,499 | $3.08 | 43d | 1 | 0.73mi |
| 1702 Terrace Ave Baton Rouge, LA | 4.0 | 2.0 | 1117 | $1,400 | $1.25 | 23d | 1 | 0.80mi |
| 1133 Maximillian St Baton Rouge, LA | 3.0 | 2.0 | 1240 | $1,100 | $0.89 | 43d | 1 | 0.82mi |
| 101 Baton Rouge, LA | 1.0–2.0 | 1.0–2.0 | 803 | $1,696 | $2.11 | 14d | 28 | 0.86mi |
| 2225 Broussard St Baton Rouge, LA | 4.0 | 2.0 | 2000 | $2,400 | $1.20 | 23d | 1 | 1.02mi |
| 2539 Fiero St Baton Rouge, LA | 2.0 | 2.0 | 1752 | $2,600 | $1.48 | 43d | 1 | 1.02mi |
| 802 S 18th St Baton Rouge, LA | 3.0 | 2.0 | 1293 | $1,690 | $1.31 | 23d | 1 | 1.09mi |
| 718 Park Blvd Unit 1 Baton Rouge, LA | 2.0 | 1.0 | 1189 | $1,500 | $1.26 | 23d | 1 | 1.17mi |
| 710 Park Blvd #6 Baton Rouge, LA | 2.0 | 1.0 | 1111 | $1,800 | $1.62 | 14d | 1 | 1.19mi |
| 636 Napoleon St Baton Rouge, LA | 2.0 | 1.0 | 1065 | $1,650 | $1.55 | 14d | 1 | 1.20mi |
| 1035 Rittiner Dr Baton Rouge, LA | 3.0 | 1.0 | 1145 | $1,200 | $1.05 | 14d | 1 | 1.31mi |
| 925 Rittiner Dr Unit 927 Baton Rouge, LA | 3.0 | 1.0 | 1147 | $1,250 | $1.09 | 43d | 1 | 1.36mi |
| 303 S 21st St Baton Rouge, LA | 3.0 | 1.0 | 1070 | $825 | $0.77 | 43d | 1 | 1.49mi |
Listing history 18 events
-
2026-06-18days on market $68,000 Active 69 DOM
-
2026-06-17days on market $68,000 Active 68 DOM
-
2026-06-16days on market $68,000 Active 67 DOM
-
2026-06-15days on market $68,000 Active 66 DOM
-
2026-06-14days on market $68,000 Active 64 DOM
-
2026-06-10days on market $68,000 Active 61 DOM
-
2026-06-09days on market $68,000 Active 60 DOM
-
2026-06-08days on market $68,000 Active 59 DOM
-
2026-06-07days on market $68,000 Active 58 DOM
-
2026-06-05days on market $68,000 Active 55 DOM
-
2026-06-03days on market $68,000 Active 54 DOM
-
2026-06-02days on market $68,000 Active 53 DOM
-
2026-06-01days on market $68,000 Active 52 DOM
-
2026-05-31days on market $68,000 Active 51 DOM
-
2026-05-31days on market $68,000 Active 50 DOM
-
2016-04-10$68,000 Active 291-char remark
Show marketing remark (291 chars)
Attention investors and renovators! This unique opportunity just 1 minute from LSU offers incredible upside with two homes and one vacant lot included in the sale. Whether you're looking to renovate, rebuild, or develop, this property is loaded with potential in a highly desirable location.
-
1984-07-30soldstatus
ⓘ Source: listings_history table (triggers on properties + properties_extension) + one-shot
backfill from property_details.listing_events for pre-trigger history.
Tax reassessment forecast LA · Resets to sale price
- Current annual tax
- $233 · $19/mo
- Projected year-2 tax
- $374 · $31/mo
- Expected delta
- +$141/yr (+$12/mo · 60.5%)
ⓘ Screening estimate from a state-policy table — verify with the county assessor before closing.
Climate risk First Street
- Flood 6/10 Major FEMA zone AE · 74% chance over 30 yrs
- Wildfire 1/10 Low
- Heat 8/10 Severe 7 d/yr ≥108°F today · 20 d/yr by 30 yrs out
- Wind 9/10 Extreme 99% chance of damaging wind over 30 yrs
- Air quality 2/10 Low 1 unhealthy d/yr today · 1 by 30 yrs out
Nearby sold comps map
Loading sold comps map…
Walkable amenities ~0.75 mi
Loading nearby amenities…
Taxation est. · year 1
- Rental income
- $16,556
- − Mortgage interest
- −$3,809
- − Property taxes
- −$233
- − Insurance
- −$5,458
- − Repairs & maintenance
- −$1,324
- − Management
- −$1,324
- − Depreciation
- −$1,978
- Taxable income
- $2,428
- Est. tax owed @ 24.0%
- −$583
- After-tax cash flow
- $2,526/yr
For passive investors: Depreciation is non-cash, so a rental often shows a tax loss while cash-flowing — sheltering income. Rental losses are passive: they offset passive income freely, and up to $25,000/yr can offset ordinary (W-2) income if you actively participate and your MAGI is under $100k (phasing out to $0 by $150k); unused losses carry forward. On sale, claimed depreciation is recaptured at up to 25%, and gains may owe capital-gains tax (a 1031 exchange can defer both). Figures are a year-1 estimate at your 24.0% rate — not tax advice; consult a CPA.
Schools (NCES district)
- District
- East Baton Rouge Parish
- NCES district ID
- 2200540
- Math proficiency
- 22% ▼ -36.00%
- Reading proficiency
- 34% ▼ -31.00%
- Median HH income
- $46,263
- Composite
- 24.14/100
- National rank
- #7745
- State rank
- #47 of 98 in LA
Livability — Baton Rouge
- Score
- 74/100
- State rank
- #24
- US rank
- #4535
Category grades
Schools grade is shown separately in the Schools card above.
Census & demographics
- Census place
- Baton Rouge, LA
- County
- East Baton Rouge Parish · 399,686 people
- City population
- 351,868
- Metro
- Baton Rouge, LA
- Population (ZIP)
- 25,118
- Household income
- $34,458
- Rent vs Own
- Severe rent burden
- 1831.0
Population outlook (East Baton Rouge County) Hauer SSP2
- Today (2025)
- 464,810 people
- By 2030
- 472,137 · +1.6%
- By 2040
- 480,243 · +3.3%
- By 2050
- 484,422 · +4.2%
- By 2075
- 492,069 · +5.9%
- By 2100
- 476,347 · +2.5%
Race, ethnicity, and origin ACS 2023
- Neighborhood character
- Predominantly Black (69%)
- Race & ethnicity
- Black 69% White 20% Two or more races 5% Hispanic / Latino 5% Asian 3%
- Common ancestry
- Lithuanian 2% Italian 1% Iranian 0%
- Foreign-born
- 6% · Canada, Vietnam
- Languages at home
- 91% English-only · Spanish 3% Tagalog/Filipino 1% Other Indo-European 1%
Political lean MEDSL · East Baton Rouge
- 2024 margin
- D (+11.1) · D 54.5% · R 43.4% · Other 2.1%
- 2008→2024 swing
- +8.9pp toward D · 2008: 2.2pp · 2024: 11.1pp
- All cycles
- 2024: D+11.1 2020: D+13.1 2016: D+9.2 2012: D+5.2 2008: D+2.2
Not yet ingested
- Civics
- —
Market trends
- HPI YoY
- ▼ -137.02%
- Current HPI
- 47.7285
- Rent YoY
- ▲ 6.59%
- Metro
- Baton Rouge, LA
- State GDP YoY
- ▲ 3.29%
- F500 in state
- 10
Industry mix (Fortune 500 HQ in LA)
| Industry | F500 HQs | Revenue |
|---|---|---|
| Telecommunications | 2 | $23B |
|
||
| Utilities | 1 | $12B |
|
||
| Wholesale / Distribution | 1 | $5B |
|
||
| Advertising | 1 | $2B |
|
||
Price history
+0.0% since first listed3 events — show timeline
- 2016-04-10 Listed $68,000 AcadianaMLS
- 2016-04-10 Listed $68,000 GBRMLS
- 1984-07-30 Sold (Public Records) — Public Records
Property tax history
+20.5%/yrLatest (2025): $233 · +4.7% YoY. Source: county tax records.
Cash-flow waterfall
monthlySold comps — $/sqft
last 12 mo · ≤1 miLoading sold comps…