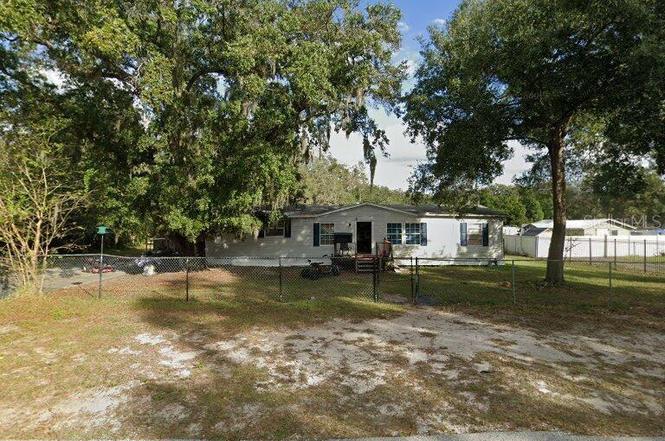
14905 N 24th St · University, FL
Flood risk 1/10 · Minimal
- FEMA flood zone
- X (unshaded)
- Chance of flooding over 30 yrs
- 0.0%
- Est. flood insurance / yr
- $507 – $1,088
Fire risk 1/10 · Minimal
- Est. fire insurance / yr
- $947 – $1,759
Heat risk 10/10 · Severe
- Hot days now (above 109°F)
- 7 days/yr
- Hot days in 30 yrs
- 25 days/yr
Wind risk 9/10 · Severe
- Chance of severe wind over 30 yrs
- 99.0%
Air-quality risk 3/10 · Minor
- Unhealthy air days now
- 4 days/yr
- Unhealthy air days in 30 yrs
- 4 days/yr
Risk factors via First Street. Map © Google.
Why this score? — see what drove the C+ grade
The composite is a weighted blend of 9 inputs, each scored 0–100. Each bar is that input's sub-score; the figure is the points it added to the 100-point composite (weight × sub-score).
- Cash flow +26.3/30.0
- DSCR +8.9/10.0
- 1% rule +8.0/10.0
- ARV discount +7.5/15.0
- Schools +4.2/10.0
- Livability +4.2/5.0
- Condition / age +2.5/5.0
- Rent growth +2.4/5.0
- Appreciation +0.0/10.0
$199,990
🖨 Deal sheet 📄 Offer letter ✓ Due diligence
Listing remarks
Welcome to 14905 N 24th St, a rare find in the desirable Lutz community! This generous 0.67-acre lot offers a prime canvas for your vision in the peaceful Hamners W E Wonderland Acres subdivision, just minutes from local amenities, major roadways, and Tampa’s vibrant attractions. Whether you’re considering building your dream home, expanding your investment portfolio, or creating a private estate, this property provides flexible zoning (AS-1) and a tranquil setting with ample outdoor space. With public water and sewer available, utilities in place, and no HOA fees, it’s a highly versatile opportunity for a variety of uses.
Key facts
- Public sewer
- Flexible zoning
- 0.67-acre lot
Tags
Neighborhood map
What this means for you Summary
Snapshot
- This is a 3-bed/2.0-bath manufactured listed at $200k.
Deal economics
- At list price, monthly cash flow is $518 ($6k/yr) — positive.
- The deal already cash-flows at list — no discount required.
- Meets the 1% rule at list price ($3k rent vs $200k).
- Recommended offer: $182k (9.0% below list) — sets the bar for market timing.
- Cap rate 9.4% vs local median 3.9% in University — top-decile yield for the area; either an underpriced asset or a hidden risk that comps aren't pricing in. Stress-test before assuming the spread holds.
Location & tenants
- Location reads 85/100 on livability (#28 in FL, #603 nationally) — a professional / high-income tenant draw. Strengths: amenities A+, commute A+, cost of living A+.
- Hillsborough (suburban): math 47% / reading 50% proficiency, ranked #41 of 73 in FL (top 56%) — families likely to look elsewhere, expect single-tenant / working-renter base with shorter leases.
- Market conditions: Rents soft (-0.3%/yr); 129 active listings in the ZIP; 40 comparable units currently listed for rent nearby; rentals leasing fast (median 14d on market — plan ~1-2 weeks tenant-placement turnaround); solid renter incomes; 9,053 units permitted in Hillsborough County in 2024 (4,555 in 5+ unit buildings).
- This rent runs 35% of the median local income ($89k/yr) — at the standard rent-burdened threshold; future hikes will face affordability resistance.
Forward outlook
- Local home prices are declining (-3.0%/yr); year-one equity from $1k of loan paydown is wiped out by about $6k of value loss. Plan a longer hold.
- Hillsborough County population projected at +37% by 2050 — long-run rental-demand tailwind backs the buy-and-hold thesis.
Negotiation context
- It's been on market 98 days — a 9% lower offer ($182k) is reasonable based on typical stale-listing flexibility.
- 5 sale attempts; this cycle's ask has dropped $80k (29%) from the opening price — seller is motivated, your offer sets the floor, not the list.
- Current owner paid $18k; list at $200k implies a 1011% gain — meaningful room to come down on a strong offer.
Risks & watch-outs
- Climate carrying-cost: severe wind risk, 99% chance of damaging wind over 30y; extreme-heat days projected 7→25/yr by 2055 (HVAC capex compounding) — expect insurance premiums to compound above CPI over the hold.
Questions for the listing agent
- It's been on market 98 days. Have you received any prior offers? Is the seller open to a 9% concession, seller financing, or rate buy-down credit?
- Why hasn't it sold? Are there any deal-killer items the seller is aware of (foundation, flood, title, zoning, code violations)?
- Is there a deadline driving the sale (1031 exchange, divorce, estate, relocation)? That informs how much negotiation room exists.
- What's the average days-on-market for RENTAL listings here right now (not sales)? A rising rental-DOM trend means longer vacancies and softer asking-rent achievability than the comps imply.
- What's the recent tenant-quality profile in this submarket — average credit score on applications, eviction rate, late-payment / NSF rate, and stable-employment percentage? A property-management company in the area should have these aggregated.
- How much new for-sale + rental construction is in the pipeline within 1–3 miles? Heavy new supply typically softens prices + rents 12–24 months out; constrained supply supports both.
Investment metrics
- 1% rule
- 1.30% ✓
- Cap rate
- 9.40%
- Cash-on-cash
- 11.11%
- DSCR
- 1.49
- GRM
- 6.4
CMA / ARV
No comps found within radius.
Projected returns pro-forma
-3.0% appreciation · 0.0% rent growth · sell at horizon
- IRR
- -3.4%
- Equity multiple
- 0.88×
- Total profit
- $-6,882
- Equity at exit
- $29,819
- IRR
- 2.2%
- Equity multiple
- 1.14×
- Total profit
- $7,612
- Equity at exit
- $17,291
Cash invested: $55,997 (down + closing). Projections, not guarantees.
Landlord ↔ Tenant lean methodology
- Overall (STATE)
- 87 Strongly Landlord-Friendly
- State Florida
- 87 Strongly Landlord-Friendly · R+3
- County
- — inherits STATE
- City
- — inherits STATE
ZIP-level market 33549
- Home prices YoY
- -30.3%
- Rents YoY
- -0.3%
- Active inventory
- 129
- Price-to-rent
- 6.4×
Monthly cashflow live
- Estimated rent
- $2,600 high interval (Pro) →
- Mortgage (P&I)
- −$1,049
- Tax from tax record
- −$403 /mo · $4,842/yr
- Insurance
- −$83
- HOA
- −$0
- Vacancy / Maint / Mgmt
- −$546
- Net cashflow
- $518
Break-even live
UW: 25.0% down · 7.5% · 30yr · 1.5% tax · 5.0% vac · 8.0% maint · 8.0% mgmt
Financing live
Cash to close
- Down payment
- $49,998
- Closing costs
- $6,000
- Reserves months
- —
- Total cash needed
- —
Loan-product check · same deal, 3 products live
Conventional
25% down · 7.5% · 30yr
- Down + closing
- —
- Monthly P&I
- —
- Monthly cashflow
- —
- DSCR
- —
- Eligible?
- —
Personal DTI + credit; lowest rate.
DSCR
20% down · 8.5% · 30yr
- Down + closing
- —
- Monthly P&I
- —
- Monthly cashflow
- —
- DSCR
- —
- Eligible?
- —
No personal income docs; deal must DSCR.
Hard money
10% down · 12.0% · 12mo
- Down + closing
- —
- Monthly P&I
- —
- Monthly cashflow
- —
- DSCR
- —
- Eligible?
- —
Short-term bridge; refi at stabilization.
Rent comps 40 comps
| Address | Beds | Baths | Sqft | Rent | $/sqft | DOM | Units | Dist |
|---|---|---|---|---|---|---|---|---|
| 2503 Black Horse Loop Unit 1295171P Lutz, FL | 4.0 | 4.0 | 1689 | $3,061 | $1.81 | 12d | 1 | 0.11mi |
| 2505 Black Horse Loop Unit 1295158P Lutz, FL | 4.0 | 4.0 | 1689 | $2,374 | $1.41 | 12d | 1 | 0.12mi |
| 15001 Caribou Ct Unit 1018146P Lutz, FL | 4.0 | 4.0 | 1646 | $2,474 | $1.50 | 16d | 1 | 0.19mi |
| 2507 Rustic Ridge Loop Unit 1295167P Lutz, FL | 4.0 | 4.0 | 1689 | $2,971 | $1.76 | 14d | 1 | 0.20mi |
| 2602 Cabin Ct Unit 1295170P Lutz, FL | 4.0 | 4.0 | 1689 | $3,300 | $1.95 | 16d | 1 | 0.22mi |
| 15101 Buckhorn Ct Unit 1295164P Lutz, FL | 4.0 | 4.0 | 1689 | $2,427 | $1.44 | 13d | 1 | 0.23mi |
| 2509 Rustic Ridge Loop Unit 1028633P Lutz, FL | 4.0 | 4.0 | 1657 | $3,811 | $2.30 | 16d | 1 | 0.24mi |
| 15105 Buckhorn Ct Unit 1295159P Lutz, FL | 4.0 | 4.0 | 1689 | $2,519 | $1.49 | 4d | 1 | 0.26mi |
| 2511 Rustic Ridge Loop Unit 1018135P Lutz, FL | 4.0 | 4.0 | 1646 | $2,858 | $1.74 | 13d | 1 | 0.26mi |
| 2601 Rustic Ridge Loop Unit 1028637P Lutz, FL | 4.0 | 4.0 | 1657 | $3,379 | $2.04 | 12d | 1 | 0.29mi |
| 2010 E 148th Ave Lutz, FL | 3.0 | 1.5 | 1250 | $1,650 | $1.32 | 17d | 1 | 0.30mi |
| 2010 E 148th Ave Lutz, FL | 3.0 | 1.5 | 1250 | $1,750 | $1.40 | 24d | 2 | 0.32mi |
| 2604 Rustic Ridge Loop Unit 1295163P Lutz, FL | 4.0 | 4.0 | 1689 | $2,822 | $1.67 | 14d | 1 | 0.33mi |
| 15115 Buckhorn Ct Unit 1295156P Lutz, FL | 4.0 | 4.0 | 1657 | $2,476 | $1.49 | 12d | 1 | 0.36mi |
| 15420 Livingston Ave Lutz, FL | 1.0–3.0 | 1.0–2.0 | 900 | $1,870 | $2.08 | 1d | 9 | 0.36mi |
| 15017 Deer Meadow Dr Lutz, FL | 4.0 | 2.0 | 1444 | $2,180 | $1.51 | 4d | 1 | 0.37mi |
| 14943 Deer Meadow Dr Lutz, FL | 4.0 | 2.0 | 1313 | $2,365 | $1.80 | 1d | 1 | 0.38mi |
| 1908 E 148th Ave Lutz, FL | 3.0 | 1.0 | 1400 | $750 | $0.54 | 24d | 1 | 0.43mi |
| 16013 Stags Leap Dr Lutz, FL | 4.0 | 3.5 | 2082 | $3,800 | $1.83 | 24d | 1 | 0.54mi |
| 2812 Somerset Park Dr Tampa, FL | 1.0–3.0 | 1.0–2.0 | 991 | $1,525 | $1.54 | 2d | 2 | 0.59mi |
| 2812 Somerset Park Dr Tampa, FL | 1.0–3.0 | 1.0–2.0 | 991 | $1,595 | $1.61 | 13d | 2 | 0.59mi |
| 2812 Somerset Park Dr #203 Tampa, FL | 3.0 | 2.0 | 1240 | $1,595 | $1.29 | 21d | 1 | 0.59mi |
| 2124 Oak Chace Ct Unit 2124 Tampa, FL | 2.0 | 1.5 | 1152 | $1,650 | $1.43 | 3d | 1 | 0.66mi |
| 2031 Pine Chace Ct Tampa, FL | 2.0 | 2.5 | 1188 | $1,595 | $1.34 | 24d | 1 | 0.70mi |
| 2835 Somerset Park Dr #203 Tampa, FL | 3.0 | 2.0 | 1240 | $1,800 | $1.45 | 24d | 1 | 0.71mi |
| 14806 Morning Dr Lutz, FL | 3.0 | 2.5 | 1510 | $2,300 | $1.52 | 17d | 1 | 0.80mi |
| 2200 Cedar Trace Cir Tampa, FL | 1.0–3.0 | 1.0–2.0 | 950 | $1,700 | $1.79 | 3d | 14 | 0.81mi |
| 2238 Cedar Trace Cir Tampa, FL | 3.0 | 2.0 | 1177 | $1,600 | $1.36 | 13d | 1 | 0.81mi |
| 1933 Gregory Dr Tampa, FL | 2.0 | 2.0 | 1516 | $1,789 | $1.18 | 3d | 1 | 0.82mi |
| 14309 N 18th St Tampa, FL | 3.0 | 2.0 | 1300 | $1,950 | $1.50 | 24d | 1 | 0.84mi |
| 14627 Pine Glen Cir Lutz, FL | 3.0 | 1.5 | 1178 | $2,100 | $1.78 | 24d | 1 | 0.90mi |
| 15081 Cypress Cay Blvd Lutz, FL | 1.0–2.0 | 1.0–2.5 | 992 | $3,200 | $3.23 | 2d | 18 | 0.92mi |
| 14501 Caribbean Breeze Dr Tampa, FL | 1.0–2.0 | 1.0–2.0 | 837 | $1,671 | $2.00 | 1d | 35 | 0.93mi |
| 1511 McCrea Dr Lutz, FL | 4.0 | 2.0 | 2060 | $3,195 | $1.55 | 2d | 1 | 0.98mi |
| 2902 Sycamore Ct Tampa, FL | 3.0 | 1.0–2.0 | 850 | $1,650 | $1.94 | 2d | 21 | 1.01mi |
| 14201 Cyber Pl Tampa, FL | 1.0–3.0 | 1.0–3.0 | 1099 | $2,506 | $2.28 | 2d | 41 | 1.04mi |
| 14555 Bruce B Downs Blvd Tampa, FL | 1.0–2.0 | 1.0–2.0 | 896 | $1,850 | $2.06 | 1d | 11 | 1.14mi |
| 13614 N 22nd St Unit 101 Tampa, FL | 3.0 | 3.0 | 1740 | $2,650 | $1.52 | 24d | 1 | 1.17mi |
| 13612 N 21st St Tampa, FL | 4.0 | 2.0 | 1196 | $2,400 | $2.01 | 24d | 1 | 1.19mi |
| 13612 N 21st St Unit 2 Tampa, FL | 4.0 | 2.0 | 1196 | $3,000 | $2.51 | 24d | 1 | 1.19mi |
Listing history 21 events
-
2026-04-03status Pending
-
2026-03-04status Active
-
2026-03-04price $199,990
-
2026-02-20status Pending
-
2026-02-09price $204,990
-
2026-02-05price $209,990
-
2026-02-05price $214,990
-
2026-01-16price $219,990
-
2026-01-11price $234,999
-
2026-01-08price $254,999
-
2026-01-06price $264,999
-
2026-01-02price $274,999
-
2025-12-30price $274,900
-
2025-12-14price $279,900
-
2025-12-13$279,900 Active
-
2025-12-12$250,000 Active
-
2025-12-12historical
-
2025-10-15status Active
-
2025-10-13historical
-
2025-07-08$225,000 Active
-
1993-10-05soldstatus $18,000
ⓘ Source: listings_history table (triggers on properties + properties_extension) + one-shot
backfill from property_details.listing_events for pre-trigger history.
Tax reassessment forecast FL · Resets to sale price
- Current annual tax
- $4,842 · $403/mo
- Projected year-2 tax
- $4,842 · $403/mo
- Expected delta
- $0/yr ($0/mo · 0.0%)
ⓘ Screening estimate from a state-policy table — verify with the county assessor before closing.
Climate risk First Street
- Flood 1/10 Low FEMA zone X (unshaded) · 0% chance over 30 yrs
- Wildfire 1/10 Low
- Heat 10/10 Extreme 7 d/yr ≥109°F today · 25 d/yr by 30 yrs out
- Wind 9/10 Extreme 99% chance of damaging wind over 30 yrs
- Air quality 3/10 Moderate 4 unhealthy d/yr today · 4 by 30 yrs out
Nearby sold comps map
Loading sold comps map…
Walkable amenities ~0.75 mi
Loading nearby amenities…
Taxation est. · year 1
- Rental income
- $31,198
- − Mortgage interest
- −$11,203
- − Property taxes
- −$4,842
- − Insurance
- −$1,000
- − Repairs & maintenance
- −$2,496
- − Management
- −$2,496
- − Depreciation
- −$5,818
- Taxable income
- $3,344
- Est. tax owed @ 24.0%
- −$803
- After-tax cash flow
- $5,417/yr
For passive investors: Depreciation is non-cash, so a rental often shows a tax loss while cash-flowing — sheltering income. Rental losses are passive: they offset passive income freely, and up to $25,000/yr can offset ordinary (W-2) income if you actively participate and your MAGI is under $100k (phasing out to $0 by $150k); unused losses carry forward. On sale, claimed depreciation is recaptured at up to 25%, and gains may owe capital-gains tax (a 1031 exchange can defer both). Figures are a year-1 estimate at your 24.0% rate — not tax advice; consult a CPA.
Schools (NCES district)
- District
- Hillsborough
- NCES district ID
- 1200870
- Math proficiency
- 47% ▼ -8.00%
- Reading proficiency
- 50% ▼ -4.00%
- Median HH income
- $50,622
- Composite
- 41.6/100
- National rank
- #3435
- State rank
- #41 of 73 in FL
Livability — University
- Score
- 85/100
- State rank
- #28
- US rank
- #603
Category grades
Schools grade is shown separately in the Schools card above.
Census & demographics
- Census place
- University, FL
- County
- Hillsborough County · 1,540,968 people
- City population
- 41,570
- Metro
- Tampa-St. Petersburg-Clearwater, FL
- Population (ZIP)
- 18,178
- Household income
- $89,343
- Rent vs Own
- Severe rent burden
- 359.0
Population outlook (Hillsborough County) Hauer SSP2
- Today (2025)
- 1,607,022 people
- By 2030
- 1,733,968 · +7.9%
- By 2040
- 1,979,565 · +23.2%
- By 2050
- 2,203,427 · +37.1%
- By 2075
- 2,667,893 · +66.0%
- By 2100
- 2,891,558 · +79.9%
Race, ethnicity, and origin ACS 2023
- Neighborhood character
- Diverse neighborhood (Simpson 0.57)
- Race & ethnicity
- White 60% Hispanic / Latino 25% Two or more races 16% Black 7% Asian 4%
- Hispanic origin (detail)
- Mexican 5% Puerto Rican 7% Cuban 5%
- Common ancestry
- Lithuanian 5% Russian 3% Romanian 3%
- Foreign-born
- 11% · Canada, Vietnam, Guatemala
- Languages at home
- 80% English-only · Spanish 13% Other Indo-European 3% Vietnamese 1%
Political lean MEDSL · Hillsborough
- 2024 margin
- Toss-up / Even · D 47.8% · R 50.9% · Other 1.3%
- 2008→2024 swing
- -10.2pp toward R · 2008: 7.1pp · 2024: -3.1pp
- All cycles
- 2024: R+3.1 2020: D+6.9 2016: D+6.8 2012: D+6.7 2008: D+7.1
Not yet ingested
- Civics
- —
Market trends
- HPI YoY
- ▼ -129.66%
- Current HPI
- 297.9231
- Rent YoY
- ▼ -0.32%
- Metro
- Tampa-St. Petersburg-Clearwater, FL
- State GDP YoY
- ▲ 3.28%
- F500 in state
- 36
Industry mix (Fortune 500 HQ in FL)
| Industry | F500 HQs | Revenue |
|---|---|---|
| Industrial Technology | 2 | $29B |
|
||
| Insurance | 2 | $17B |
|
||
| Retail | 1 | $60B |
|
||
| Technology Distribution | 1 | $58B |
|
||
| Homebuilding | 1 | $35B |
|
||
| Technology Manufacturing | 1 | $35B |
|
||
Price history
+1011.1% since first listed21 events — show timeline
- 2026-04-03 Pending — Stellar MLS as Distributed by MLS Grid
- 2026-03-04 Relisted — Stellar MLS as Distributed by MLS Grid
- 2026-03-04 Price Changed $199,990 Stellar MLS as Distributed by MLS Grid
- 2026-02-20 Pending — Stellar MLS as Distributed by MLS Grid
- 2026-02-09 Price Changed $204,990 Stellar MLS as Distributed by MLS Grid
- 2026-02-05 Price Changed $209,990 Stellar MLS as Distributed by MLS Grid
- 2026-02-05 Price Changed $214,990 Stellar MLS as Distributed by MLS Grid
- 2026-01-16 Price Changed $219,990 Stellar MLS as Distributed by MLS Grid
- 2026-01-11 Price Changed $234,999 Stellar MLS as Distributed by MLS Grid
- 2026-01-08 Price Changed $254,999 Stellar MLS as Distributed by MLS Grid
- 2026-01-06 Price Changed $264,999 Stellar MLS as Distributed by MLS Grid
- 2026-01-02 Price Changed $274,999 Stellar MLS as Distributed by MLS Grid
- 2025-12-30 Price Changed $274,900 Stellar MLS as Distributed by MLS Grid
- 2025-12-14 Price Changed $279,900 Stellar MLS as Distributed by MLS Grid
- 2025-12-13 Listed $279,900 Stellar MLS as Distributed by MLS Grid
- 2025-12-12 Listing Removed — Stellar MLS as Distributed by MLS Grid
- 2025-12-12 Listed $250,000 Stellar MLS as Distributed by MLS Grid
- 2025-10-15 Relisted — Stellar MLS as Distributed by MLS Grid
- 2025-10-13 Listing Removed — Stellar MLS as Distributed by MLS Grid
- 2025-07-08 Listed $225,000 Stellar MLS as Distributed by MLS Grid
- 1993-10-05 Sold (Public Records) $18,000 Public Records
Property tax history
+15.1%/yrLatest (2025): $4,842 · +7.0% YoY. Source: county tax records.
Cash-flow waterfall
monthlySold comps — $/sqft
last 12 mo · ≤1 miLoading sold comps…