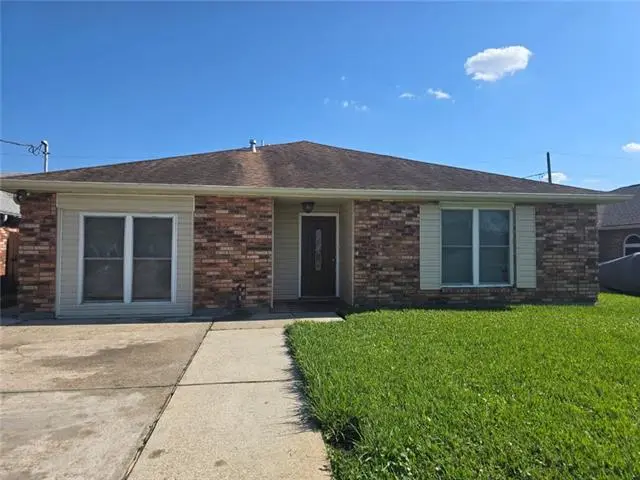
6609 Maumus Ave · New Orleans, LA
Flood risk 8/10 · Major
- FEMA flood zone
- X (shaded)
- Chance of flooding over 30 yrs
- 0.6%
- Est. flood insurance / yr
- $507 – $1,088
Fire risk 1/10 · Minimal
- Est. fire insurance / yr
- $1,269 – $2,357
Heat risk 10/10 · Severe
- Hot days now (above 108°F)
- 7 days/yr
- Hot days in 30 yrs
- 22 days/yr
Wind risk 10/10 · Severe
- Chance of severe wind over 30 yrs
- 99.0%
Air-quality risk 2/10 · Minimal
- Unhealthy air days now
- 2 days/yr
- Unhealthy air days in 30 yrs
- 2 days/yr
Risk factors via First Street. Map © Google.
Why this score? — see what drove the D- grade
The composite is a weighted blend of 9 inputs, each scored 0–100. Each bar is that input's sub-score; the figure is the points it added to the 100-point composite (weight × sub-score).
- Cash flow +17.7/30.0
- DSCR +5.5/10.0
- 1% rule +4.0/10.0
- Livability +4.0/5.0
- Condition / age +2.5/5.0
- Schools +1.6/10.0
- ARV discount +0.6/15.0
- Rent growth +0.2/5.0
- Appreciation +0.0/10.0
$189,000
🖨 Deal sheet 📄 Offer letter ✓ Due diligence
Listing remarks MLS
Beautiful house in a quiet neighborhood just waiting for you to make it a home. The garage have been converted into a 4th bedroom or whatever your design taste desires. The cozy patio off the dinning area is an enhancement for family gatherings or just a place to relax.
Key facts
- Converted garage
- Cozy patio
- 5,000 sq ft lot
Tags
Property features AI
Finance
- Other: City lot, rectangular lot (approx. 50x100)
Exterior
- Parking: Driveway
- Utilities: Public water; Public sewer
- Home design: Single-story; Brick construction; Slab foundation
- Construction: Shingle roof
- Exterior features: Permeable paving; Concrete covered patio/porch
Interior
- Kitchen: Range; Refrigerator
- Bedrooms: 9 total rooms (bedroom count not specified)
- Bathrooms: 2 full bathrooms
- Heating & cooling: Central heating; Central air conditioning
- Interior features: Very good condition
- Laundry & utility: Laundry/utility details not specified
Neighborhood map
What this means for you Summary
Snapshot
- This is a 3-bed/2.0-bath single-family listed at $189k.
Deal economics
- At list price, monthly cash flow is $84 ($1k/yr) — positive.
- The deal already cash-flows at list — no discount required.
- To meet the 1% rule (rent ≥ 1% of price), the offer needs to be $170k (10.2% below list).
- Recommended offer: $170k (10.2% below list) — sets the bar for 1% rule.
- Cap rate 7.2% vs local median 4.4% in New Orleans — top-decile yield for the area; either an underpriced asset or a hidden risk that comps aren't pricing in. Stress-test before assuming the spread holds.
Location & tenants
- Location reads 81/100 on livability (#3 in LA, #1,383 nationally) — a professional / high-income tenant draw. Strengths: amenities A+, commute A+, health & safety A+; Watch: crime C-, employment D.
- Orleans Parish (urban): math 11% / reading 27% proficiency, ranked #69 of 98 in LA (top 70%) — low school quality limits family demand, transient renter base, plan for 1-2y turnover; 68% free/reduced lunch — lower-income household profile, screen leases tightly.
- Market conditions: Rents falling (-9.2%/yr); 274 active listings in the ZIP; 23 comparable units currently listed for rent nearby; rentals at typical pace (median 24d on market — plan ~3-4 weeks tenant-placement turnaround); 710 units permitted in Orleans Parish in 2024 (244 in 5+ unit buildings).
- This rent runs 33% of the median local income ($62k/yr) — at the standard rent-burdened threshold; future hikes will face affordability resistance.
Forward outlook
- Local home prices are declining (-3.0%/yr); year-one equity from $1k of loan paydown is wiped out by about $6k of value loss. Plan a longer hold.
- Orleans County population projected at +61% by 2050 — long-run rental-demand tailwind backs the buy-and-hold thesis.
Negotiation context
- It's been on market 21 days — a 2% lower offer ($186k) is reasonable based on typical stale-listing flexibility.
- 2 sale attempts with the ask held roughly flat each time — persistent listings suggest the price (not the market) is what's stuck; bring a comps-based counter.
- Current owner paid $58k; list at $189k implies a 229% gain — meaningful room to come down on a strong offer.
Risks & watch-outs
- Watch-outs: flood insurance adds $66/mo.
- Climate carrying-cost: severe flood risk; severe wind risk, 99% chance of damaging wind over 30y; extreme-heat days projected 7→22/yr by 2055 (HVAC capex compounding) — expect insurance premiums to compound above CPI over the hold.
Questions for the listing agent
- Built in 1970 — when were the roof, HVAC, electrical panel, plumbing, and water heater last replaced?
- What's the actual annual flood-insurance premium (NFIP or private), and is the property in a SFHA with mandatory coverage?
- Is there a deadline driving the sale (1031 exchange, divorce, estate, relocation)? That informs how much negotiation room exists.
- The area grade is low — what's the realistic commute time and amenity access for the typical tenant pool here? Any planned neighborhood developments (good or bad) we should know about?
- What's the average days-on-market for RENTAL listings here right now (not sales)? A rising rental-DOM trend means longer vacancies and softer asking-rent achievability than the comps imply.
- What's the recent tenant-quality profile in this submarket — average credit score on applications, eviction rate, late-payment / NSF rate, and stable-employment percentage? A property-management company in the area should have these aggregated.
- How much new for-sale + rental construction is in the pipeline within 1–3 miles? Heavy new supply typically softens prices + rents 12–24 months out; constrained supply supports both.
Investment metrics
- 1% rule
- 0.90% ✗
- Cap rate
- 7.25%
- Cash-on-cash
- 3.42%
- DSCR
- 1.15
- GRM
- 9.3
CMA / ARV
- ARV (on-the-fly)
- $163,920
- Comps found
- 12
Show comp detail 12 sales within ~0.75 mi
| Address | Dist | Beds/Ba | Sqft | Sold | Price | $/sf | Match |
|---|---|---|---|---|---|---|---|
| 3421 Dickens Dr | 0.31mi | 3/2.0 | 1,431 (+5%) | 2mo | $179,900 | $126 | 76 |
| 2941 Kent St | 0.46mi | 3/2.0 | 1,350 (-1%) | 2mo | $180,000 | $133 | 75 |
| 3121 Preston Pl | 0.41mi | 3/2.0 | 1,434 (+5%) | 0mo | $189,000 | $132 | 72 |
| 7054 Tullis Dr | 0.38mi | 3/2.0 | 1,290 (-6%) | 4mo | $75,000 | $58 | 69 |
| 3731 Mansfield Ave | 0.17mi | 4/1.5 (+1) | 1,450 (+6%) | 7mo | $50,000 | $34 | 69 |
| 3227 Lancaster St | 0.52mi | 3/1.0 | 1,355 (-1%) | 14mo | $35,000 | $26 | 58 |
| 3300 Mansfield Ave | 0.41mi | 3/2.0 | 1,200 (-12%) | 7mo | $129,900 | $108 | 54 |
| 216 Rhodes Ave | 0.61mi | 3/2.0 | 1,512 (+11%) | 0mo | $130,000 | $86 | 53 |
| 3101 Bacchus Dr | 0.53mi | 4/2.0 (+1) | 1,494 (+9%) | 2mo | $179,900 | $120 | 53 |
| 2821 Bacchus Dr | 0.59mi | 3/2.0 | 1,232 (-10%) | 9mo | $168,000 | $136 | 48 |
| 3148 Blair St | 0.54mi | 3/2.0 | 1,200 (-12%) | 10mo | $169,000 | $141 | 46 |
| 2820 Mansfield Ave | 0.59mi | 3/1.5 | 1,209 (-12%) | 9mo | $125,000 | $103 | 44 |
Match score weights: distance 35% · size 25% · config 20% · recency 20%. Top-matched comps best support the ARV.
Projected returns pro-forma
-3.0% appreciation · 0.0% rent growth · sell at horizon
- IRR
- -16.6%
- Equity multiple
- 0.43×
- Total profit
- $-30,245
- Equity at exit
- $28,181
- IRR
- -14.7%
- Equity multiple
- 0.27×
- Total profit
- $-38,676
- Equity at exit
- $16,341
Cash invested: $52,920 (down + closing). Projections, not guarantees.
Landlord ↔ Tenant lean methodology
- Overall (STATE)
- 90 Strongly Landlord-Friendly
- State Louisiana
- 90 Strongly Landlord-Friendly · R+12
- County
- — inherits STATE
- City
- — inherits STATE
ZIP-level market 70131
- Home prices YoY
- -12.0%
- Rents YoY
- -9.2%
- Active inventory
- 274
- Price-to-rent
- 9.3×
Monthly cashflow live
- Estimated rent
- $1,697 high interval (Pro) →
- Mortgage (P&I)
- −$991
- Tax from tax record
- −$120 /mo · $1,443/yr
- Insurance
- −$79
- Flood insurance flood zone
- −$66 /mo · $798/yr
- HOA
- −$0
- Vacancy / Maint / Mgmt
- −$356
- Net cashflow
- $84
Break-even live
UW: 25.0% down · 7.5% · 30yr · 1.5% tax · 5.0% vac · 8.0% maint · 8.0% mgmt
Financing live
Cash to close
- Down payment
- $47,250
- Closing costs
- $5,670
- Reserves months
- —
- Total cash needed
- —
Loan-product check · same deal, 3 products live
Conventional
25% down · 7.5% · 30yr
- Down + closing
- —
- Monthly P&I
- —
- Monthly cashflow
- —
- DSCR
- —
- Eligible?
- —
Personal DTI + credit; lowest rate.
DSCR
20% down · 8.5% · 30yr
- Down + closing
- —
- Monthly P&I
- —
- Monthly cashflow
- —
- DSCR
- —
- Eligible?
- —
No personal income docs; deal must DSCR.
Hard money
10% down · 12.0% · 12mo
- Down + closing
- —
- Monthly P&I
- —
- Monthly cashflow
- —
- DSCR
- —
- Eligible?
- —
Short-term bridge; refi at stabilization.
Rent comps 23 comps
| Address | Beds | Baths | Sqft | Rent | $/sqft | DOM | Units | Dist |
|---|---|---|---|---|---|---|---|---|
| 4020 Sullen Pl New Orleans, LA | 4.0 | 2.5 | 1280 | $1,400 | $1.09 | 3d | 1 | 0.19mi |
| 6121 Stratford Pl New Orleans, LA | 3.0 | 2.0 | 1225 | $1,800 | $1.47 | 16d | 1 | 0.35mi |
| 4254 Maple Leaf Dr New Orleans, LA | 1.0–3.0 | 1.0–2.5 | 1354 | $1,687 | $1.25 | 1d | 8 | 0.42mi |
| 3531 Adrian St New Orleans, LA | 3.0 | 2.0 | 1292 | $1,895 | $1.47 | 16d | 1 | 0.46mi |
| 3200 Lancaster St New Orleans, LA | 4.0 | 2.0 | 1678 | $2,200 | $1.31 | 23d | 1 | 0.53mi |
| 5997 Tullis Dr Unit B New Orleans, LA | 3.0 | 2.0 | 1003 | $1,250 | $1.25 | 14d | 1 | 0.66mi |
| 5997 Tullis Dr Unit B New Orleans, LA | 3.0 | 2.0 | 1003 | $1,250 | $1.25 | 23d | 1 | 0.66mi |
| 5987 Tullis Dr New Orleans, LA | 2.0 | 1.5 | 1179 | $1,150 | $0.98 | 17d | 1 | 0.67mi |
| 5987 Tullis Dr New Orleans, LA | 2.0 | 1.5 | 1179 | $1,100 | $0.93 | 2d | 1 | 0.67mi |
| 6021 Brighton Pl New Orleans, LA | 4.0 | 3.0 | 1840 | $3,100 | $1.68 | 16d | 1 | 0.73mi |
| 4479 Woodland Dr Unit A New Orleans, LA | 2.0 | 2.5 | 1300 | $1,500 | $1.15 | 23d | 1 | 0.81mi |
| 5823 Tullis Dr New Orleans, LA | 3.0 | 1.5 | 1637 | $1,600 | $0.98 | 23d | 1 | 0.88mi |
| 5797 Tullis Dr New Orleans, LA | 3.0 | 1.5 | 1240 | $1,600 | $1.29 | 23d | 1 | 0.90mi |
| 5000 Woodland Dr New Orleans, LA | 2.0 | 1.0–2.5 | 943 | $1,457 | $1.55 | 23d | 1 | 0.94mi |
| 130 Cypress Grove Ct #92 New Orleans, LA | 2.0 | 1.5 | 1381 | $1,550 | $1.12 | 16d | 1 | 1.12mi |
| 3751 Herald St New Orleans, LA | 4.0 | 2.0 | 1624 | $2,150 | $1.32 | 23d | 1 | 1.18mi |
| 3151 Plymouth Pl New Orleans, LA | 3.0 | 1.0 | 1470 | $1,700 | $1.16 | 23d | 1 | 1.18mi |
| 5501 Tullis Dr New Orleans, LA | 1.0–2.0 | 1.0–2.0 | 792 | $1,575 | $1.99 | 23d | 1 | 1.19mi |
| 3429 Bryson St New Orleans, LA | 3.0 | 2.0 | 1250 | $2,200 | $1.76 | 23d | 1 | 1.22mi |
| 3408 Bryson St New Orleans, LA | 3.0 | 2.0 | 1163 | $2,200 | $1.89 | 23d | 1 | 1.25mi |
| 3653 Timber Bluff Ln New Orleans, LA | 4.0 | 2.0 | 1800 | $2,500 | $1.39 | 43d | 1 | 1.37mi |
| 5200 Timber Crest Dr New Orleans, LA | 4.0 | 2.0 | 1530 | $1,800 | $1.18 | 23d | 1 | 1.39mi |
| 3320 Kabel Dr Unit C New Orleans, LA | 3.0 | 2.0 | 999 | $1,100 | $1.10 | 3d | 1 | 1.49mi |
Listing history 19 events
-
2026-06-18days on market $189,000 Active 21 DOM
-
2026-06-17days on market $189,000 Active 20 DOM
-
2026-06-16days on market $189,000 Active 19 DOM
-
2026-06-15days on market $189,000 Active 18 DOM
-
2026-06-13days on market $189,000 Active 16 DOM
-
2026-06-10days on market $189,000 Active 13 DOM
-
2026-06-09days on market $189,000 Active 12 DOM
-
2026-06-08days on market $189,000 Active 11 DOM
-
2026-06-07days on market $189,000 Active 10 DOM
-
2026-06-05remarks 347-char remark
-
2026-06-05days on market $189,000 Active 7 DOM
-
2026-06-03days on market $189,000 Active 6 DOM
-
2026-06-02days on market $189,000 Active 5 DOM
-
2026-06-01days on market $189,000 Active 4 DOM
-
2026-05-31days on market $189,000 Active 3 DOM
-
2026-05-28$189,000 Active
Show marketing remark (270 chars)
Beautiful house in a quiet neighborhood just waiting for you to make it a home. The garage have been converted into a 4th bedroom or whatever your design taste desires. The cozy patio off the dinning area is an enhancement for family gatherings or just a place to relax.
-
2026-05-28$189,000 Active 270-char remark
Show marketing remark (270 chars)
Beautiful house in a quiet neighborhood just waiting for you to make it a home. The garage have been converted into a 4th bedroom or whatever your design taste desires. The cozy patio off the dinning area is an enhancement for family gatherings or just a place to relax.
-
1995-02-07soldstatus $57,500
-
1977-05-25soldstatus $37,325
ⓘ Source: listings_history table (triggers on properties + properties_extension) + one-shot
backfill from property_details.listing_events for pre-trigger history.
Tax reassessment forecast LA · Resets to sale price
- Current annual tax
- $1,443 · $120/mo
- Projected year-2 tax
- $1,443 · $120/mo
- Expected delta
- $0/yr ($0/mo · 0.0%)
ⓘ Screening estimate from a state-policy table — verify with the county assessor before closing.
Climate risk First Street
- Flood 8/10 Severe FEMA zone X (shaded) · 60% chance over 30 yrs
- Wildfire 1/10 Low
- Heat 10/10 Extreme 7 d/yr ≥108°F today · 22 d/yr by 30 yrs out
- Wind 10/10 Extreme 99% chance of damaging wind over 30 yrs
- Air quality 2/10 Low 2 unhealthy d/yr today · 2 by 30 yrs out
Nearby sold comps map
Loading sold comps map…
Walkable amenities ~0.75 mi
Loading nearby amenities…
Taxation est. · year 1
- Rental income
- $20,366
- − Mortgage interest
- −$10,587
- − Property taxes
- −$1,443
- − Insurance
- −$1,742
- − Repairs & maintenance
- −$1,629
- − Management
- −$1,629
- − Depreciation
- −$5,498
- Taxable loss
- −$2,163
- Est. tax savings @ 24.0%
- +$519
- After-tax cash flow
- $1,529/yr
For passive investors: Depreciation is non-cash, so a rental often shows a tax loss while cash-flowing — sheltering income. Rental losses are passive: they offset passive income freely, and up to $25,000/yr can offset ordinary (W-2) income if you actively participate and your MAGI is under $100k (phasing out to $0 by $150k); unused losses carry forward. On sale, claimed depreciation is recaptured at up to 25%, and gains may owe capital-gains tax (a 1031 exchange can defer both). Figures are a year-1 estimate at your 24.0% rate — not tax advice; consult a CPA.
Schools (NCES district)
- District
- Orleans Parish
- NCES district ID
- 2201170
- Math proficiency
- 11% ▼ -52.00%
- Reading proficiency
- 27% ▼ -46.00%
- Median HH income
- $37,011
- Composite
- 15.78/100
- National rank
- #9271
- State rank
- #69 of 98 in LA
Livability — New Orleans
- Score
- 81/100
- State rank
- #3
- US rank
- #1383
Category grades
Schools grade is shown separately in the Schools card above.
Census & demographics
- Census place
- New Orleans, LA
- County
- Orleans Parish · 338,817 people
- City population
- 338,817
- Metro
- New Orleans-Metairie, LA
- Population (ZIP)
- 25,151
- Household income
- $62,389
- Rent vs Own
- Severe rent burden
- 707.0
Population outlook (Orleans County) Hauer SSP2
- Today (2025)
- 513,025 people
- By 2030
- 575,781 · +12.2%
- By 2040
- 700,174 · +36.5%
- By 2050
- 826,541 · +61.1%
- By 2075
- 1,123,374 · +119.0%
- By 2100
- 1,355,609 · +164.2%
Race, ethnicity, and origin ACS 2023
- Neighborhood character
- Diverse neighborhood (Simpson 0.57)
- Race & ethnicity
- Black 62% White 20% Hispanic / Latino 11% Two or more races 6% Asian 4%
- Hispanic origin (detail)
- Mexican 2% Dominican 2%
- Common ancestry
- Lithuanian 4% Hispanic 1%
- Foreign-born
- 8% · Canada, Vietnam, China
- Languages at home
- 86% English-only · Spanish 9% Vietnamese 2% French/Haitian/Cajun 1%
Political lean MEDSL · Orleans
- 2024 margin
- Solid D (+67.0) · D 82.2% · R 15.2% · Other 2.7%
- 2008→2024 swing
- +6.7pp toward D · 2008: 60.3pp · 2024: 67.0pp
- All cycles
- 2024: D+67.0 2020: D+68.2 2016: D+66.2 2012: D+62.5 2008: D+60.3
Not yet ingested
- Civics
- —
Market trends
- HPI YoY
- ▼ -28.08%
- Current HPI
- 206.7552
- Rent YoY
- ▼ -9.23%
- Metro
- New Orleans-Metairie, LA
- State GDP YoY
- ▲ 3.29%
- F500 in state
- 10
Industry mix (Fortune 500 HQ in LA)
| Industry | F500 HQs | Revenue |
|---|---|---|
| Telecommunications | 2 | $23B |
|
||
| Utilities | 1 | $12B |
|
||
| Wholesale / Distribution | 1 | $5B |
|
||
| Advertising | 1 | $2B |
|
||
Price history
+406.4% since first listed4 events — show timeline
- 2026-05-28 Listed $189,000 AcadianaMLS
- 2026-05-28 Listed $189,000 GSREIN
- 1995-02-07 Sold (Public Records) $57,500 Public Records
- 1977-05-25 Sold (Public Records) $37,325 Public Records
Property tax history
+19.3%/yrLatest (2026): $1,443 · +0.0% YoY. Source: county tax records.
Cash-flow waterfall
monthlySold comps — $/sqft
last 12 mo · ≤1 miLoading sold comps…