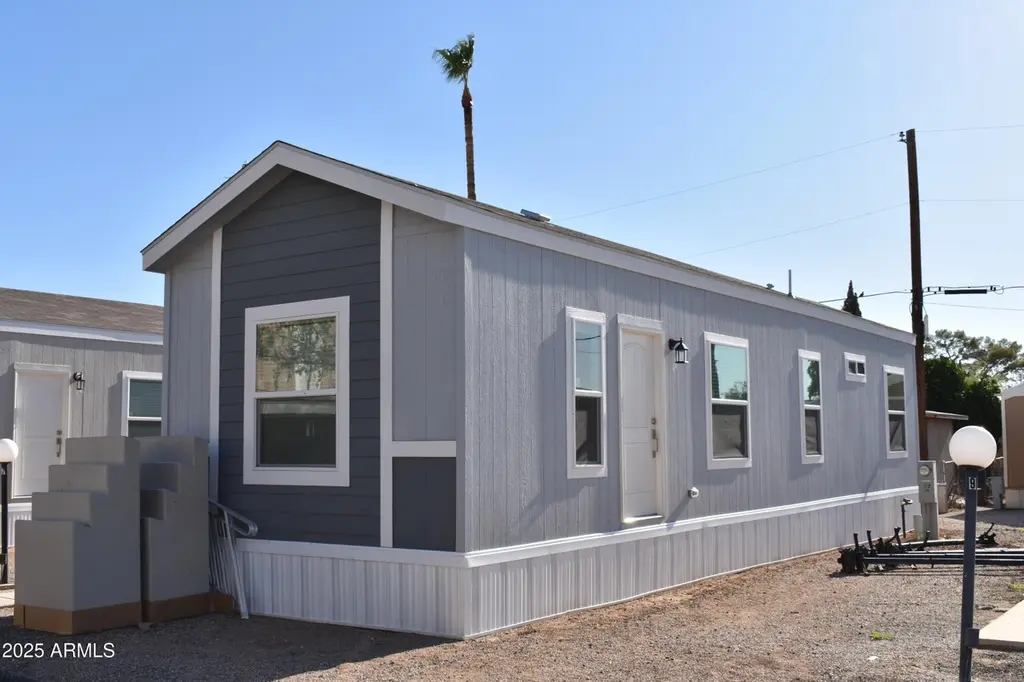
620 W Limberlost Dr Unit E3 · Tucson, AZ
Flood risk 1/10 · Minimal
- FEMA flood zone
- X (unshaded)
- Chance of flooding over 30 yrs
- 0.0%
- Est. flood insurance / yr
- $507 – $1,088
Fire risk 1/10 · Minimal
- Est. fire insurance / yr
- $610 – $1,132
Heat risk 8/10 · Major
- Hot days now (above 107°F)
- 7 days/yr
- Hot days in 30 yrs
- 18 days/yr
Wind risk 1/10 · Minimal
- Chance of severe wind over 30 yrs
- —
Air-quality risk 1/10 · Minimal
- Unhealthy air days now
- 0 days/yr
- Unhealthy air days in 30 yrs
- 0 days/yr
Risk factors via First Street. Map © Google.
Why this score? — see what drove the B grade
The composite is a weighted blend of 9 inputs, each scored 0–100. Each bar is that input's sub-score; the figure is the points it added to the 100-point composite (weight × sub-score).
- Cash flow +30.0/30.0
- 1% rule +10.0/10.0
- DSCR +10.0/10.0
- ARV discount +7.5/15.0
- Condition / age +4.0/5.0
- Livability +3.7/5.0
- Schools +3.1/10.0
- Rent growth +2.6/5.0
- Appreciation +0.0/10.0
$59,900
🖨 Deal sheet 📄 Offer letter ✓ Due diligence
Listing remarks MLS
**Home is in an age qualified 55+ community. 1 person must be 55 years old and the secondary age is 40+. OWNER WILL FINANCE! This is a BRAND NEW 2 bed/2 bath home with private parking. Home comes equipped with stainless steel appliances, open floorplan, and washer and dryer hook ups. Tons of storage in the kitchen and house with walk in closets in both rooms. This community is centrally located near parks, shopping, Tucson Mall, restaurants, and the freeway. Multiple units available!
Key facts
- 1,000 sq ft lot
- Parking
- Built 1965
Neighborhood map
What this means for you Summary
Snapshot
- This is a 2-bed/2.0-bath manufactured listed at $60k. Condition is rated good.
Deal economics
- At list price, monthly cash flow is $407 ($5k/yr) — positive.
- The deal already cash-flows at list — no discount required.
- Meets the 1% rule at list price ($1k rent vs $60k).
- Recommended offer: $53k (12.0% below list) — sets the bar for market timing.
- Cap rate 14.4% vs local median 3.7% in Tucson — top-decile yield for the area; either an underpriced asset or a hidden risk that comps aren't pricing in. Stress-test before assuming the spread holds.
Location & tenants
- Location reads 74/100 on livability (#17 in AZ, #4,502 nationally) — a middle-class / working-renter tenant base. Strengths: commute A+, cost of living A+, housing A+; Watch: health & safety C-, schools D+, crime F.
- Amphitheater Unified District (4406) (suburban): math 32% / reading 40% proficiency, ranked #85 of 249 in AZ (top 34%) — families likely to look elsewhere, expect single-tenant / working-renter base with shorter leases.
- Market conditions: Rents flat; 177 active listings in the ZIP; 40 comparable units currently listed for rent nearby; rentals at typical pace (median 24d on market — plan ~3-4 weeks tenant-placement turnaround); 40% of comp listings sitting > 30 days — soft ceiling on asking rent; lower-income renter base — watch delinquency; 5,268 units permitted in Pima County in 2024 (996 in 5+ unit buildings).
- This rent runs 34% of the median local income ($37k/yr) — at the standard rent-burdened threshold; future hikes will face affordability resistance.
Forward outlook
- Local home prices are declining (-3.0%/yr); year-one equity from $414 of loan paydown is wiped out by about $2k of value loss. Plan a longer hold.
- Pima County population projected at +8% by 2050 — modest demand growth; plan on rents tracking national, not racing it.
- At projected returns (-3.0% appreciation + 0.3% rent growth), your $17k cash investment doubles in ~5 years — after that, you're playing with house money.
Negotiation context
- It's been on market 267 days — a 12% lower offer ($53k) is reasonable based on typical stale-listing flexibility.
Risks & watch-outs
- Climate carrying-cost: extreme-heat days projected 7→18/yr by 2055 (HVAC capex compounding) — expect insurance premiums to compound above CPI over the hold.
Questions for the listing agent
- It's been on market 267 days. Have you received any prior offers? Is the seller open to a 12% concession, seller financing, or rate buy-down credit?
- Built in 1965 — when were the roof, HVAC, electrical panel, plumbing, and water heater last replaced?
- Why hasn't it sold? Are there any deal-killer items the seller is aware of (foundation, flood, title, zoning, code violations)?
- Is there a deadline driving the sale (1031 exchange, divorce, estate, relocation)? That informs how much negotiation room exists.
- Schools are D-rated, which usually means shorter tenancies and higher turnover. Who's the typical renter profile here, and what's been the actual vacancy rate?
- Crime grade is F in this area — have there been break-ins, vandalism, or insurance claims at this property in the last 3 years? What carrier currently insures it and at what premium?
- What's the average days-on-market for RENTAL listings here right now (not sales)? A rising rental-DOM trend means longer vacancies and softer asking-rent achievability than the comps imply.
- What's the recent tenant-quality profile in this submarket — average credit score on applications, eviction rate, late-payment / NSF rate, and stable-employment percentage? A property-management company in the area should have these aggregated.
- How much new for-sale + rental construction is in the pipeline within 1–3 miles? Heavy new supply typically softens prices + rents 12–24 months out; constrained supply supports both.
Investment metrics
- 1% rule
- 1.73% ✓
- Cap rate
- 14.45%
- Cash-on-cash
- 29.11%
- DSCR
- 2.30
- GRM
- 4.8
CMA / ARV
- ARV (median comp)
- $25,000
- List price
- $59,900
- Delta
- 139.60%
- Verdict
- OVERPRICED
- Comps
- 3 within 1.0 mi
Show comp detail 2 sales within ~0.75 mi
| Address | Dist | Beds/Ba | Sqft | Sold | Price | $/sf | Match |
|---|---|---|---|---|---|---|---|
| 620 W Limberlost Dr #18 | 0.05mi | 2/2.0 | 780 (+7%) | 3mo | $25,000 | $32 | 83 |
| 3833 N Fairview Ave #127 | 0.61mi | 1/1.0 (-1) | 720 (-1%) | 4mo | $11,000 | $15 | 58 |
Match score weights: distance 35% · size 25% · config 20% · recency 20%. Top-matched comps best support the ARV.
Projected returns pro-forma
-3.0% appreciation · 0.3% rent growth · sell at horizon
- IRR
- 20.4%
- Equity multiple
- 1.80×
- Total profit
- $13,478
- Equity at exit
- $8,931
- IRR
- 26.7%
- Equity multiple
- 3.06×
- Total profit
- $34,487
- Equity at exit
- $5,179
Cash invested: $16,772 (down + closing). Projections, not guarantees.
Landlord ↔ Tenant lean methodology
- Overall (STATE)
- 87 Strongly Landlord-Friendly
- State Arizona
- 87 Strongly Landlord-Friendly · R+3
- County
- — inherits STATE
- City
- — inherits STATE
ZIP-level market 85705
- Rents YoY
- 0.3%
- Active inventory
- 177
- Price-to-rent
- 4.8×
Monthly cashflow live
- Estimated rent
- $1,039 high interval (Pro) →
- Mortgage (P&I)
- −$314
- Tax est. 1.5%
- −$75 /mo · $898/yr
- Insurance
- −$25
- HOA
- −$0
- Vacancy / Maint / Mgmt
- −$218
- Net cashflow
- $407
Break-even live
UW: 25.0% down · 7.5% · 30yr · 1.5% tax · 5.0% vac · 8.0% maint · 8.0% mgmt
Financing live
Cash to close
- Down payment
- $14,975
- Closing costs
- $1,797
- Reserves months
- —
- Total cash needed
- —
Loan-product check · same deal, 3 products live
Conventional
25% down · 7.5% · 30yr
- Down + closing
- —
- Monthly P&I
- —
- Monthly cashflow
- —
- DSCR
- —
- Eligible?
- —
Personal DTI + credit; lowest rate.
DSCR
20% down · 8.5% · 30yr
- Down + closing
- —
- Monthly P&I
- —
- Monthly cashflow
- —
- DSCR
- —
- Eligible?
- —
No personal income docs; deal must DSCR.
Hard money
10% down · 12.0% · 12mo
- Down + closing
- —
- Monthly P&I
- —
- Monthly cashflow
- —
- DSCR
- —
- Eligible?
- —
Short-term bridge; refi at stabilization.
Rent comps 40 comps
| Address | Beds | Baths | Sqft | Rent | $/sqft | DOM | Units | Dist |
|---|---|---|---|---|---|---|---|---|
| 620 W Limberlost Dr Unit E24 Tucson, AZ | 2.0 | 1.0 | 672 | $1,200 | $1.79 | 23d | 1 | 0.03mi |
| 239 W Limberlost Dr Tucson, AZ | 1.0 | 1.0 | 680 | $795 | $1.17 | 43d | 1 | 0.40mi |
| 115 W Limberlost Dr Tucson, AZ | 1.0–2.0 | 1.0–2.0 | 806 | $1,350 | $1.67 | 23d | 1 | 0.52mi |
| 1089 W Schafer Dr Unit 4 Tucson, AZ | 1.0 | 1.0 | 350 | $750 | $2.14 | 21d | 1 | 0.52mi |
| 532 W Simmons Rd Tucson, AZ | 1.0 | 1.0 | 566 | $1,000 | $1.77 | 17d | 1 | 0.59mi |
| 30 E Camino Villas Tucson, AZ | 1.0 | 1.0 | 440 | $753 | $1.71 | 21d | 1 | 0.62mi |
| 1215 W Roger Rd Unit 1241-14 Tucson, AZ | 1.0 | 1.0 | 670 | $895 | $1.34 | 43d | 1 | 0.67mi |
| 3985 N Stone Ave Tucson, AZ | 1.0–2.0 | 1.0–2.0 | 625 | $1,075 | $1.72 | 16d | 21 | 0.69mi |
| 3985 N Stone Ave Tucson, AZ | 1.0–2.0 | 1.0–2.0 | 625 | $1,280 | $2.05 | 43d | 1 | 0.69mi |
| 3985 N Stone Ave Unit 251 Tucson, AZ | 1.0 | 1.0 | 500 | $695 | $1.39 | 11d | 1 | 0.69mi |
| 3985 N Stone Ave Unit 248 Tucson, AZ | 2.0 | 1.0 | 700 | $979 | $1.40 | 11d | 1 | 0.69mi |
| 311 W Pastime Rd Tucson, AZ | 1.0 | 1.0 | 720 | $995 | $1.38 | 21d | 1 | 0.70mi |
| 822 W Thurber Rd Unit B Tucson, AZ | 2.0 | 1.0 | 750 | $825 | $1.10 | 43d | 1 | 0.72mi |
| 3700 N Fairview Ave Unit 104 Tucson, AZ | 1.0 | 1.0 | 444 | $949 | $2.14 | 3d | 1 | 0.74mi |
| 124 W Pastime Rd Tucson, AZ | 2.0 | 1.0 | 650 | $1,075 | $1.65 | 3d | 1 | 0.76mi |
| 1355 W Roger Rd Tucson, AZ | 1.0–2.0 | 1.0–2.0 | 627 | $1,084 | $1.73 | 43d | 4 | 0.78mi |
| 570 W Prince Rd Tucson, AZ | 1.0–2.0 | 1.0 | 788 | $975 | $1.24 | 43d | 13 | 0.79mi |
| 520 W Prince Rd Tucson, AZ | 1.0–2.0 | 1.0 | 557 | $1,076 | $1.93 | 3d | 16 | 0.80mi |
| 50 W King Rd Unit 09 Tucson, AZ | 1.0 | 1.0 | 600 | $775 | $1.29 | 3d | 1 | 0.84mi |
| 50 W King Rd Apt 11 Tucson, AZ | 1.0 | 1.0 | 650 | $795 | $1.22 | 20d | 1 | 0.84mi |
| 3802 N Flowing Wells Rd Tucson, AZ | 1.0–2.0 | 1.0 | 555 | $1,100 | $1.98 | 43d | 5 | 0.88mi |
| 120 W Prince Rd Tucson, AZ | 1.0 | 1.0 | 480 | $702 | $1.46 | 3d | 2 | 0.91mi |
| 402 E Limberlost Dr Unit 106 Tucson, AZ | 1.0 | 1.0 | 528 | $785 | $1.49 | 43d | 1 | 0.98mi |
| 402 E Limberlost Dr Unit 202 Tucson, AZ | 2.0 | 1.0 | 676 | $1,025 | $1.52 | 43d | 1 | 0.98mi |
| 402 E Limberlost Dr Apt 108 Tucson, AZ | 2.0 | 1.0 | 676 | $895 | $1.32 | 3d | 1 | 0.98mi |
| 402 E Limberlost Dr Unit 207 Tucson, AZ | 2.0 | 1.0 | 676 | $925 | $1.37 | 23d | 1 | 1.00mi |
| 95 W Windsor St Tucson, AZ | 1.0 | 1.0 | 700 | $965 | $1.38 | 43d | 1 | 1.06mi |
| 208 E Prince Rd Unit POP1101 Tucson, AZ | 1.0 | 1.0 | 391 | $725 | $1.85 | 23d | 1 | 1.12mi |
| 4225 N 1st Ave Tucson, AZ | 1.0–2.0 | 1.0–2.0 | 678 | $1,294 | $1.91 | 2d | 40 | 1.16mi |
| 60 W Stone Loop Tucson, AZ | 2.0 | 1.0 | 588 | $1,395 | $2.37 | 2d | 46 | 1.17mi |
| 3450 N Stone Ave Tucson, AZ | 1.0–2.0 | 1.0 | 706 | $1,275 | $1.81 | 11d | 7 | 1.20mi |
| 3450 N Stone Ave Tucson, AZ | 1.0 | 1.0 | 651 | $850 | $1.31 | 43d | 1 | 1.20mi |
| 446 E Pastime Rd Tucson, AZ | 1.0–2.0 | 1.0 | 750 | $1,095 | $1.46 | 3d | 2 | 1.22mi |
| 3450 N Stone Ave Apt 215 Tucson, AZ | 1.0 | 1.0 | 651 | $1,091 | $1.68 | 43d | 1 | 1.22mi |
| 3525 N Fontana Ave Unit 2 Tucson, AZ | 2.0 | 1.0 | 750 | $1,000 | $1.33 | 43d | 1 | 1.22mi |
| 326 E Prince Rd Unit 01 Tucson, AZ | 2.0 | 1.0 | 530 | $995 | $1.88 | 23d | 1 | 1.24mi |
| 405 E Prince Rd Tucson, AZ | 1.0–2.0 | 1.0 | 588 | $1,399 | $2.38 | 43d | 12 | 1.25mi |
| 5100 N La Canada Dr Tucson, AZ | 1.0 | 1.0 | 686 | $1,343 | $1.96 | 44d | 1 | 1.27mi |
| 730 E Limberlost Dr Unit HA730-116 Tucson, AZ | 1.0 | 1.0 | 425 | $825 | $1.94 | 43d | 1 | 1.30mi |
| 730 E Limberlost Dr Unit HA730-111B Tucson, AZ | 1.0 | 1.0 | 400 | $799 | $2.00 | 20d | 1 | 1.30mi |
Listing history 17 events
-
2026-06-18days on market $59,900 Active 267 DOM
-
2026-06-17days on market $59,900 Active 266 DOM
-
2026-06-16days on market $59,900 Active 265 DOM
-
2026-06-15days on market $59,900 Active 264 DOM
-
2026-06-13days on market $59,900 Active 262 DOM
-
2026-06-10days on market $59,900 Active 259 DOM
-
2026-06-09days on market $59,900 Active 258 DOM
-
2026-06-08days on market $59,900 Active 257 DOM
-
2026-06-07days on market $59,900 Active 256 DOM
-
2026-06-05days on market $59,900 Active 253 DOM
-
2026-06-03days on market $59,900 Active 252 DOM
-
2026-06-02days on market $59,900 Active 251 DOM
-
2026-06-01days on market $59,900 Active 250 DOM
-
2026-05-31days on market $59,900 Active 249 DOM
-
2026-05-18price $59,900 490-char remark
Show marketing remark (490 chars)
**Home is in an age qualified 55+ community. 1 person must be 55 years old and the secondary age is 40+. OWNER WILL FINANCE! This is a BRAND NEW 2 bed/2 bath home with private parking. Home comes equipped with stainless steel appliances, open floorplan, and washer and dryer hook ups. Tons of storage in the kitchen and house with walk in closets in both rooms. This community is centrally located near parks, shopping, Tucson Mall, restaurants, and the freeway. Multiple units available!
-
2026-05-09price $69,900 490-char remark
Show marketing remark (490 chars)
**Home is in an age qualified 55+ community. 1 person must be 55 years old and the secondary age is 40+. OWNER WILL FINANCE! This is a BRAND NEW 2 bed/2 bath home with private parking. Home comes equipped with stainless steel appliances, open floorplan, and washer and dryer hook ups. Tons of storage in the kitchen and house with walk in closets in both rooms. This community is centrally located near parks, shopping, Tucson Mall, restaurants, and the freeway. Multiple units available!
-
2025-09-24$85,000 Active 490-char remark
Show marketing remark (490 chars)
**Home is in an age qualified 55+ community. 1 person must be 55 years old and the secondary age is 40+. OWNER WILL FINANCE! This is a BRAND NEW 2 bed/2 bath home with private parking. Home comes equipped with stainless steel appliances, open floorplan, and washer and dryer hook ups. Tons of storage in the kitchen and house with walk in closets in both rooms. This community is centrally located near parks, shopping, Tucson Mall, restaurants, and the freeway. Multiple units available!
ⓘ Source: listings_history table (triggers on properties + properties_extension) + one-shot
backfill from property_details.listing_events for pre-trigger history.
Climate risk First Street
- Flood 1/10 Low FEMA zone X (unshaded) · 0% chance over 30 yrs
- Wildfire 1/10 Low
- Heat 8/10 Severe 7 d/yr ≥107°F today · 18 d/yr by 30 yrs out
- Wind 1/10 Low
- Air quality 1/10 Low 0 unhealthy d/yr today · 0 by 30 yrs out
Nearby sold comps map
Loading sold comps map…
Walkable amenities ~0.75 mi
Loading nearby amenities…
Taxation est. · year 1
- Rental income
- $12,469
- − Mortgage interest
- −$3,355
- − Property taxes
- −$898
- − Insurance
- −$300
- − Repairs & maintenance
- −$998
- − Management
- −$998
- − Depreciation
- −$1,743
- Taxable income
- $4,178
- Est. tax owed @ 24.0%
- −$1,003
- After-tax cash flow
- $3,880/yr
For passive investors: Depreciation is non-cash, so a rental often shows a tax loss while cash-flowing — sheltering income. Rental losses are passive: they offset passive income freely, and up to $25,000/yr can offset ordinary (W-2) income if you actively participate and your MAGI is under $100k (phasing out to $0 by $150k); unused losses carry forward. On sale, claimed depreciation is recaptured at up to 25%, and gains may owe capital-gains tax (a 1031 exchange can defer both). Figures are a year-1 estimate at your 24.0% rate — not tax advice; consult a CPA.
Condition & rehab AI · 12 photos
This home is in excellent condition with a good condition score of 80. It is move-in ready and has a good resale and rental value. Some minor updates such as painting and flooring upgrades can further increase its value.
Value-add opportunities
- Both Painting the exterior and interior walls — Fresh paint can enhance curb appeal and interior aesthetics.
- Both Adding a small front porch or landscaping — This can improve curb appeal and add value for both resale and rental.
- Both Upgrading the flooring to hardwood or tile — This can increase the home's value and make it more appealing to potential buyers or renters.
- Both Upgrading the kitchen appliances to a more modern model — Modern appliances can make the kitchen more functional and appealing to potential buyers or renters.
- Both Adding a smart home system — This can increase the home's value and make it more appealing to potential buyers or renters who are interested in smart home technology.
Renovation cost estimate screening
Value-add ROI direction
- Both Painting the exterior and interior walls — Fresh paint can enhance curb appeal and interior aesthetics. ↑
- Both Adding a small front porch or landscaping — This can improve curb appeal and add value for both resale and rental. ↑
- Both Upgrading the flooring to hardwood or tile — This can increase the home's value and make it more appealing to potential buyers or renters. ↑
- Both Upgrading the kitchen appliances to a more modern model — Modern appliances can make the kitchen more functional and appealing to potential buyers or renters. ↑
- Both Adding a smart home system — This can increase the home's value and make it more appealing to potential buyers or renters who are interested in smart home technology. ↑
ⓘ Cost ranges are severity-bucket heuristics (US national rule-of-thumb). Get contractor quotes + a written scope before underwriting a rehab budget.
Schools (NCES district)
- District
- Amphitheater Unified District (4406)
- NCES district ID
- 0400680
- Math proficiency
- 32% ▼ -13.00%
- Reading proficiency
- 40% ▼ -8.00%
- Median HH income
- $46,524
- Composite
- 30.82/100
- National rank
- #6135
- State rank
- #85 of 249 in AZ
Livability — Tucson
- Score
- 74/100
- State rank
- #17
- US rank
- #4502
Category grades
Schools grade is shown separately in the Schools card above.
Census & demographics
- Census place
- Tucson, AZ
- County
- Pima County · 1,012,107 people
- Metro
- Tucson, AZ
- Population (ZIP)
- 54,700
- Household income
- $37,194
- Rent vs Own
- Severe rent burden
- 4240.0
Population outlook (Pima County) Hauer SSP2
- Today (2025)
- 1,066,056 people
- By 2030
- 1,086,684 · +1.9%
- By 2040
- 1,117,160 · +4.8%
- By 2050
- 1,149,778 · +7.9%
- By 2075
- 1,271,480 · +19.3%
- By 2100
- 1,321,160 · +23.9%
Race, ethnicity, and origin ACS 2023
- Neighborhood character
- Diverse neighborhood (Simpson 0.63)
- Race & ethnicity
- Hispanic / Latino 45% White 41% Two or more races 18% Asian 4% Black 3% Native American 3%
- Hispanic origin (detail)
- Mexican 41%
- Common ancestry
- Portuguese 2% Romanian 2% Lithuanian 2%
- Foreign-born
- 18% · Canada, China, Vietnam
- Languages at home
- 65% English-only · Spanish 30% Chinese 1% Vietnamese 1%
Political lean MEDSL · Pima
- 2024 margin
- D (+15.2) · D 57.0% · R 41.8% · Other 1.2%
- 2008→2024 swing
- +9.1pp toward D · 2008: 6.1pp · 2024: 15.2pp
- All cycles
- 2024: D+15.2 2020: D+18.7 2016: D+13.5 2012: D+5.8 2008: D+6.1
Not yet ingested
- Civics
- —
Market trends
- HPI YoY
- ▼ -163.31%
- Current HPI
- 283.0647
- Rent YoY
- ▲ 0.30%
- Metro
- Tucson, AZ
- State GDP YoY
- ▲ 4.54%
- F500 in state
- 20
Industry mix (Fortune 500 HQ in AZ)
| Industry | F500 HQs | Revenue |
|---|---|---|
| Technology | 2 | $13B |
|
||
| Mining / Metals | 1 | $23B |
|
||
| Environmental Services | 1 | $16B |
|
||
| Metals / Steel | 1 | $14B |
|
||
| Technology Distribution | 1 | $9B |
|
||
| Homebuilding | 1 | $8B |
|
||
Price history
-29.5% since first listed3 events — show timeline
- 2026-05-18 Price Changed $59,900 ARMLS
- 2026-05-09 Price Changed $69,900 ARMLS
- 2025-09-24 Listed $85,000 ARMLS
Cash-flow waterfall
monthlySold comps — $/sqft
last 12 mo · ≤1 miLoading sold comps…