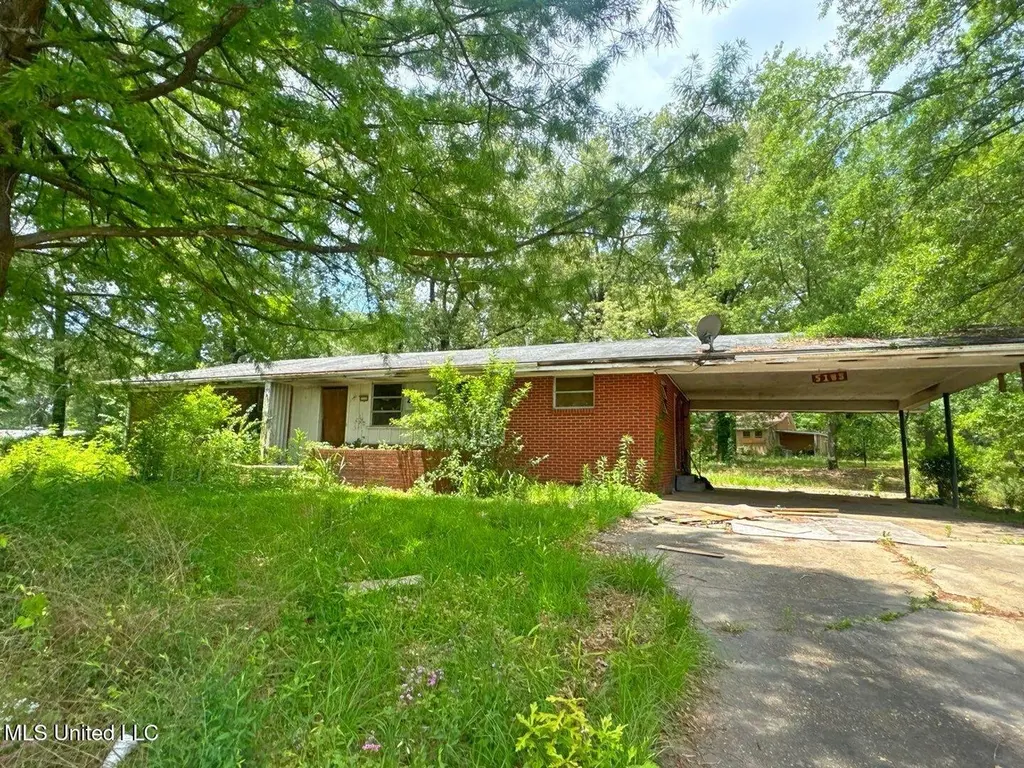
5103 Robinson Rd · Jackson, MS
Flood risk 1/10 · Minimal
- FEMA flood zone
- X (unshaded)
- Chance of flooding over 30 yrs
- 0.0%
- Est. flood insurance / yr
- $507 – $1,088
Fire risk 1/10 · Minimal
- Est. fire insurance / yr
- $1,241 – $2,305
Heat risk 7/10 · Major
- Hot days now (above 108°F)
- 7 days/yr
- Hot days in 30 yrs
- 19 days/yr
Wind risk 8/10 · Major
- Chance of severe wind over 30 yrs
- 80.0%
Air-quality risk 1/10 · Minimal
- Unhealthy air days now
- 0 days/yr
- Unhealthy air days in 30 yrs
- 0 days/yr
Risk factors via First Street. Map © Google.
Why this score? — see what drove the C+ grade
The composite is a weighted blend of 9 inputs, each scored 0–100. Each bar is that input's sub-score; the figure is the points it added to the 100-point composite (weight × sub-score).
- Cash flow +15.0/30.0
- ARV discount +15.0/15.0
- Appreciation +10.0/10.0
- 1% rule +5.0/10.0
- DSCR +5.0/10.0
- Rent growth +5.0/5.0
- Livability +3.4/5.0
- Condition / age +2.5/5.0
- Schools +1.1/10.0
$29,000
🖨 Deal sheet 📄 Offer letter ✓ Due diligence
Listing remarks MLS
Welcome to 5103 Robinson Road - a high-visibility property located in the heart of South Jackson. Situated along a well-traveled corridor, this versatile site offers excellent accessibility and exposure, making it ideal for retail, office, or mixed-use development. Set on a spacious lot, the property boasts convenient access to major thoroughfares and is just minutes from local amenities, schools, and residential neighborhoods. Whether you're looking to expand your business footprint or invest in Jackson's growing commercial landscape, this location offers the flexibility and traffic needed to thrive. Don't miss this opportunity to secure a strategic location with strong growth potential. Perfect for entrepreneurs, small businesses, or investors seeking value in a dynamic market.
Key facts
- Convenient access
- Local amenities
- Strategic location
Tags
Neighborhood map
What this means for you Summary
Snapshot
- This is a 3-bed/2.0-bath single-family listed at $29k.
Deal economics
- At list price, monthly cash flow is $784 ($9k/yr) — positive.
- The deal already cash-flows at list — no discount required.
- Meets the 1% rule at list price ($1k rent vs $29k).
- Recommended offer: $26k (12.0% below list) — sets the bar for market timing.
- Cap rate 38.8% vs local median 9.9% in Jackson — top-decile yield for the area; either an underpriced asset or a hidden risk that comps aren't pricing in. Stress-test before assuming the spread holds.
Location & tenants
- Location reads 68/100 on livability (#66 in MS) — a middle-class / working-renter tenant base. Strengths: commute A+, cost of living A+, housing A+; Watch: schools F, amenities F, employment F.
- Jackson Public School District (urban): math 9% / reading 18% proficiency, ranked #112 of 130 in MS (top 86%) — low school quality limits family demand, transient renter base, plan for 1-2y turnover; 88% free/reduced lunch — lower-income household profile, screen leases tightly.
- Market conditions: Rents rising fast (+13.6%/yr); 121 active listings in the ZIP; 17 comparable units currently listed for rent nearby; rentals at typical pace (median 24d on market — plan ~3-4 weeks tenant-placement turnaround); lower-income renter base — watch delinquency; 167 units permitted in Hinds County in 2024 (0 in 5+ unit buildings).
- At $1,247/mo this rent would consume 49% of the median local household income ($30k/yr) (locally 1099% of renters already pay >50% of income on rent) — very limited rent-growth headroom before tenants either downsize or default.
Forward outlook
- In year one you build about $3k of equity ($200 loan paydown + $3k appreciation (10.0% local appreciation)).
- Hinds County population projected to shrink 6% by 2050 — rents likely to lag national; underwrite the cash flow, not the appreciation.
- At projected returns (10.0% appreciation + 8.0% rent growth), your $8k cash investment doubles in ~1 year — after that, you're playing with house money.
- By year 9, paydown + projected appreciation supports a ~$32k cash-out refi (75% LTV) — recoverable capital for the next deal without selling this one.
Negotiation context
- It's been on market 385 days — a 12% lower offer ($26k) is reasonable based on typical stale-listing flexibility.
- 3 sale attempts since 27y ago; this cycle's ask has dropped $6k (17%) from the opening price — seller is motivated, your offer sets the floor, not the list.
Risks & watch-outs
- Watch-outs: built in 1959 — expect roof / HVAC / electrical / plumbing capex.
- Climate carrying-cost: severe wind risk, 80% chance of damaging wind over 30y; extreme-heat days projected 7→19/yr by 2055 (HVAC capex compounding) — expect insurance premiums to compound above CPI over the hold.
Questions for the listing agent
- It's been on market 385 days. Have you received any prior offers? Is the seller open to a 12% concession, seller financing, or rate buy-down credit?
- Built in 1959 — when were the roof, HVAC, electrical panel, plumbing, and water heater last replaced?
- Why hasn't it sold? Are there any deal-killer items the seller is aware of (foundation, flood, title, zoning, code violations)?
- Is there a deadline driving the sale (1031 exchange, divorce, estate, relocation)? That informs how much negotiation room exists.
- Schools are F-rated, which usually means shorter tenancies and higher turnover. Who's the typical renter profile here, and what's been the actual vacancy rate?
- What's the average days-on-market for RENTAL listings here right now (not sales)? A rising rental-DOM trend means longer vacancies and softer asking-rent achievability than the comps imply.
- What's the recent tenant-quality profile in this submarket — average credit score on applications, eviction rate, late-payment / NSF rate, and stable-employment percentage? A property-management company in the area should have these aggregated.
- How much new for-sale + rental construction is in the pipeline within 1–3 miles? Heavy new supply typically softens prices + rents 12–24 months out; constrained supply supports both.
Investment metrics
- 1% rule
- 4.30% ✓
- Cap rate
- 38.75%
- Cash-on-cash
- 115.93%
- DSCR
- 6.16
- GRM
- 1.9
CMA / ARV
- ARV (median comp)
- $44,217
- List price
- $29,000
- Delta
- -34.41%
- Verdict
- UNDERPRICED
- Comps
- 20 within 1.0 mi
Show comp detail 2 sales within ~0.75 mi
| Address | Dist | Beds/Ba | Sqft | Sold | Price | $/sf | Match |
|---|---|---|---|---|---|---|---|
| 5020 Barrier Pl | 0.36mi | 3/2.0 | 1,688 (-3%) | 12mo | $94,500 | $56 | 68 |
| 5042 Lurline Dr | 0.28mi | 4/2.0 (+1) | 1,796 (+3%) | 16mo | $89,999 | $50 | 63 |
Match score weights: distance 35% · size 25% · config 20% · recency 20%. Top-matched comps best support the ARV.
Projected returns pro-forma
10.0% appreciation · 8.0% rent growth · sell at horizon
- IRR
- —
- Equity multiple
- 9.91×
- Total profit
- $72,364
- Equity at exit
- $26,125
- IRR
- —
- Equity multiple
- 24.42×
- Total profit
- $190,168
- Equity at exit
- $56,341
Cash invested: $8,120 (down + closing). Projections, not guarantees.
Landlord ↔ Tenant lean methodology
- Overall (STATE)
- 90 Strongly Landlord-Friendly
- State Mississippi
- 90 Strongly Landlord-Friendly · R+11
- County
- — inherits STATE
- City
- — inherits STATE
ZIP-level market 39204
- Home prices YoY
- 8.0%
- Rents YoY
- 13.6%
- Active inventory
- 121
- Price-to-rent
- 1.9×
Monthly cashflow live
- Estimated rent
- $1,247 high interval (Pro) →
- Mortgage (P&I)
- −$152
- Tax est. 1.5%
- −$36 /mo · $435/yr
- Insurance
- −$12
- HOA
- −$0
- Vacancy / Maint / Mgmt
- −$262
- Net cashflow
- $784
Break-even live
UW: 25.0% down · 7.5% · 30yr · 1.5% tax · 5.0% vac · 8.0% maint · 8.0% mgmt
Financing live
Cash to close
- Down payment
- $7,250
- Closing costs
- $870
- Reserves months
- —
- Total cash needed
- —
Loan-product check · same deal, 3 products live
Conventional
25% down · 7.5% · 30yr
- Down + closing
- —
- Monthly P&I
- —
- Monthly cashflow
- —
- DSCR
- —
- Eligible?
- —
Personal DTI + credit; lowest rate.
DSCR
20% down · 8.5% · 30yr
- Down + closing
- —
- Monthly P&I
- —
- Monthly cashflow
- —
- DSCR
- —
- Eligible?
- —
No personal income docs; deal must DSCR.
Hard money
10% down · 12.0% · 12mo
- Down + closing
- —
- Monthly P&I
- —
- Monthly cashflow
- —
- DSCR
- —
- Eligible?
- —
Short-term bridge; refi at stabilization.
Rent comps 17 comps
| Address | Beds | Baths | Sqft | Rent | $/sqft | DOM | Units | Dist |
|---|---|---|---|---|---|---|---|---|
| 5136 Lurline Dr Unit Ma Jackson, MS | 3.0 | 1.5 | 1134 | $1,100 | $0.97 | 14d | 1 | 0.32mi |
| 2010 Chadwick Dr Jackson, MS | 3.0 | 2.0 | 1275 | $1,145 | $0.90 | 43d | 1 | 0.39mi |
| 2010 Chadwick Dr Jackson, MS | 2.0 | 2.0 | 1089 | $1,174 | $1.08 | 14d | 1 | 0.39mi |
| 1533 Raymond Rd Jackson, MS | 2.0 | 1.0 | 1135 | $1,010 | $0.89 | 43d | 1 | 0.43mi |
| 1805 Hospital Dr Jackson, MS | 3.0 | 2.0 | 1335 | $1,050 | $0.79 | 14d | 1 | 0.44mi |
| 125 Wingfield Ct Unit NA Jackson, MS | 4.0 | 2.0 | 1797 | $1,650 | $0.92 | 23d | 1 | 0.97mi |
| 427 McDowell Park Cir Jackson, MS | 3.0 | 1.5 | 1308 | $1,200 | $0.92 | 14d | 1 | 1.13mi |
| 1513 Maria Dr Jackson, MS | 3.0 | 2.0 | 1120 | $1,200 | $1.07 | 14d | 1 | 1.17mi |
| 1513 Maria Dr Jackson, MS | 3.0 | 2.0 | 1120 | $1,200 | $1.07 | 23d | 1 | 1.17mi |
| 2694 Woodside Dr Jackson, MS | 3.0 | 1.0 | 1509 | $1,075 | $0.71 | 23d | 1 | 1.26mi |
| 2694 Woodside Dr Jackson, MS | 3.0 | 1.0 | 1509 | $1,075 | $0.71 | 14d | 1 | 1.26mi |
| 2808 Ridgeland Dr Jackson, MS | 3.0 | 2.0 | 1606 | $1,600 | $1.00 | 43d | 1 | 1.26mi |
| 2915 Longwood Dr Jackson, MS | 3.0 | 2.0 | 1800 | $1,400 | $0.78 | 23d | 1 | 1.29mi |
| 2732 Woodside Dr Jackson, MS | 4.0 | 2.0 | 1566 | $1,050 | $0.67 | 23d | 1 | 1.31mi |
| 2904 Marwood Dr Jackson, MS | 3.0 | 2.0 | 1554 | $1,250 | $0.80 | 23d | 1 | 1.39mi |
| 2242 Castle Hill Dr Jackson, MS | 4.0 | 2.0 | 1500 | $1,475 | $0.98 | 14d | 1 | 1.42mi |
| 2242 Castle Hill Dr Jackson, MS | 4.0 | 2.0 | 1500 | $1,475 | $0.98 | 23d | 1 | 1.42mi |
Listing history 26 events
-
2026-06-18days on market $29,000 Active 385 DOM
-
2026-06-17days on market $29,000 Active 384 DOM
-
2026-06-16days on market $29,000 Active 383 DOM
-
2026-06-15days on market $29,000 Active 382 DOM
-
2026-06-14days on market $29,000 Active 380 DOM
-
2026-06-13days on market $29,000 Active 379 DOM
-
2026-06-10days on market $29,000 Active 377 DOM
-
2026-06-09days on market $29,000 Active 376 DOM
-
2026-06-08days on market $29,000 Active 375 DOM
-
2026-06-07days on market $29,000 Active 374 DOM
-
2026-06-05days on market $29,000 Active 371 DOM
-
2026-06-03pricedays on market $29,000 Active 370 DOM
-
2026-06-02days on market $35,000 Active 369 DOM
-
2026-06-01days on market $35,000 Active 368 DOM
-
2026-05-31days on market $35,000 Active 367 DOM
-
2026-05-30days on market $35,000 Active 366 DOM
-
2025-05-28$35,000 Active 796-char remark
Show marketing remark (796 chars)
Welcome to 5103 Robinson Road - a high-visibility property located in the heart of South Jackson. Situated along a well-traveled corridor, this versatile site offers excellent accessibility and exposure, making it ideal for retail, office, or mixed-use development. Set on a spacious lot, the property boasts convenient access to major thoroughfares and is just minutes from local amenities, schools, and residential neighborhoods. Whether you're looking to expand your business footprint or invest in Jackson's growing commercial landscape, this location offers the flexibility and traffic needed to thrive. Don't miss this opportunity to secure a strategic location with strong growth potential. Perfect for entrepreneurs, small businesses, or investors seeking value in a dynamic market.
-
2024-09-02historical
-
2024-03-12price $49,000
-
2023-09-01$59,000 Active
-
2021-10-08historical
-
2018-02-14soldstatus
-
2017-08-14soldstatus
-
2006-08-11soldstatus
-
2000-02-24soldstatus
-
1999-07-20$75,000
ⓘ Source: listings_history table (triggers on properties + properties_extension) + one-shot
backfill from property_details.listing_events for pre-trigger history.
Climate risk First Street
- Flood 1/10 Low FEMA zone X (unshaded) · 0% chance over 30 yrs
- Wildfire 1/10 Low
- Heat 7/10 Severe 7 d/yr ≥108°F today · 19 d/yr by 30 yrs out
- Wind 8/10 Severe 80% chance of damaging wind over 30 yrs
- Air quality 1/10 Low 0 unhealthy d/yr today · 0 by 30 yrs out
Nearby sold comps map
Loading sold comps map…
Walkable amenities ~0.75 mi
Loading nearby amenities…
Taxation est. · year 1
- Rental income
- $14,960
- − Mortgage interest
- −$1,624
- − Property taxes
- −$435
- − Insurance
- −$145
- − Repairs & maintenance
- −$1,197
- − Management
- −$1,197
- − Depreciation
- −$844
- Taxable income
- $9,518
- Est. tax owed @ 24.0%
- −$2,284
- After-tax cash flow
- $7,129/yr
For passive investors: Depreciation is non-cash, so a rental often shows a tax loss while cash-flowing — sheltering income. Rental losses are passive: they offset passive income freely, and up to $25,000/yr can offset ordinary (W-2) income if you actively participate and your MAGI is under $100k (phasing out to $0 by $150k); unused losses carry forward. On sale, claimed depreciation is recaptured at up to 25%, and gains may owe capital-gains tax (a 1031 exchange can defer both). Figures are a year-1 estimate at your 24.0% rate — not tax advice; consult a CPA.
Schools (NCES district)
- District
- Jackson Public School District
- NCES district ID
- 2802190
- Math proficiency
- 9% ▼ -14.00%
- Reading proficiency
- 18% ▼ -7.00%
- Median HH income
- $33,234
- Composite
- 10.89/100
- National rank
- #9755
- State rank
- #112 of 130 in MS
Livability — Jackson
- Score
- 68/100
- State rank
- #66
- US rank
- #9695
Category grades
Schools grade is shown separately in the Schools card above.
Census & demographics
- Census place
- Jackson, MS
- County
- Hinds County · 167,040 people
- City population
- 140,204
- Metro
- Jackson, MS
- Population (ZIP)
- 13,249
- Household income
- $30,237
- Rent vs Own
- Severe rent burden
- 1099.0
Population outlook (Hinds County) Hauer SSP2
- Today (2025)
- 242,528 people
- By 2030
- 241,113 · -0.6%
- By 2040
- 235,557 · -2.9%
- By 2050
- 226,946 · -6.4%
- By 2075
- 199,995 · -17.5%
- By 2100
- 164,165 · -32.3%
Race, ethnicity, and origin ACS 2023
- Neighborhood character
- Predominantly Black (90%)
- Race & ethnicity
- Black 90% White 5% Two or more races 4% Hispanic / Latino 3%
- Foreign-born
- 2% · Canada
- Languages at home
- 97% English-only · Spanish 2%
Political lean MEDSL · Hinds
- 2024 margin
- Solid D (+46.1) · D 72.4% · R 26.3% · Other 1.4%
- 2008→2024 swing
- +7.1pp toward D · 2008: 39.0pp · 2024: 46.1pp
- All cycles
- 2024: D+46.1 2020: D+48.3 2016: D+43.7 2012: D+45.1 2008: D+39.0
Not yet ingested
- Civics
- —
Market trends
- HPI YoY
- ▲ 17.25%
- Current HPI
- 233.9061
- Rent YoY
- ▲ 13.56%
- Metro
- Jackson, MS
- State GDP YoY
- —
- F500 in state
- 0
Price history
-53.3% since first listed10 events — show timeline
- 2025-05-28 Listed $35,000 MLSU
- 2024-09-02 Listing Removed — MLSU
- 2024-03-12 Price Changed $49,000 MLSU
- 2023-09-01 Listed $59,000 MLSU
- 2021-10-08 Listing Removed — MLSU
- 2018-02-14 Sold (Public Records) — Public Records
- 2017-08-14 Sold (Public Records) — Public Records
- 2006-08-11 Sold (Public Records) — Public Records
- 2000-02-24 Sold (Public Records) — Public Records
- 1999-07-20 Listed $75,000 MLSU
Property tax history
+7.4%/yrLatest (2025): $1,738 · +2.1% YoY. Source: county tax records.
Cash-flow waterfall
monthlySold comps — $/sqft
last 12 mo · ≤1 miLoading sold comps…