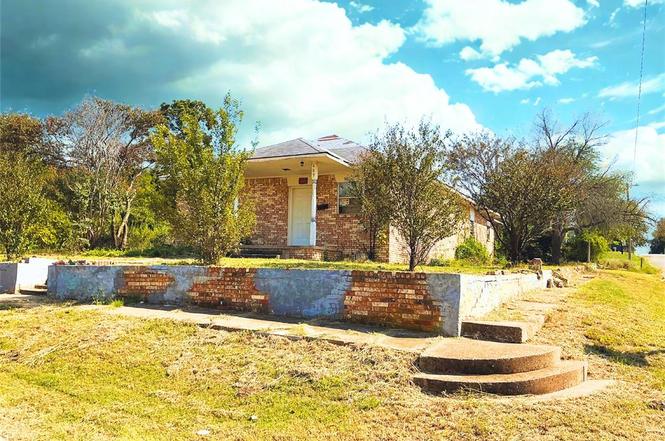
489 N Carter St · Healdton, OK
Flood risk 1/10 · Minimal
- FEMA flood zone
- X (unshaded)
- Chance of flooding over 30 yrs
- 0.0%
- Est. flood insurance / yr
- $507 – $1,088
Fire risk 7/10 · Major
- Est. fire insurance / yr
- $2,463 – $4,575
Heat risk 6/10 · Moderate
- Hot days now (above 109°F)
- 7 days/yr
- Hot days in 30 yrs
- 19 days/yr
Wind risk 3/10 · Minor
- Chance of severe wind over 30 yrs
- 7.0%
Air-quality risk 4/10 · Minor
- Unhealthy air days now
- 3 days/yr
- Unhealthy air days in 30 yrs
- 4 days/yr
Risk factors via First Street. Map © Google.
Why this score? — see what drove the B- grade
The composite is a weighted blend of 9 inputs, each scored 0–100. Each bar is that input's sub-score; the figure is the points it added to the 100-point composite (weight × sub-score).
- Cash flow +30.0/30.0
- 1% rule +10.0/10.0
- DSCR +10.0/10.0
- ARV discount +7.5/15.0
- Livability +3.0/5.0
- Rent growth +2.5/5.0
- Condition / age +2.5/5.0
- Schools +1.0/10.0
- Appreciation +0.1/10.0
$32,500
🖨 Deal sheet 📄 Offer letter ✓ Due diligence
Listing remarks
Investor Opportunity – 3BR/2BA Fixer-Upper on Expansive Healdton Lot Rustic Layout with Vintage Brick: Classic red-and-white brick colonial like entry with three bedrooms, two baths, and two living areas on a large, tree-lined lot . Looks to be original hardwood floors with some plywood repaired spots adds to the original charm. Original wood cabinets and trim around the ceiling adds a character feature and gives this home a unique look. This Red and white brick exterior and mature shade trees set the scene for a peaceful, country-flavored remodel – perfect for an investor looking to preserve history while adding modern flair. Full Renovation Needed – Sold AS-IS: This p
Key facts
- Expansive lot
- Large lot
- Vintage brick
Tags
Neighborhood map
What this means for you Summary
Snapshot
- This is a 3-bed/2.0-bath single-family listed at $32k.
Deal economics
- At list price, monthly cash flow is $666 ($8k/yr) — positive.
- The deal already cash-flows at list — no discount required.
- Meets the 1% rule at list price ($1k rent vs $32k).
- Recommended offer: $32k (3.0% below list) — sets the bar for market timing.
Location & tenants
- Location reads 59/100 on livability (#390 in OK) — a working-class tenant base; expect higher turnover. Strengths: cost of living A+, crime A-; Watch: amenities F, commute F, employment F.
- Healdton (rural): math 10% / reading 13% proficiency, ranked #246 of 270 in OK (top 91%) — low school quality limits family demand, transient renter base, plan for 1-2y turnover; 64% free/reduced lunch — lower-income household profile, screen leases tightly.
- Zoned schools: Healdton Es (math 17% / reading 12%, grade F, #604 of 845 statewide, top 76%, 209 students, 0% FRL); Healdton Hs (math 5% / reading 15%, grade F, #361 of 447 statewide, top 94%, 167 students, 0% FRL) — zoned schools average 0% FRL vs 64% district-wide (64 pts lower); this property's tenant base skews higher-income than the district average.
- Market conditions: 28 active listings in the ZIP; 73 units permitted in Carter County in 2024 (0 in 5+ unit buildings).
Forward outlook
- Local home prices are declining (-3.0%/yr); year-one equity from $225 of loan paydown is wiped out by about $975 of value loss. Plan a longer hold.
- Carter County population projected at +9% by 2050 — modest demand growth; plan on rents tracking national, not racing it.
- At projected returns (-3.0% appreciation + 3.0% rent growth), your $9k cash investment doubles in ~2 years — after that, you're playing with house money.
Negotiation context
- It's been on market 34 days — a 3% lower offer ($32k) is reasonable based on typical stale-listing flexibility.
- 2 sale attempts with the ask held roughly flat each time — persistent listings suggest the price (not the market) is what's stuck; bring a comps-based counter.
Risks & watch-outs
- Watch-outs: built in 1950 — expect roof / HVAC / electrical / plumbing capex.
- Climate carrying-cost: major wildfire risk; extreme-heat days projected 7→19/yr by 2055 (HVAC capex compounding) — expect insurance premiums to compound above CPI over the hold.
Questions for the listing agent
- It's been on market 34 days. Have you received any prior offers? Is the seller open to a 3% concession, seller financing, or rate buy-down credit?
- Built in 1950 — when were the roof, HVAC, electrical panel, plumbing, and water heater last replaced?
- Is there a deadline driving the sale (1031 exchange, divorce, estate, relocation)? That informs how much negotiation room exists.
- Schools are F-rated, which usually means shorter tenancies and higher turnover. Who's the typical renter profile here, and what's been the actual vacancy rate?
- What's the average days-on-market for RENTAL listings here right now (not sales)? A rising rental-DOM trend means longer vacancies and softer asking-rent achievability than the comps imply.
- What's the recent tenant-quality profile in this submarket — average credit score on applications, eviction rate, late-payment / NSF rate, and stable-employment percentage? A property-management company in the area should have these aggregated.
- How much new for-sale + rental construction is in the pipeline within 1–3 miles? Heavy new supply typically softens prices + rents 12–24 months out; constrained supply supports both.
Investment metrics
- 1% rule
- 3.48% ✓
- Cap rate
- 30.89%
- Cash-on-cash
- 87.86%
- DSCR
- 4.91
- GRM
- 2.4
CMA / ARV
- ARV (on-the-fly)
- $172,032
- Comps found
- 7
Show comp detail 7 sales within ~0.75 mi
| Address | Dist | Beds/Ba | Sqft | Sold | Price | $/sf | Match |
|---|---|---|---|---|---|---|---|
| 664 Shell St | 0.17mi | 3/2.0 | 1,878 (+5%) | 4mo | $171,000 | $91 | 80 |
| 196 Frances St | 0.45mi | 3/2.0 | 1,766 (-2%) | 2mo | $169,900 | $96 | 74 |
| 53 Francis St | 0.45mi | 3/2.0 | 1,848 (+3%) | 8mo | $70,000 | $38 | 67 |
| 260 Stanolind | 0.20mi | 4/2.0 (+1) | 1,606 (-10%) | 3mo | $176,300 | $110 | 66 |
| 231 Magnolia | 0.08mi | 3/3.0 | 1,994 (+11%) | 11mo | $149,900 | $75 | 65 |
| 51 Quail Dr | 0.52mi | 3/2.0 | 1,613 (-10%) | 6mo | $184,000 | $114 | 54 |
| 30 Peach St | 0.74mi | 3/2.0 | 1,920 (+7%) | 1mo | $395,000 | $206 | 53 |
Match score weights: distance 35% · size 25% · config 20% · recency 20%. Top-matched comps best support the ARV.
Projected returns pro-forma
-3.0% appreciation · 3.0% rent growth · sell at horizon
- IRR
- 88.4%
- Equity multiple
- 5.09×
- Total profit
- $37,189
- Equity at exit
- $4,846
- IRR
- 91.5%
- Equity multiple
- 10.57×
- Total profit
- $87,101
- Equity at exit
- $2,810
Cash invested: $9,100 (down + closing). Projections, not guarantees.
Landlord ↔ Tenant lean methodology
- Overall (STATE)
- 83 Strongly Landlord-Friendly
- State Oklahoma
- 83 Strongly Landlord-Friendly · R+20
- County
- — inherits STATE
- City
- — inherits STATE
ZIP-level market 73438
- Home prices YoY
- -4.0%
- Active inventory
- 28
- Price-to-rent
- 2.4×
Monthly cashflow live
- Estimated rent
- $1,130 medium interval (Pro) →
- Mortgage (P&I)
- −$170
- Tax from tax record
- −$42 /mo · $510/yr
- Insurance
- −$14
- HOA
- −$0
- Vacancy / Maint / Mgmt
- −$237
- Net cashflow
- $666
Break-even live
UW: 25.0% down · 7.5% · 30yr · 1.5% tax · 5.0% vac · 8.0% maint · 8.0% mgmt
Financing live
Cash to close
- Down payment
- $8,125
- Closing costs
- $975
- Reserves months
- —
- Total cash needed
- —
Loan-product check · same deal, 3 products live
Conventional
25% down · 7.5% · 30yr
- Down + closing
- —
- Monthly P&I
- —
- Monthly cashflow
- —
- DSCR
- —
- Eligible?
- —
Personal DTI + credit; lowest rate.
DSCR
20% down · 8.5% · 30yr
- Down + closing
- —
- Monthly P&I
- —
- Monthly cashflow
- —
- DSCR
- —
- Eligible?
- —
No personal income docs; deal must DSCR.
Hard money
10% down · 12.0% · 12mo
- Down + closing
- —
- Monthly P&I
- —
- Monthly cashflow
- —
- DSCR
- —
- Eligible?
- —
Short-term bridge; refi at stabilization.
Listing history 4 events
-
2025-10-25status Pending
-
2025-10-22status Active
-
2025-10-19status Pending
-
2025-09-16$32,500 Active
ⓘ Source: listings_history table (triggers on properties + properties_extension) + one-shot
backfill from property_details.listing_events for pre-trigger history.
Tax reassessment forecast OK · Resets to sale price
- Current annual tax
- $510 · $42/mo
- Projected year-2 tax
- $510 · $42/mo
- Expected delta
- $0/yr ($0/mo · 0.0%)
ⓘ Screening estimate from a state-policy table — verify with the county assessor before closing.
Climate risk First Street
- Flood 1/10 Low FEMA zone X (unshaded) · 0% chance over 30 yrs
- Wildfire 7/10 Severe
- Heat 6/10 Major 7 d/yr ≥109°F today · 19 d/yr by 30 yrs out
- Wind 3/10 Moderate 7% chance of damaging wind over 30 yrs
- Air quality 4/10 Moderate 3 unhealthy d/yr today · 4 by 30 yrs out
Nearby sold comps map
Loading sold comps map…
Walkable amenities ~0.75 mi
Loading nearby amenities…
Taxation est. · year 1
- Rental income
- $13,561
- − Mortgage interest
- −$1,821
- − Property taxes
- −$510
- − Insurance
- −$162
- − Repairs & maintenance
- −$1,085
- − Management
- −$1,085
- − Depreciation
- −$945
- Taxable income
- $7,953
- Est. tax owed @ 24.0%
- −$1,909
- After-tax cash flow
- $6,087/yr
For passive investors: Depreciation is non-cash, so a rental often shows a tax loss while cash-flowing — sheltering income. Rental losses are passive: they offset passive income freely, and up to $25,000/yr can offset ordinary (W-2) income if you actively participate and your MAGI is under $100k (phasing out to $0 by $150k); unused losses carry forward. On sale, claimed depreciation is recaptured at up to 25%, and gains may owe capital-gains tax (a 1031 exchange can defer both). Figures are a year-1 estimate at your 24.0% rate — not tax advice; consult a CPA.
Schools (NCES district)
- District
- Healdton
- NCES district ID
- 4014130
- Math proficiency
- 10% ▼ -13.00%
- Reading proficiency
- 13% ▼ -11.00%
- Median HH income
- $35,740
- Composite
- 9.5/100
- National rank
- #9849
- State rank
- #246 of 270 in OK
Livability — Healdton
- Score
- 59/100
- State rank
- #390
- US rank
- #20116
Category grades
Schools grade is shown separately in the Schools card above.
Census & demographics
- Census place
- Healdton, OK
- Population (ZIP)
- 3,055
Population outlook (Carter County) Hauer SSP2
- Today (2025)
- 50,892 people
- By 2030
- 51,913 · +2.0%
- By 2040
- 53,857 · +5.8%
- By 2050
- 55,604 · +9.3%
- By 2075
- 60,670 · +19.2%
- By 2100
- 62,366 · +22.5%
Race, ethnicity, and origin ACS 2023
- Neighborhood character
- Predominantly White (77%)
- Race & ethnicity
- White 77% Two or more races 14% Hispanic / Latino 7% Native American 4% Black 1%
- Hispanic origin (detail)
- Mexican 5%
- Common ancestry
- Iranian 2% Lithuanian 1% Slovak 1%
- Foreign-born
- 1% · Canada
- Languages at home
- 94% English-only · Spanish 5%
Political lean MEDSL · Carter
- 2024 margin
- Solid R (+54.7) · D 21.9% · R 76.7% · Other 1.4%
- 2008→2024 swing
- -14.2pp toward R · 2008: -40.5pp · 2024: -54.7pp
- All cycles
- 2024: R+54.7 2020: R+52.5 2016: R+52.6 2012: R+42.7 2008: R+40.5
Not yet ingested
- Civics
- —
Market trends
- HPI YoY
- ▼ -9.75%
- Current HPI
- 231.5295
- Rent YoY
- —
- Metro
- —
- State GDP YoY
- ▲ 1.55%
- F500 in state
- 6
Industry mix (Fortune 500 HQ in OK)
| Industry | F500 HQs | Revenue |
|---|---|---|
| Energy | 3 | $48B |
|
||
Price history
4 events — show timeline
- 2025-10-25 Pending — MLSOK
- 2025-10-22 Relisted — MLSOK
- 2025-10-19 Pending — MLSOK
- 2025-09-16 Listed $32,500 MLSOK
Property tax history
+4.2%/yrLatest (2025): $510 · +1.6% YoY. Source: county tax records.
Cash-flow waterfall
monthlySold comps — $/sqft
last 12 mo · ≤1 miLoading sold comps…