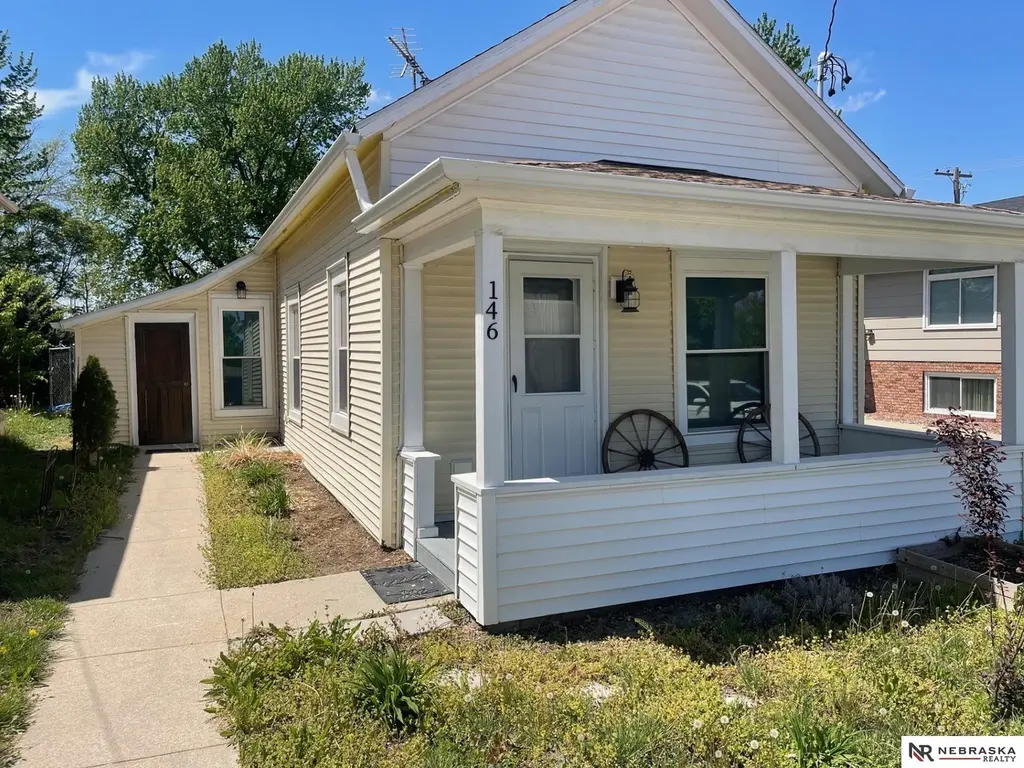
146 N 8th St · Geneva, NE
Flood risk 1/10 · Minimal
- FEMA flood zone
- X (unshaded)
- Chance of flooding over 30 yrs
- 0.0%
- Est. flood insurance / yr
- $507 – $1,088
Fire risk 4/10 · Minor
- Est. fire insurance / yr
- $1,161 – $2,155
Heat risk 3/10 · Minor
- Hot days now (above 103°F)
- 7 days/yr
- Hot days in 30 yrs
- 15 days/yr
Wind risk 2/10 · Minimal
- Chance of severe wind over 30 yrs
- —
Air-quality risk 2/10 · Minimal
- Unhealthy air days now
- 1 days/yr
- Unhealthy air days in 30 yrs
- 1 days/yr
Risk factors via First Street. Map © Google.
Why this score? — see what drove the C- grade
The composite is a weighted blend of 9 inputs, each scored 0–100. Each bar is that input's sub-score; the figure is the points it added to the 100-point composite (weight × sub-score).
- Cash flow +25.2/30.0
- DSCR +8.3/10.0
- 1% rule +5.8/10.0
- Schools +4.7/10.0
- Livability +4.0/5.0
- Rent growth +2.5/5.0
- Condition / age +2.5/5.0
- ARV discount +0.0/15.0
- Appreciation +0.0/10.0
$99,995
🖨 Deal sheet 📄 Offer letter ✓ Due diligence
Listing remarks
Small town living at it's best with this 1 Bed 1 bath home with tons of updates including windows some flooring, kitchen, Bathroom with a walk in closet. A good sized living and dining room with a gas Fireplace. Basement has been updated with thrasher system and sump pump, Newer storage shed and ally access make this one to see.
Key facts
- 6,098 sq ft lot
- Built 1915
- Listed 43 days
Property features AI
Exterior
- Parking: No garage
- Utilities: Public water; Public sewer; Electricity available; Natural gas available; Phone available
- Home design: Single-family residence (residential); Not new / not a model; One-story (living area 704 sq ft)
- Construction: Vinyl siding; Composition roof; Block foundation; Built in 1915
- Exterior features: Front porch; Lot about 0.14 acres (approx. 26 x 148); Lot up to 1/4 acre
Interior
- Kitchen: Refrigerator; Microwave
- Bedrooms: Main-floor primary bedroom (approximately 11 x 10, 110 sq ft)
- Bathrooms: One bathroom on the main level (includes a three-quarter bathroom)
- Heating & cooling: Natural gas forced-air heating; Central air conditioning
- Interior features: Gas-log fireplace with gas log lighter; Basement present (250 finished area)
Neighborhood map
What this means for you Summary
Snapshot
- This is a 1-bed/1.0-bath single-family listed at $100k.
Deal economics
- At list price, monthly cash flow is $225 ($3k/yr) — positive.
- The deal already cash-flows at list — no discount required.
- Meets the 1% rule at list price ($1k rent vs $100k).
- Recommended offer: $97k (3.0% below list) — sets the bar for market timing.
Location & tenants
- Location reads 80/100 on livability (#28 in NE, #1,739 nationally) — a professional / high-income tenant draw. Strengths: crime A+, employment A+, cost of living A+; Watch: amenities F, commute F.
- Fillmore Central Public Schools (rural): math 56% / reading 54% proficiency, ranked #41 of 111 in NE (top 37%) — acceptable for families but not a draw, mixed tenant base, ~2y average lease.
- Market conditions: 22 active listings in the ZIP; 10 units permitted in Fillmore County in 2024 (0 in 5+ unit buildings).
Forward outlook
- Local home prices are declining (-3.0%/yr); year-one equity from $691 of loan paydown is wiped out by about $3k of value loss. Plan a longer hold.
- Fillmore County population projected to shrink 6% by 2050 — rents likely to lag national; underwrite the cash flow, not the appreciation.
Negotiation context
- It's been on market 43 days — a 3% lower offer ($97k) is reasonable based on typical stale-listing flexibility.
- Current owner paid $25k; list at $100k implies a 300% gain — meaningful room to come down on a strong offer.
Risks & watch-outs
- Watch-outs: built in 1915 — expect roof / HVAC / electrical / plumbing capex.
Questions for the listing agent
- It's been on market 43 days. Have you received any prior offers? Is the seller open to a 3% concession, seller financing, or rate buy-down credit?
- Built in 1915 — when were the roof, HVAC, electrical panel, plumbing, and water heater last replaced?
- Is there a deadline driving the sale (1031 exchange, divorce, estate, relocation)? That informs how much negotiation room exists.
- Schools are B-rated — typically a magnet for longer-tenancy family renters. What's the average tenant stay here, and is there a school-zone premium baked into asking?
- What's the average days-on-market for RENTAL listings here right now (not sales)? A rising rental-DOM trend means longer vacancies and softer asking-rent achievability than the comps imply.
- What's the recent tenant-quality profile in this submarket — average credit score on applications, eviction rate, late-payment / NSF rate, and stable-employment percentage? A property-management company in the area should have these aggregated.
- How much new for-sale + rental construction is in the pipeline within 1–3 miles? Heavy new supply typically softens prices + rents 12–24 months out; constrained supply supports both.
Investment metrics
- 1% rule
- 1.08% ✓
- Cap rate
- 9.00%
- Cash-on-cash
- 9.66%
- DSCR
- 1.43
- GRM
- 7.7
CMA / ARV
- ARV (median comp)
- $83,223
- List price
- $99,995
- Delta
- 20.15%
- Verdict
- OVERPRICED
- Comps
- 7 within 1.0 mi
Show comp detail 3 sales within ~0.75 mi
| Address | Dist | Beds/Ba | Sqft | Sold | Price | $/sf | Match |
|---|---|---|---|---|---|---|---|
| 1228 E St | 0.49mi | 2/1.0 (+1) | 702 (-0%) | 4mo | $125,000 | $178 | 68 |
| 1121 F St | 0.37mi | 2/1.0 (+1) | 784 (+11%) | 3mo | $145,000 | $185 | 56 |
| 315 N 12 St | 0.42mi | 2/2.0 (+1) | 738 (+5%) | 19mo | $55,800 | $76 | 47 |
Match score weights: distance 35% · size 25% · config 20% · recency 20%. Top-matched comps best support the ARV.
Projected returns pro-forma
-3.0% appreciation · 3.0% rent growth · sell at horizon
- IRR
- -1.8%
- Equity multiple
- 0.93×
- Total profit
- $-1,878
- Equity at exit
- $14,910
- IRR
- 7.9%
- Equity multiple
- 1.60×
- Total profit
- $16,747
- Equity at exit
- $8,646
Cash invested: $27,999 (down + closing). Projections, not guarantees.
Landlord ↔ Tenant lean methodology
- Overall (STATE)
- 83 Strongly Landlord-Friendly
- State Nebraska
- 83 Strongly Landlord-Friendly · R+13
- County
- — inherits STATE
- City
- — inherits STATE
ZIP-level market 68361
- Home prices YoY
- -14.9%
- Active inventory
- 22
- Price-to-rent
- 7.7×
Monthly cashflow live
- Estimated rent
- $1,079 medium interval (Pro) →
- Mortgage (P&I)
- −$524
- Tax from tax record
- −$61 /mo · $733/yr
- Insurance
- −$42
- HOA
- −$0
- Vacancy / Maint / Mgmt
- −$227
- Net cashflow
- $225
Break-even live
UW: 25.0% down · 7.5% · 30yr · 1.5% tax · 5.0% vac · 8.0% maint · 8.0% mgmt
Financing live
Cash to close
- Down payment
- $24,999
- Closing costs
- $3,000
- Reserves months
- —
- Total cash needed
- —
Loan-product check · same deal, 3 products live
Conventional
25% down · 7.5% · 30yr
- Down + closing
- —
- Monthly P&I
- —
- Monthly cashflow
- —
- DSCR
- —
- Eligible?
- —
Personal DTI + credit; lowest rate.
DSCR
20% down · 8.5% · 30yr
- Down + closing
- —
- Monthly P&I
- —
- Monthly cashflow
- —
- DSCR
- —
- Eligible?
- —
No personal income docs; deal must DSCR.
Hard money
10% down · 12.0% · 12mo
- Down + closing
- —
- Monthly P&I
- —
- Monthly cashflow
- —
- DSCR
- —
- Eligible?
- —
Short-term bridge; refi at stabilization.
Listing history 19 events
-
2026-06-18days on market $99,995 Active 43 DOM
-
2026-06-17days on market $99,995 Active 42 DOM
-
2026-06-16days on market $99,995 Active 41 DOM
-
2026-06-15days on market $99,995 Active 40 DOM
-
2026-06-13days on market $99,995 Active 38 DOM
-
2026-06-12days on market $99,995 Active 37 DOM
-
2026-06-09days on market $99,995 Active 34 DOM
-
2026-06-08days on market $99,995 Active 33 DOM
-
2026-06-07days on market $99,995 Active 32 DOM
-
2026-06-05days on market $99,995 Active 30 DOM
-
2026-06-04days on market $99,995 Active 28 DOM
-
2026-06-02days on market $99,995 Active 27 DOM
-
2026-06-01days on market $99,995 Active 26 DOM
-
2026-05-31days on market $99,995 Active 25 DOM
-
2026-05-06$110,000 New 331-char remark
-
2023-04-11soldstatus $25,000
-
2018-05-31soldstatus $1,100,000
-
2012-10-31soldstatus $5,000
-
2007-04-23soldstatus $152,500
ⓘ Source: listings_history table (triggers on properties + properties_extension) + one-shot
backfill from property_details.listing_events for pre-trigger history.
Tax reassessment forecast NE · Resets to sale price
- Current annual tax
- $733 · $61/mo
- Projected year-2 tax
- $1,730 · $144/mo
- Expected delta
- +$997/yr (+$83/mo · 135.9%)
ⓘ Screening estimate from a state-policy table — verify with the county assessor before closing.
Climate risk First Street
- Flood 1/10 Low FEMA zone X (unshaded) · 0% chance over 30 yrs
- Wildfire 4/10 Moderate
- Heat 3/10 Moderate 7 d/yr ≥103°F today · 15 d/yr by 30 yrs out
- Wind 2/10 Low
- Air quality 2/10 Low 1 unhealthy d/yr today · 1 by 30 yrs out
Nearby sold comps map
Loading sold comps map…
Walkable amenities ~0.75 mi
Loading nearby amenities…
Taxation est. · year 1
- Rental income
- $12,948
- − Mortgage interest
- −$5,601
- − Property taxes
- −$733
- − Insurance
- −$500
- − Repairs & maintenance
- −$1,036
- − Management
- −$1,036
- − Depreciation
- −$2,909
- Taxable income
- $1,133
- Est. tax owed @ 24.0%
- −$272
- After-tax cash flow
- $2,431/yr
For passive investors: Depreciation is non-cash, so a rental often shows a tax loss while cash-flowing — sheltering income. Rental losses are passive: they offset passive income freely, and up to $25,000/yr can offset ordinary (W-2) income if you actively participate and your MAGI is under $100k (phasing out to $0 by $150k); unused losses carry forward. On sale, claimed depreciation is recaptured at up to 25%, and gains may owe capital-gains tax (a 1031 exchange can defer both). Figures are a year-1 estimate at your 24.0% rate — not tax advice; consult a CPA.
Schools (NCES district)
- District
- Fillmore Central Public Schools
- NCES district ID
- 3100118
- Math proficiency
- 56% ▼ -4.00%
- Reading proficiency
- 54% ▼ -3.00%
- Median HH income
- $47,623
- Composite
- 46.72/100
- National rank
- #2396
- State rank
- #41 of 111 in NE
Livability — Geneva
- Score
- 80/100
- State rank
- #28
- US rank
- #1739
Category grades
Schools grade is shown separately in the Schools card above.
Census & demographics
- Census place
- Geneva, NE
- Population (ZIP)
- 2,448
Population outlook (Fillmore County) Hauer SSP2
- Today (2025)
- 5,729 people
- By 2030
- 5,696 · -0.6%
- By 2040
- 5,561 · -2.9%
- By 2050
- 5,412 · -5.5%
- By 2075
- 5,437 · -5.1%
- By 2100
- 5,373 · -6.2%
Race, ethnicity, and origin ACS 2023
- Neighborhood character
- Predominantly White (90%)
- Race & ethnicity
- White 90% Two or more races 6% Hispanic / Latino 6%
- Hispanic origin (detail)
- Mexican 5%
- Common ancestry
- Lithuanian 3% Italian 2% Iranian 1%
- Foreign-born
- 1% · Canada, South Korea
- Languages at home
- 98% English-only · Spanish 2%
Political lean MEDSL · Fillmore
- 2024 margin
- Solid R (+54.9) · D 22.0% · R 76.8% · Other 1.2%
- 2008→2024 swing
- -22.6pp toward R · 2008: -32.3pp · 2024: -54.9pp
- All cycles
- 2024: R+54.9 2020: R+52.9 2016: R+51.8 2012: R+41.8 2008: R+32.3
Not yet ingested
- Civics
- —
Market trends
- HPI YoY
- ▼ -34.31%
- Current HPI
- 195.965
- Rent YoY
- —
- Metro
- —
- State GDP YoY
- ▲ 0.68%
- F500 in state
- 2
Industry mix (Fortune 500 HQ in NE)
| Industry | F500 HQs | Revenue |
|---|---|---|
| Conglomerate | 1 | $371B |
|
||
Price history
-34.4% since first listed6 events — show timeline
- 2026-05-28 Price Changed $99,995 GPRMLS
- 2026-05-06 Listed $110,000 GPRMLS
- 2023-04-11 Sold (Public Records) $25,000 Public Records
- 2018-05-31 Sold (Public Records) $1,100,000 Public Records
- 2012-10-31 Sold (Public Records) $5,000 Public Records
- 2007-04-23 Sold (Public Records) $152,500 Public Records
Property tax history
+18.1%/yrLatest (2025): $733 · +25.8% YoY. Source: county tax records.
Cash-flow waterfall
monthlySold comps — $/sqft
last 12 mo · ≤1 miLoading sold comps…