132 W Berry St · Greencastle, IN
Flood risk 1/10 · Minimal
- FEMA flood zone
- X (unshaded)
- Chance of flooding over 30 yrs
- 0.0%
- Est. flood insurance / yr
- $473 – $860
Fire risk 1/10 · Minimal
- Est. fire insurance / yr
- $717 – $1,331
Heat risk 3/10 · Minor
- Hot days now (above 103°F)
- 7 days/yr
- Hot days in 30 yrs
- 18 days/yr
Wind risk 2/10 · Minimal
- Chance of severe wind over 30 yrs
- 1.0%
Air-quality risk 2/10 · Minimal
- Unhealthy air days now
- 1 days/yr
- Unhealthy air days in 30 yrs
- 2 days/yr
Risk factors via First Street. Map © Google.
Why this score? — see what drove the C+ grade
The composite is a weighted blend of 9 inputs, each scored 0–100. Each bar is that input's sub-score; the figure is the points it added to the 100-point composite (weight × sub-score).
- Cash flow +23.1/30.0
- ARV discount +13.3/15.0
- DSCR +7.4/10.0
- 1% rule +5.5/10.0
- Livability +3.7/5.0
- Schools +3.4/10.0
- Rent growth +2.5/5.0
- Condition / age +2.5/5.0
- Appreciation +0.0/10.0
$139,900
🖨 Deal sheet 📄 Offer letter ✓ Due diligence
Listing remarks
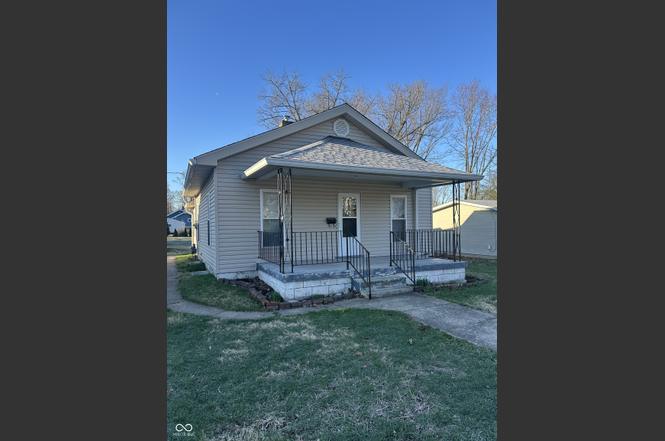
The single family residence located at 132 W Berry ST in GREENCASTLE, IN, USA, offers a distinct presence, having been established in 1900. Within the home, two private bedrooms provide peaceful retreats, each offering a personal space for quiet contemplation and rest. A complete full bathroom serves the needs of the household, providing a functional area for daily routines. The comfortable living area encompasses 1004 square feet, thoughtfully arranged on a single level for effortless daily living. This interior space is complemented by a substantial lot spanning 10019 square feet, presenting a vast outdoor expanse for cultivating personal gardens or enjoying open-air activities. This hom
Key facts
- 0.23 acre lot
- Garage
- Built 1900
Property features AI
Exterior
- Parking: Detached garage (1 car)
- Utilities: Public water; Municipal sewer connected; No solid waste service indicated
- Home design: Single family residence; One story; Residential property
- Construction: Vinyl siding; Full foundation
- Exterior features: Covered patio/porch; Storage shed; Less than 1/4 acre lot (approximately 0.23 acre)
Interior
- Kitchen: Microwave; Electric oven; Refrigerator; Exhaust fan
- Bedrooms: 2 bedrooms (both on the main level)
- Bathrooms: 1 full bathroom (on the main level)
- Heating & cooling: Forced air heating (natural gas); Central air conditioning
- Interior features: Covered patio/porch; Storage shed; Has basement; Has view
- Laundry & utility: Washer; Dryer; Electric water heater
Neighborhood map
What this means for you Summary
Snapshot
- This is a 2-bed/1.0-bath single-family listed at $140k.
Deal economics
- At list price, monthly cash flow is $250 ($3k/yr) — positive.
- The deal already cash-flows at list — no discount required.
- Meets the 1% rule at list price ($1k rent vs $140k).
- Recommended offer: $136k (3.0% below list) — sets the bar for market timing.
- Cap rate 8.4% vs local median 4.3% in Greencastle — top-decile yield for the area; either an underpriced asset or a hidden risk that comps aren't pricing in. Stress-test before assuming the spread holds.
Location & tenants
- Location reads 73/100 on livability (#108 in IN) — a middle-class / working-renter tenant base. Strengths: cost of living A+, housing A+; Watch: employment C-, amenities F, commute F.
- Greencastle Community School Corporation (town): math 38% / reading 42% proficiency, ranked #145 of 301 in IN (top 48%) — families likely to look elsewhere, expect single-tenant / working-renter base with shorter leases.
- Zoned schools: Martha J Ridpath Elementary School (199 students, 70% FRL); Greencastle High School (math 42% / reading 67%, grade C-, #79 of 369 statewide, top 26%, 498 students, 49% FRL) — zoned schools average 60% FRL vs 38% district-wide (22 pts higher); higher-poverty schools than district average — tighter screening recommended.
- Zoned-school proficiency averages 54% at this address vs 40% district-wide (+14 pts) — the actual schools serving this property are materially stronger than the Greencastle Community School Corporation average implies; a family-tenant draw the district grade alone would hide.
- Market conditions: 97 active listings in the ZIP; 2 comparable units currently listed for rent nearby; 166 units permitted in Putnam County in 2024 (0 in 5+ unit buildings).
Forward outlook
- Local home prices are declining (-3.0%/yr); year-one equity from $967 of loan paydown is wiped out by about $4k of value loss. Plan a longer hold.
- Putnam County population projected to shrink 8% by 2050 — rents likely to lag national; underwrite the cash flow, not the appreciation.
Negotiation context
- It's been on market 50 days — a 3% lower offer ($136k) is reasonable based on typical stale-listing flexibility.
- 2 sale attempts with the ask held roughly flat each time — persistent listings suggest the price (not the market) is what's stuck; bring a comps-based counter.
Risks & watch-outs
- Watch-outs: built in 1900 — expect roof / HVAC / electrical / plumbing capex.
Questions for the listing agent
- It's been on market 50 days. Have you received any prior offers? Is the seller open to a 3% concession, seller financing, or rate buy-down credit?
- Built in 1900 — when were the roof, HVAC, electrical panel, plumbing, and water heater last replaced?
- Is there a deadline driving the sale (1031 exchange, divorce, estate, relocation)? That informs how much negotiation room exists.
- What's the average days-on-market for RENTAL listings here right now (not sales)? A rising rental-DOM trend means longer vacancies and softer asking-rent achievability than the comps imply.
- What's the recent tenant-quality profile in this submarket — average credit score on applications, eviction rate, late-payment / NSF rate, and stable-employment percentage? A property-management company in the area should have these aggregated.
- How much new for-sale + rental construction is in the pipeline within 1–3 miles? Heavy new supply typically softens prices + rents 12–24 months out; constrained supply supports both.
Investment metrics
- 1% rule
- 1.05% ✓
- Cap rate
- 8.44%
- Cash-on-cash
- 7.67%
- DSCR
- 1.34
- GRM
- 7.9
CMA / ARV
- ARV (on-the-fly)
- $160,640
- Comps found
- 9
Show comp detail 9 sales within ~0.75 mi
| Address | Dist | Beds/Ba | Sqft | Sold | Price | $/sf | Match |
|---|---|---|---|---|---|---|---|
| 7 Beveridge St | 0.21mi | 2/1.0 | 1,012 (+1%) | 0mo | $130,000 | $128 | 89 |
| 114 W Berry St | 0.08mi | 3/1.5 (+1) | 1,012 (+1%) | 20mo | $180,000 | $178 | 71 |
| 510 Ohio St | 0.68mi | 3/1.5 (+1) | 1,012 (+1%) | 4mo | $175,000 | $173 | 57 |
| 8 W Seminary St | 0.63mi | 2/2.0 | 983 (-2%) | 15mo | $120,000 | $122 | 51 |
| 405 E Berry St | 0.57mi | 3/1.0 (+1) | 1,092 (+9%) | 8mo | $175,000 | $160 | 47 |
| 903 S Locust St | 0.45mi | 2/1.0 | 1,132 (+13%) | 14mo | $195,000 | $172 | 46 |
| 301 S Jackson St | 0.63mi | 2/1.0 | 1,096 (+9%) | 15mo | $141,000 | $129 | 43 |
| 303 S Jackson St | 0.62mi | 2/1.0 | 1,122 (+12%) | 15mo | $195,000 | $174 | 39 |
| 512 Maple Ave | 0.75mi | 3/1.0 (+1) | 1,074 (+7%) | 13mo | $110,000 | $102 | 37 |
Match score weights: distance 35% · size 25% · config 20% · recency 20%. Top-matched comps best support the ARV.
Projected returns pro-forma
-3.0% appreciation · 3.0% rent growth · sell at horizon
- IRR
- -4.6%
- Equity multiple
- 0.83×
- Total profit
- $-6,729
- Equity at exit
- $20,860
- IRR
- 5.1%
- Equity multiple
- 1.37×
- Total profit
- $14,638
- Equity at exit
- $12,096
Cash invested: $39,172 (down + closing). Projections, not guarantees.
Landlord ↔ Tenant lean methodology
- Overall (STATE)
- 90 Strongly Landlord-Friendly
- State Indiana
- 90 Strongly Landlord-Friendly · R+11
- County
- — inherits STATE
- City
- — inherits STATE
ZIP-level market 46135
- Home prices YoY
- -20.8%
- Active inventory
- 97
- Price-to-rent
- 7.9×
Monthly cashflow live
- Estimated rent
- $1,474 medium interval (Pro) →
- Mortgage (P&I)
- −$734
- Tax from tax record
- −$122 /mo · $1,464/yr
- Insurance
- −$58
- HOA
- −$0
- Vacancy / Maint / Mgmt
- −$310
- Net cashflow
- $250
Break-even live
UW: 25.0% down · 7.5% · 30yr · 1.5% tax · 5.0% vac · 8.0% maint · 8.0% mgmt
Financing live
Cash to close
- Down payment
- $34,975
- Closing costs
- $4,197
- Reserves months
- —
- Total cash needed
- —
Loan-product check · same deal, 3 products live
Conventional
25% down · 7.5% · 30yr
- Down + closing
- —
- Monthly P&I
- —
- Monthly cashflow
- —
- DSCR
- —
- Eligible?
- —
Personal DTI + credit; lowest rate.
DSCR
20% down · 8.5% · 30yr
- Down + closing
- —
- Monthly P&I
- —
- Monthly cashflow
- —
- DSCR
- —
- Eligible?
- —
No personal income docs; deal must DSCR.
Hard money
10% down · 12.0% · 12mo
- Down + closing
- —
- Monthly P&I
- —
- Monthly cashflow
- —
- DSCR
- —
- Eligible?
- —
Short-term bridge; refi at stabilization.
Rent comps 2 comps
| Address | Beds | Baths | Sqft | Rent | $/sqft | DOM | Units | Dist |
|---|---|---|---|---|---|---|---|---|
| 408 W Washington St Unit B Greencastle, IN | 3.0 | 2.0 | 1300 | $1,650 | $1.27 | 11d | 1 | 0.75mi |
| 810 N Madison St Unit 1 Greencastle, IN | 3.0 | 1.0 | 1200 | $1,200 | $1.00 | 2d | 1 | 1.26mi |
Listing history 4 events
-
2026-05-11status Pending
-
2026-05-08status Active
-
2026-04-28status Pending
-
2026-03-12$139,900 Active
ⓘ Source: listings_history table (triggers on properties + properties_extension) + one-shot
backfill from property_details.listing_events for pre-trigger history.
Tax reassessment forecast IN · Partial reset (capped growth)
- Current annual tax
- $1,464 · $122/mo
- Projected year-2 tax
- $1,464 · $122/mo
- Expected delta
- $0/yr ($0/mo · 0.0%)
ⓘ Screening estimate from a state-policy table — verify with the county assessor before closing.
Climate risk First Street
- Flood 1/10 Low FEMA zone X (unshaded) · 0% chance over 30 yrs
- Wildfire 1/10 Low
- Heat 3/10 Moderate 7 d/yr ≥103°F today · 18 d/yr by 30 yrs out
- Wind 2/10 Low 100% chance of damaging wind over 30 yrs
- Air quality 2/10 Low 1 unhealthy d/yr today · 2 by 30 yrs out
Nearby sold comps map
Loading sold comps map…
Walkable amenities ~0.75 mi
Loading nearby amenities…
Taxation est. · year 1
- Rental income
- $17,687
- − Mortgage interest
- −$7,837
- − Property taxes
- −$1,464
- − Insurance
- −$700
- − Repairs & maintenance
- −$1,415
- − Management
- −$1,415
- − Depreciation
- −$4,070
- Taxable income
- $787
- Est. tax owed @ 24.0%
- −$189
- After-tax cash flow
- $2,816/yr
For passive investors: Depreciation is non-cash, so a rental often shows a tax loss while cash-flowing — sheltering income. Rental losses are passive: they offset passive income freely, and up to $25,000/yr can offset ordinary (W-2) income if you actively participate and your MAGI is under $100k (phasing out to $0 by $150k); unused losses carry forward. On sale, claimed depreciation is recaptured at up to 25%, and gains may owe capital-gains tax (a 1031 exchange can defer both). Figures are a year-1 estimate at your 24.0% rate — not tax advice; consult a CPA.
Schools (NCES district)
- District
- Greencastle Community School Corporation
- NCES district ID
- 1803990
- Math proficiency
- 38% ▼ -5.00%
- Reading proficiency
- 42% ▼ -6.00%
- Median HH income
- $46,694
- Composite
- 34.17/100
- National rank
- #5276
- State rank
- #145 of 301 in IN
Livability — Greencastle
- Score
- 73/100
- State rank
- #108
- US rank
- #5665
Category grades
Schools grade is shown separately in the Schools card above.
Census & demographics
- Census place
- Greencastle, IN
- Population (ZIP)
- 19,639
Population outlook (Putnam County) Hauer SSP2
- Today (2025)
- 37,226 people
- By 2030
- 36,723 · -1.4%
- By 2040
- 35,407 · -4.9%
- By 2050
- 34,177 · -8.2%
- By 2075
- 32,038 · -13.9%
- By 2100
- 28,380 · -23.8%
Race, ethnicity, and origin ACS 2023
- Neighborhood character
- Predominantly White (86%)
- Race & ethnicity
- White 86% Black 6% Two or more races 4% Hispanic / Latino 3% Asian 2%
- Common ancestry
- Italian 2% Slovak 2% Lithuanian 1%
- Foreign-born
- 4% · China, Canada
- Languages at home
- 96% English-only · Spanish 1% French/Haitian/Cajun 1% Other Indo-European 1%
Political lean MEDSL · Putnam
- 2024 margin
- Solid R (+52.0) · D 23.1% · R 75.1% · Other 1.8%
- 2008→2024 swing
- -40.0pp toward R · 2008: -12.0pp · 2024: -52.0pp
- All cycles
- 2024: R+52.0 2020: R+50.2 2016: R+49.6 2012: R+32.6 2008: R+12.0
Not yet ingested
- Civics
- —
Market trends
- HPI YoY
- ▼ -58.66%
- Current HPI
- 222.8815
- Rent YoY
- —
- Metro
- —
- State GDP YoY
- ▲ 2.90%
- F500 in state
- 18
Industry mix (Fortune 500 HQ in IN)
| Industry | F500 HQs | Revenue |
|---|---|---|
| Industrial Machinery | 2 | $37B |
|
||
| Healthcare | 1 | $177B |
|
||
| Pharmaceuticals | 1 | $45B |
|
||
| Metals / Steel | 1 | $18B |
|
||
| Agriculture | 1 | $17B |
|
||
| Packaging | 1 | $12B |
|
||
Price history
4 events — show timeline
- 2026-05-11 Pending — MIBOR as Distributed by MLS Grid
- 2026-05-08 Relisted — MIBOR as Distributed by MLS Grid
- 2026-04-28 Pending — MIBOR as Distributed by MLS Grid
- 2026-03-12 Listed $139,900 MIBOR as Distributed by MLS Grid
Property tax history
+2.8%/yrLatest (2024): $1,464 · +14.7% YoY. Source: county tax records.
Cash-flow waterfall
monthlySold comps — $/sqft
last 12 mo · ≤1 miLoading sold comps…