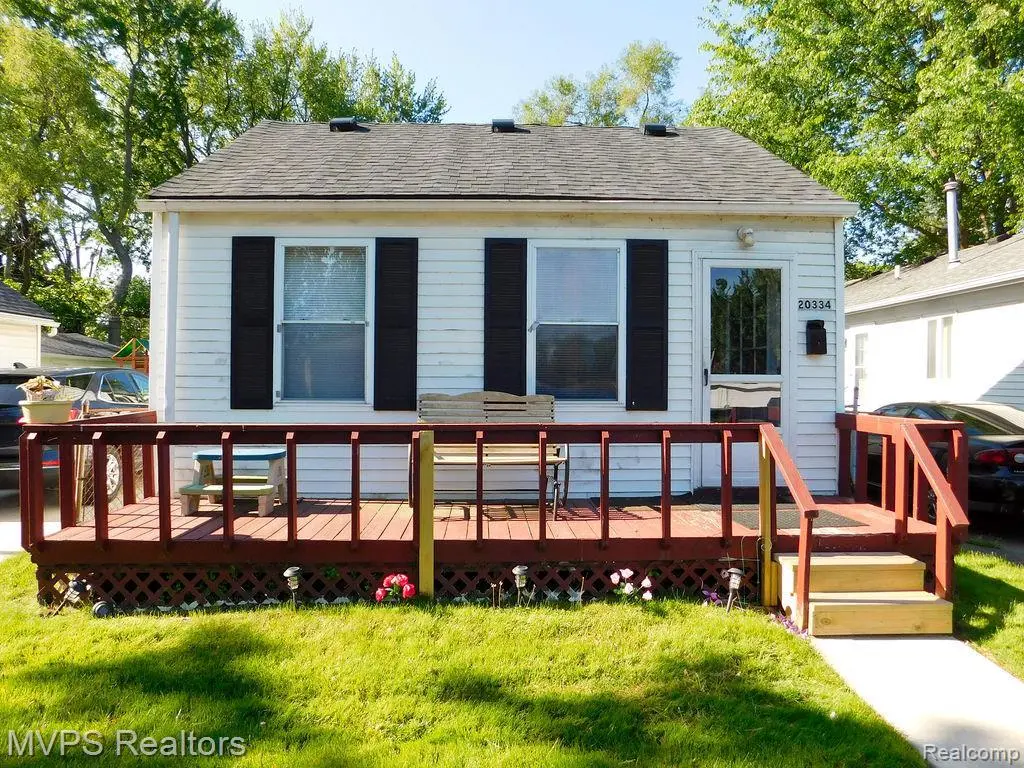
20334 E 8 Mile Rd · Harper Woods, MI
Flood risk 1/10 · Minimal
- FEMA flood zone
- X (unshaded)
- Chance of flooding over 30 yrs
- 0.0%
- Est. flood insurance / yr
- $507 – $1,088
Fire risk 1/10 · Minimal
- Est. fire insurance / yr
- $784 – $1,456
Heat risk 3/10 · Minor
- Hot days now (above 96°F)
- 7 days/yr
- Hot days in 30 yrs
- 15 days/yr
Wind risk 2/10 · Minimal
- Chance of severe wind over 30 yrs
- —
Air-quality risk 4/10 · Minor
- Unhealthy air days now
- 4 days/yr
- Unhealthy air days in 30 yrs
- 5 days/yr
Risk factors via First Street. Map © Google.
Why this score? — see what drove the B grade
The composite is a weighted blend of 9 inputs, each scored 0–100. Each bar is that input's sub-score; the figure is the points it added to the 100-point composite (weight × sub-score).
- Cash flow +24.9/30.0
- ARV discount +15.0/15.0
- 1% rule +8.4/10.0
- DSCR +8.1/10.0
- Schools +5.7/10.0
- Rent growth +3.8/5.0
- Livability +3.7/5.0
- Condition / age +2.5/5.0
- Appreciation +0.0/10.0
$98,000
🖨 Deal sheet 📄 Offer letter ✓ Due diligence
Listing remarks MLS
Great investment opportunity! This well-maintained property features a long-term tenant of 10+ years, providing immediate and reliable rental income. The home offers several updates, including newer windows, a newer roof, and a freshly paved driveway. Enjoy the added living space of the enclosed 3-season room overlooking the backyard. Conveniently located near I-94 for easy commuting and situated within the highly desirable Grosse Pointe School District. A solid addition to any investment portfolio!
Key facts
- Newer roof
- Backyard
- Newer windows
Tags
Property features AI
Exterior
- Parking: No garage
- Utilities: Public water; Public sewer
- Home design: Single-family residence; One-level entry at ground level; One story
- Construction: Vinyl siding
- Exterior features: Paved road access; Lot dimensions approximately 40 x 93 (0.09 acres)
Interior
- Bathrooms: 1 full bathroom
- Heating & cooling: Forced air heating; Natural gas heating; No cooling
- Interior features: Crawl space basement; Total of 4 rooms
Neighborhood map
What this means for you Summary
Snapshot
- This is a 2-bed/1.0-bath single-family listed at $98k.
Deal economics
- At list price, monthly cash flow is $209 ($3k/yr) — positive.
- The deal already cash-flows at list — no discount required.
- Meets the 1% rule at list price ($1k rent vs $98k).
- Recommended offer: $97k (1.5% below list) — sets the bar for market timing.
Location & tenants
- Location reads 73/100 on livability (#199 in MI) — a middle-class / working-renter tenant base. Strengths: commute A+, cost of living A+, housing A+; Watch: employment D+, health & safety D+, schools D-.
- Grosse Pointe Public Schools (suburban): math 56% / reading 68% proficiency, ranked #24 of 540 in MI (top 4%) — acceptable for families but not a draw, mixed tenant base, ~2y average lease; only 13% free/reduced lunch — higher-income household profile.
- Market conditions: Rents rising fast (+5.1%/yr); 133 active listings in the ZIP; 1 comparable units currently listed for rent nearby; 2,639 units permitted in Wayne County in 2024 (1,216 in 5+ unit buildings).
Forward outlook
- Local home prices are declining (-3.0%/yr); year-one equity from $678 of loan paydown is wiped out by about $3k of value loss. Plan a longer hold.
- Wayne County population projected at -17% by 2050 — secular population decline; favor cash flow + early exit over multi-decade hold.
- At projected returns (-3.0% appreciation + 5.1% rent growth), your $27k cash investment doubles in ~9 years — after that, you're playing with house money.
Negotiation context
- It's been on market 16 days — a 2% lower offer ($97k) is reasonable based on typical stale-listing flexibility.
- 3 sale attempts since 27y ago with the ask held roughly flat each time — persistent listings suggest the price (not the market) is what's stuck; bring a comps-based counter.
- Current owner paid $57k; list at $98k implies a 72% gain — meaningful room to come down on a strong offer.
Risks & watch-outs
- Watch-outs: property tax is 3.4% of price; built in 1938 — expect roof / HVAC / electrical / plumbing capex.
Questions for the listing agent
- Built in 1938 — when were the roof, HVAC, electrical panel, plumbing, and water heater last replaced?
- Property tax is high relative to price — has the assessment been appealed recently, and will the sale trigger a re-assessment?
- Is there a deadline driving the sale (1031 exchange, divorce, estate, relocation)? That informs how much negotiation room exists.
- Schools are D-rated, which usually means shorter tenancies and higher turnover. Who's the typical renter profile here, and what's been the actual vacancy rate?
- Crime grade is F in this area — have there been break-ins, vandalism, or insurance claims at this property in the last 3 years? What carrier currently insures it and at what premium?
- What's the average days-on-market for RENTAL listings here right now (not sales)? A rising rental-DOM trend means longer vacancies and softer asking-rent achievability than the comps imply.
- What's the recent tenant-quality profile in this submarket — average credit score on applications, eviction rate, late-payment / NSF rate, and stable-employment percentage? A property-management company in the area should have these aggregated.
- How much new for-sale + rental construction is in the pipeline within 1–3 miles? Heavy new supply typically softens prices + rents 12–24 months out; constrained supply supports both.
Investment metrics
- 1% rule
- 1.34% ✓
- Cap rate
- 8.86%
- Cash-on-cash
- 9.15%
- DSCR
- 1.41
- GRM
- 6.2
CMA / ARV
- ARV (on-the-fly)
- $120,240
- Comps found
- 6
Show comp detail 6 sales within ~0.75 mi
| Address | Dist | Beds/Ba | Sqft | Sold | Price | $/sf | Match |
|---|---|---|---|---|---|---|---|
| 20380 Hollywood St | 0.07mi | 2/1.5 | 709 (-2%) | 17mo | $107,000 | $151 | 78 |
| 20488 Hollywood St | 0.07mi | 2/1.0 | 756 (+5%) | 17mo | $90,000 | $119 | 74 |
| 20518 W Hollywood St S | 0.10mi | 2/1.0 | 750 (+4%) | 18mo | $42,500 | $57 | 73 |
| 20040 E 8 Mile Rd | 0.11mi | 2/1.0 | 792 (+10%) | 12mo | $159,000 | $201 | 68 |
| 2104 Roslyn Rd | 0.58mi | 2/1.0 | 704 (-2%) | 4mo | $170,000 | $241 | 66 |
| 2138 Ridgemont Rd | 0.53mi | 2/1.0 | 809 (+12%) | 2mo | $135,000 | $167 | 53 |
Match score weights: distance 35% · size 25% · config 20% · recency 20%. Top-matched comps best support the ARV.
Projected returns pro-forma
-3.0% appreciation · 5.1% rent growth · sell at horizon
- IRR
- 0.4%
- Equity multiple
- 1.01×
- Total profit
- $402
- Equity at exit
- $14,612
- IRR
- 12.4%
- Equity multiple
- 2.10×
- Total profit
- $30,134
- Equity at exit
- $8,473
Cash invested: $27,440 (down + closing). Projections, not guarantees.
Landlord ↔ Tenant lean methodology
- Overall (STATE)
- 62 Landlord-Friendly
- State Michigan
- 62 Landlord-Friendly · EVEN
- County
- — inherits STATE
- City
- — inherits STATE
ZIP-level market 48225
- Rents YoY
- 5.1%
- Active inventory
- 133
- Price-to-rent
- 6.2×
Monthly cashflow live
- Estimated rent
- $1,316 medium interval (Pro) →
- Mortgage (P&I)
- −$514
- Tax from tax record
- −$275 /mo · $3,303/yr
- Insurance
- −$41
- HOA
- −$0
- Vacancy / Maint / Mgmt
- −$276
- Net cashflow
- $209
Break-even live
UW: 25.0% down · 7.5% · 30yr · 1.5% tax · 5.0% vac · 8.0% maint · 8.0% mgmt
Financing live
Cash to close
- Down payment
- $24,500
- Closing costs
- $2,940
- Reserves months
- —
- Total cash needed
- —
Loan-product check · same deal, 3 products live
Conventional
25% down · 7.5% · 30yr
- Down + closing
- —
- Monthly P&I
- —
- Monthly cashflow
- —
- DSCR
- —
- Eligible?
- —
Personal DTI + credit; lowest rate.
DSCR
20% down · 8.5% · 30yr
- Down + closing
- —
- Monthly P&I
- —
- Monthly cashflow
- —
- DSCR
- —
- Eligible?
- —
No personal income docs; deal must DSCR.
Hard money
10% down · 12.0% · 12mo
- Down + closing
- —
- Monthly P&I
- —
- Monthly cashflow
- —
- DSCR
- —
- Eligible?
- —
Short-term bridge; refi at stabilization.
Rent comps 1 comps
| Address | Beds | Baths | Sqft | Rent | $/sqft | DOM | Units | Dist |
|---|---|---|---|---|---|---|---|---|
| 22843 Grove St #47 Saint Clair Shores, MI | 1.0 | 1.0 | 700 | $1,100 | $1.57 | 20d | 1 | 1.06mi |
Listing history 12 events
-
2026-06-18days on market $98,000 Active 16 DOM
-
2026-06-17days on market $98,000 Active 15 DOM
-
2026-06-16days on market $98,000 Active 14 DOM
-
2026-06-15days on market $98,000 Active 13 DOM
-
2026-06-13days on market $98,000 Active 11 DOM
-
2026-06-13days on market $98,000 Active 10 DOM
-
2026-06-09days on market $98,000 Active 7 DOM
-
2026-06-08days on market $98,000 Active 6 DOM
-
2026-06-07days on market $98,000 Active 5 DOM
-
2026-06-04days on market $98,000 Active 2 DOM
-
2026-06-02remarks 504-char remark
Show marketing remark (504 chars)
Great investment opportunity! This well-maintained property features a long-term tenant of 10+ years, providing immediate and reliable rental income. The home offers several updates, including newer windows, a newer roof, and a freshly paved driveway. Enjoy the added living space of the enclosed 3-season room overlooking the backyard. Conveniently located near I-94 for easy commuting and situated within the highly desirable Grosse Pointe School District. A solid addition to any investment portfolio!
-
2026-06-02$98,000 Active 1 DOM
Show marketing remark (504 chars)
Great investment opportunity! This well-maintained property features a long-term tenant of 10+ years, providing immediate and reliable rental income. The home offers several updates, including newer windows, a newer roof, and a freshly paved driveway. Enjoy the added living space of the enclosed 3-season room overlooking the backyard. Conveniently located near I-94 for easy commuting and situated within the highly desirable Grosse Pointe School District. A solid addition to any investment portfolio!
ⓘ Source: listings_history table (triggers on properties + properties_extension) + one-shot
backfill from property_details.listing_events for pre-trigger history.
Tax reassessment forecast MI · Partial reset (capped growth)
- Current annual tax
- $3,303 · $275/mo
- Projected year-2 tax
- $3,303 · $275/mo
- Expected delta
- $0/yr ($0/mo · -0.0%)
ⓘ Screening estimate from a state-policy table — verify with the county assessor before closing.
Climate risk First Street
- Flood 1/10 Low FEMA zone X (unshaded) · 0% chance over 30 yrs
- Wildfire 1/10 Low
- Heat 3/10 Moderate 7 d/yr ≥96°F today · 15 d/yr by 30 yrs out
- Wind 2/10 Low
- Air quality 4/10 Moderate 4 unhealthy d/yr today · 5 by 30 yrs out
Nearby sold comps map
Loading sold comps map…
Walkable amenities ~0.75 mi
Loading nearby amenities…
Taxation est. · year 1
- Rental income
- $15,787
- − Mortgage interest
- −$5,490
- − Property taxes
- −$3,303
- − Insurance
- −$490
- − Repairs & maintenance
- −$1,263
- − Management
- −$1,263
- − Depreciation
- −$2,851
- Taxable income
- $1,128
- Est. tax owed @ 24.0%
- −$271
- After-tax cash flow
- $2,241/yr
For passive investors: Depreciation is non-cash, so a rental often shows a tax loss while cash-flowing — sheltering income. Rental losses are passive: they offset passive income freely, and up to $25,000/yr can offset ordinary (W-2) income if you actively participate and your MAGI is under $100k (phasing out to $0 by $150k); unused losses carry forward. On sale, claimed depreciation is recaptured at up to 25%, and gains may owe capital-gains tax (a 1031 exchange can defer both). Figures are a year-1 estimate at your 24.0% rate — not tax advice; consult a CPA.
Schools (NCES district)
- District
- Grosse Pointe Public Schools
- NCES district ID
- 2625740
- Math proficiency
- 56% ▼ -2.00%
- Reading proficiency
- 68% ▲ 2.00%
- Median HH income
- $89,975
- Composite
- 56.51/100
- National rank
- #1152
- State rank
- #24 of 540 in MI
Livability — Harper Woods
- Score
- 73/100
- State rank
- #199
- US rank
- #5054
Category grades
Schools grade is shown separately in the Schools card above.
Census & demographics
- Census place
- Harper Woods, MI
- County
- Wayne County · 1,562,939 people
- City population
- 16,098
- Metro
- Detroit-Warren-Dearborn, MI
- Population (ZIP)
- 16,098
- Household income
- $61,750
- Rent vs Own
- Severe rent burden
- 410.0
Population outlook (Wayne County) Hauer SSP2
- Today (2025)
- 1,675,273 people
- By 2030
- 1,620,300 · -3.3%
- By 2040
- 1,502,341 · -10.3%
- By 2050
- 1,384,039 · -17.4%
- By 2075
- 1,124,592 · -32.9%
- By 2100
- 881,193 · -47.4%
Race, ethnicity, and origin ACS 2023
- Neighborhood character
- Predominantly Black (65%)
- Race & ethnicity
- Black 65% White 28% Two or more races 4% Hispanic / Latino 1%
- Common ancestry
- Romanian 4% Lithuanian 1% German 1%
- Foreign-born
- 2% · Canada
- Languages at home
- 95% English-only · Arabic 2% Spanish 1%
Political lean MEDSL · Wayne
- 2024 margin
- Strong D (+29.0) · D 62.7% · R 33.7% · Other 3.6%
- 2008→2024 swing
- -20.5pp toward R · 2008: 49.5pp · 2024: 29.0pp
- All cycles
- 2024: D+29.0 2020: D+38.1 2016: D+37.3 2012: D+46.9 2008: D+49.5
Not yet ingested
- Civics
- —
Market trends
- HPI YoY
- ▼ -150.40%
- Current HPI
- 181.4961
- Rent YoY
- ▲ 5.10%
- Metro
- Detroit-Warren-Dearborn, MI
- State GDP YoY
- ▲ 1.37%
- F500 in state
- 28
Industry mix (Fortune 500 HQ in MI)
| Industry | F500 HQs | Revenue |
|---|---|---|
| Automotive Parts | 3 | $48B |
|
||
| Automotive | 2 | $372B |
|
||
| Chemicals | 1 | $45B |
|
||
| Automotive Retail | 1 | $29B |
|
||
| Healthcare / Medical Devices | 1 | $23B |
|
||
| Automotive Technology | 1 | $20B |
|
||
Price history
+15.3% since first listed8 events — show timeline
- 2026-06-02 Listed $98,000 MiRealSource-MiMLS
- 2026-06-02 Listed $98,000 REALCOMP
- 2003-05-12 Sold (Public Records) $57,000 Public Records
- 1999-11-12 Sold (Public Records) $28,500 Public Records
- 1999-09-22 Sold (MLS) $1 MiRealSource-MiMLS
- 1999-09-08 Listing Removed — MiRealSource-MiMLS
- 1999-08-24 Listed $64,900 MiRealSource-MiMLS
- 1998-11-12 Sold (Public Records) $85,000 Public Records
Property tax history
+8.3%/yrLatest (2025): $3,303 · +1.5% YoY. Source: county tax records.
Cash-flow waterfall
monthlySold comps — $/sqft
last 12 mo · ≤1 miLoading sold comps…