 🏗️ New Construction
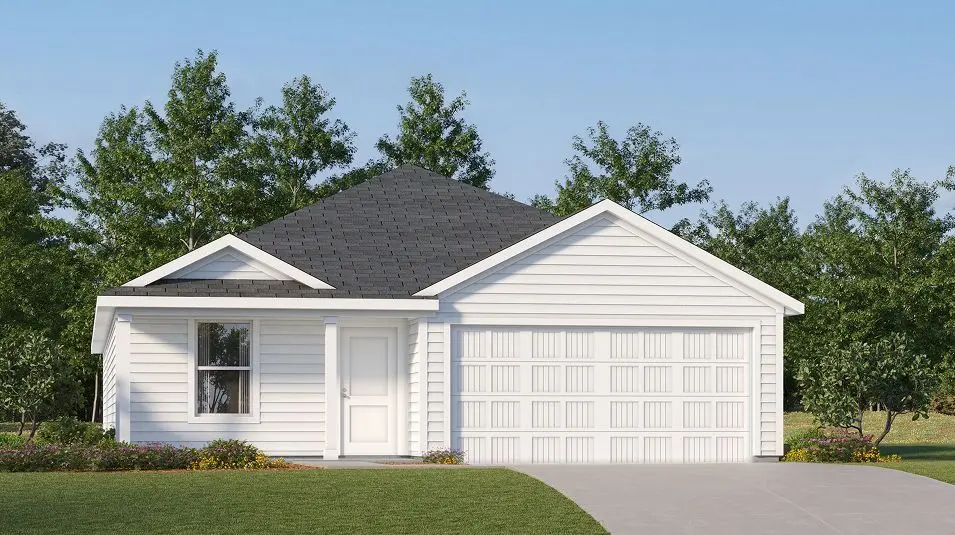
Dowing Plan · New Braunfels, TX
Flood risk No data
- FEMA flood zone
- —
- Chance of flooding over 30 yrs
- —
- Est. flood insurance / yr
- —
Fire risk No data
- Est. fire insurance / yr
- —
Heat risk No data
- Hot days now (above threshold)
- —
- Hot days in 30 yrs
- —
Wind risk No data
- Chance of severe wind over 30 yrs
- —
Air-quality risk No data
- Unhealthy air days now
- —
- Unhealthy air days in 30 yrs
- —
Risk factors via First Street. Map © Google.
Why this score? — see what drove the F grade
The composite is a weighted blend of 9 inputs, each scored 0–100. Each bar is that input's sub-score; the figure is the points it added to the 100-point composite (weight × sub-score).
- ARV discount +7.5/15.0
- Cash flow +6.0/30.0
- Schools +4.4/10.0
- Livability +4.2/5.0
- Condition / age +2.5/5.0
- Rent growth +2.0/5.0
- 1% rule +1.3/10.0
- DSCR +0.4/10.0
- Appreciation +0.0/10.0
$254,999
🖨 Deal sheet (PDF) 📄 Offer letter ✓ Due diligence
Listing remarks
This new four-bedroom home offers convenient single-story living. A bedroom is secluded near the front of the home, leading to an inviting and spacious open-concept layout shared between the kitchen, dining room and family room. Three additional bedrooms are tucked away to the side for improved comfort and privacy, including the lavish owner's suite at the back of the home with a full bathroom and walk-in closet.
Key facts
- Lavish owner's suite
- Single-story living
- Full bathroom
Tags
Property features AI
Finance
- Other: List price $254,999; Address: New Braunfels, TX (1907 Longspur)
Exterior
- Parking: 2 parking spaces; 2-car garage
- Home design: New construction plan named Dowing; Single-family home (plan)
- Exterior features: Living area approximately 1850
Interior
- Kitchen: Standard kitchen (plan details)
- Bedrooms: 4 bedrooms
- Bathrooms: 2 bathrooms
- Interior features: Open living area
Neighborhood map
What this means for you Summary
Snapshot
- This is a 4-bed/2.0-bath single-family listed at $255k.
Deal economics
- At list price, monthly cash flow is $-603 ($-7k/yr) — negative.
- To cash-flow at today's rent, offer at most $228k (10.5% below list).
- To meet the 1% rule (rent ≥ 1% of price), the offer needs to be $200k (21.7% below list).
- Recommended offer: $200k (21.7% below list) — sets the bar for 1% rule.
Location & tenants
- Location reads 83/100 on livability (#9 in TX, #925 nationally) — a professional / high-income tenant draw. Strengths: amenities A+, housing A+, health & safety A+; Watch: commute F.
- New Braunfels ISD (urban): math 47% / reading 53% proficiency, ranked #157 of 826 in TX (top 19%) — acceptable for families but not a draw, mixed tenant base, ~2y average lease.
- Zoned schools: Walnut Springs El (math 42% / reading 42%, grade F, #1,335 of 4,322 statewide, top 33%, 312 students, 45% FRL); New Braunfels Middle (math 44% / reading 46%, grade D, #479 of 1,662 statewide, top 29%, 1,301 students, 44% FRL); New Braunfels H S (math 53% / reading 10%, grade F, #1,073 of 1,632 statewide, top 66%, 1,926 students, 32% FRL) — zoned schools at 41% FRL track the district average.
- Market conditions: Rents soft (-2.0%/yr); 1931 active listings in the ZIP; 40 comparable units currently listed for rent nearby; rentals at typical pace (median 26d on market — plan ~3-4 weeks tenant-placement turnaround); solid renter incomes; 3,420 units permitted in Comal County in 2024 (1,164 in 5+ unit buildings).
Forward outlook
- Local home prices are declining (-3.0%/yr); year-one equity from $2k of loan paydown is wiped out by about $9k of value loss. Plan a longer hold.
- Comal County population projected at +70% by 2050 — long-run rental-demand tailwind backs the buy-and-hold thesis.
Negotiation context
- It's been on market 60 days — a 3% lower offer ($247k) is reasonable based on typical stale-listing flexibility.
Questions for the listing agent
- What do current leases actually rent for vs. the listed asking? Can we see a recent rent roll and the last 12 months of T-12 income?
- It's been on market 60 days. Have you received any prior offers? Is the seller open to a 22% concession, seller financing, or rate buy-down credit?
- Is there a deadline driving the sale (1031 exchange, divorce, estate, relocation)? That informs how much negotiation room exists.
- Schools are B-rated — typically a magnet for longer-tenancy family renters. What's the average tenant stay here, and is there a school-zone premium baked into asking?
- The area grade is low — what's the realistic commute time and amenity access for the typical tenant pool here? Any planned neighborhood developments (good or bad) we should know about?
- What's the average days-on-market for RENTAL listings here right now (not sales)? A rising rental-DOM trend means longer vacancies and softer asking-rent achievability than the comps imply.
- What's the recent tenant-quality profile in this submarket — average credit score on applications, eviction rate, late-payment / NSF rate, and stable-employment percentage? A property-management company in the area should have these aggregated.
- How much new for-sale + rental construction is in the pipeline within 1–3 miles? Heavy new supply typically softens prices + rents 12–24 months out; constrained supply supports both.
Investment metrics
- 1% rule
- 0.63% ✗
- Cap rate
- 4.00%
- Cash-on-cash
- -8.19%
- DSCR
- 0.64
- GRM
- 13.2
CMA / ARV
- ARV (median comp)
- $315,499
- List price
- $254,999
- Delta
- -19.18%
- Verdict
- UNDERPRICED
- Comps
- 20 within 1.0 mi
Show comp detail 12 sales within ~0.75 mi
| Address | Dist | Beds/Ba | Sqft | Sold | Price | $/sf | Match |
|---|---|---|---|---|---|---|---|
| 2931 Daisy Mdw | 0.40mi | 3/2.0 (-1) | 1,874 (+1%) | 1mo | $279,000 | $149 | 73 |
| 1919 Bonelli Eagle | 0.40mi | 3/2.0 (-1) | 1,891 (+2%) | 1mo | $269,999 | $143 | 72 |
| 2942 Daisy Mdw | 0.42mi | 4/2.0 | 1,742 (-6%) | 2mo | $255,000 | $146 | 69 |
| 851 Noel Frst | 0.45mi | 3/2.0 (-1) | 1,809 (-2%) | 2mo | $289,900 | $160 | 69 |
| 1712 Pahmeyer Path | 0.37mi | 4/2.0 | 2,000 (+8%) | 1mo | $325,000 | $163 | 69 |
| 1759 Loma Verde Dr | 0.58mi | 3/2.0 (-1) | 1,941 (+5%) | 0mo | $339,500 | $175 | 60 |
| 1436 Devin Dr | 0.75mi | 3/2.0 (-1) | 1,845 (-0%) | 1mo | $349,000 | $189 | 59 |
| 2982 Daisy Mdw | 0.53mi | 3/2.0 (-1) | 1,974 (+7%) | 2mo | $320,000 | $162 | 57 |
| 851 Highland | 0.68mi | 3/2.0 (-1) | 1,913 (+3%) | 3mo | $294,900 | $154 | 55 |
| 3132 Morlanga St | 0.71mi | 3/2.0 (-1) | 1,920 (+4%) | 2mo | $364,000 | $190 | 54 |
| 1938 Spotted Owl | 0.66mi | 3/2.0 (-1) | 2,017 (+9%) | 1mo | $250,000 | $124 | 49 |
| 1609 Sunstone | 0.68mi | 4/2.5 | 2,056 (+11%) | 2mo | $275,000 | $134 | 46 |
Match score weights: distance 35% · size 25% · config 20% · recency 20%. Top-matched comps best support the ARV.
Projected returns pro-forma
-3.0% appreciation · 0.0% rent growth · sell at horizon
- IRR
- -34.1%
- Equity multiple
- -0.08×
- Total profit
- $-95,367
- Equity at exit
- $47,042
- IRR
- -65.4%
- Equity multiple
- -0.75×
- Total profit
- $-155,007
- Equity at exit
- $27,279
Cash invested: $88,340 (down + closing). Projections, not guarantees.
Landlord ↔ Tenant lean methodology
- Overall (STATE)
- 87 Strongly Landlord-Friendly
- State Texas
- 87 Strongly Landlord-Friendly · R+5
- County
- — inherits STATE
- City
- — inherits STATE
ZIP-level market 78130
- Rents YoY
- -2.0%
- Active inventory
- 1931
- Price-to-rent
- 10.6×
Monthly cashflow live
- Estimated rent
- $1,996 high interval (Pro) →
- Mortgage (P&I)
- −$1,655
- Tax est. 1.5%
- −$394 /mo · $4,732/yr
- Insurance
- −$131
- HOA
- −$0
- Vacancy / Maint / Mgmt
- −$419
- Net cashflow
- $-603
Break-even live
Sensitivity live
| Price | -10% $-385 | -5% $-494 | +0% $-603 | +5% $-712 | +10% $-821 |
|---|---|---|---|---|---|
| Rent | -10% $-761 | -5% $-682 | +0% $-603 | +5% $-524 | +10% $-446 |
| Rate | -1.0pp $-444 | -0.5pp $-523 | base $-603 | +0.5pp $-685 | +1.0pp $-768 |
UW: 25.0% down · 7.5% · 30yr · 1.5% tax · 5.0% vac · 8.0% maint · 8.0% mgmt
Financing live
Cash to close
- Down payment
- $78,875
- Closing costs
- $9,465
- Reserves months
- —
- Total cash needed
- —
Loan-product check · same deal, 3 products live
Conventional
25% down · 7.5% · 30yr
- Down + closing
- —
- Monthly P&I
- —
- Monthly cashflow
- —
- DSCR
- —
- Eligible?
- —
Personal DTI + credit; lowest rate.
DSCR
20% down · 8.5% · 30yr
- Down + closing
- —
- Monthly P&I
- —
- Monthly cashflow
- —
- DSCR
- —
- Eligible?
- —
No personal income docs; deal must DSCR.
Hard money
10% down · 12.0% · 12mo
- Down + closing
- —
- Monthly P&I
- —
- Monthly cashflow
- —
- DSCR
- —
- Eligible?
- —
Short-term bridge; refi at stabilization.
Rent comps 40 comps
| Address | Beds | Baths | Sqft | Rent | $/sqft | DOM | Units | Dist |
|---|---|---|---|---|---|---|---|---|
| 1920 Bonelli Eagle New Braunfels, TX | 4.0 | 3.0 | 2142 | $2,045 | $0.95 | 13d | 1 | 0.40mi |
| 2126 Jasons West Ct New Braunfels, TX | 4.0 | 3.5 | 2431 | $2,199 | $0.90 | 23d | 1 | 0.40mi |
| 2018 Reserve Way New Braunfels, TX | 4.0 | 2.0 | 2023 | $2,795 | $1.38 | 18d | 1 | 0.41mi |
| 1666 Lantana Cir New Braunfels, TX | 3.0 | 2.0 | 1502 | $1,745 | $1.16 | 45d | 1 | 0.47mi |
| 2014 Rueben Rd New Braunfels, TX | 3.0 | 2.5 | 1380 | $1,595 | $1.16 | 45d | 1 | 0.48mi |
| 2028 Rueben Rd New Braunfels, TX | 3.0 | 2.5 | 1380 | $1,595 | $1.16 | 5d | 1 | 0.49mi |
| 2207 Allison Dr New Braunfels, TX | 4.0 | 2.0 | 1850 | $1,745 | $0.94 | 14d | 1 | 0.52mi |
| 2960 Nicholas Cv New Braunfels, TX | 3.0 | 2.0 | 2000 | $2,000 | $1.00 | 0d | 1 | 0.56mi |
| 1632 Sunnycrest Cir New Braunfels, TX | 3.0 | 2.0 | 1371 | $1,625 | $1.19 | 19d | 1 | 0.60mi |
| 1911 Kallijo Ln New Braunfels, TX | 3.0 | 2.0 | 1552 | $1,800 | $1.16 | 18d | 1 | 0.63mi |
| 1611 Sunnycrest Cir New Braunfels, TX | 3.0 | 2.0 | 1779 | $1,995 | $1.12 | 6d | 1 | 0.67mi |
| 1648 Sunfire Cir New Braunfels, TX | 3.0 | 2.0 | 1299 | $1,850 | $1.42 | 45d | 1 | 0.70mi |
| 1972 Bluethroat New Braunfels, TX | 3.0 | 2.0 | 1560 | $1,795 | $1.15 | 45d | 1 | 0.74mi |
| 3161 Birch Bnd New Braunfels, TX | 4.0 | 3.0 | 2622 | $2,500 | $0.95 | 3d | 1 | 0.77mi |
| 1973 Bluethroat New Braunfels, TX | 3.0 | 2.0 | 1458 | $1,750 | $1.20 | 18d | 1 | 0.77mi |
| 772 Vista Pkwy New Braunfels, TX | 4.0 | 2.0 | 1536 | $1,750 | $1.14 | 25d | 1 | 0.80mi |
| 1908 Tanger Ter New Braunfels, TX | 3.0 | 3.0 | 1762 | $1,900 | $1.08 | 16d | 1 | 0.80mi |
| 1908 Tanger Ter New Braunfels, TX | 3.0 | 3.0 | 1762 | $1,900 | $1.08 | 14d | 1 | 0.80mi |
| 1908 Tanger Ter New Braunfels, TX | 3.0 | 3.0 | 1762 | $1,900 | $1.08 | 25d | 1 | 0.80mi |
| 410 S Water Ln New Braunfels, TX | 4.0 | 2.0 | 1963 | $1,900 | $0.97 | 45d | 1 | 0.81mi |
| 419 Aaron Ln New Braunfels, TX | 4.0 | 2.0 | 1940 | $1,750 | $0.90 | 25d | 1 | 0.81mi |
| 2060 Meadow Pipit New Braunfels, TX | 3.0 | 2.0 | 1917 | $1,950 | $1.02 | 6d | 1 | 0.82mi |
| 1614 Sun Canyon Blvd New Braunfels, TX | 3.0 | 2.5 | 2152 | $2,200 | $1.02 | 25d | 1 | 0.84mi |
| 3200 Falconhead New Braunfels, TX | 3.0 | 2.5 | 2076 | $2,500 | $1.20 | 0d | 1 | 0.88mi |
| 1906 Fieldfare New Braunfels, TX | 3.0 | 2.0 | 1454 | $1,775 | $1.22 | 25d | 1 | 0.91mi |
| 2700 Farm to Market Road 1044 Unit 3-3x New Braunfels, TX | 3.0 | 2.5 | 1490 | $1,611 | $1.08 | 6d | 1 | 0.91mi |
| 2700 Farm to Market Road 1044 Unit 4x New Braunfels, TX | 4.0 | 3.5 | 1776 | $1,780 | $1.00 | 6d | 1 | 0.91mi |
| 341 Untermaier St New Braunfels, TX | 3.0 | 2.5 | 1380 | $1,475 | $1.07 | 25d | 1 | 0.94mi |
| 340 Untermaier St Canyon Lake, TX | 3.0 | 2.5 | 1380 | $1,495 | $1.08 | 45d | 1 | 0.95mi |
| 1302 S Mesquite Ave New Braunfels, TX | 3.0 | 2.0 | 1426 | $1,775 | $1.24 | 25d | 1 | 0.96mi |
| 2712 Scarlet Tanger New Braunfels, TX | 4.0 | 3.0 | 2445 | $2,295 | $0.94 | 45d | 1 | 0.97mi |
| 316 Loma Vista St Unit 316 New Braunfels, TX | 3.0 | 2.0 | 1650 | $1,350 | $0.82 | 45d | 1 | 0.98mi |
| 320 Untermaier St Canyon Lake, TX | 3.0 | 2.5 | 1380 | $1,495 | $1.08 | 45d | 1 | 0.98mi |
| 314 Loma Vista St New Braunfels, TX | 3.0 | 2.0 | 1650 | $1,350 | $0.82 | 45d | 1 | 0.99mi |
| 314 Loma Vista St New Braunfels, TX | 3.0 | 2.0 | 1650 | $1,350 | $0.82 | 16d | 1 | 0.99mi |
| 1898 Baron Dr New Braunfels, TX | 3.0 | 2.0 | 1593 | $1,950 | $1.22 | 45d | 1 | 0.99mi |
| 1213 Camellia Ln New Braunfels, TX | 4.0 | 2.0 | 1701 | $2,400 | $1.41 | 25d | 1 | 1.02mi |
| 2271 Garden Sun Pl New Braunfels, TX | 4.0 | 2.0 | 2055 | $2,200 | $1.07 | 14d | 1 | 1.04mi |
| 3027 Pine Valley Dr New Braunfels, TX | 3.0 | 2.0 | 1406 | $1,500 | $1.07 | 45d | 1 | 1.05mi |
| 2169 Hazelwood New Braunfels, TX | 4.0 | 2.5 | 2216 | $2,300 | $1.04 | 6d | 1 | 1.05mi |
Listing history 18 events
-
2026-06-21days on market $254,999 Active 60 DOM
-
2026-06-18days on market $254,999 Active 57 DOM
-
2026-06-17days on market $254,999 Active 56 DOM
-
2026-06-16days on market $254,999 Active 55 DOM
-
2026-06-15days on market $254,999 Active 54 DOM
-
2026-06-13days on market $254,999 Active 52 DOM
-
2026-06-09days on market $254,999 Active 48 DOM
-
2026-06-08days on market $254,999 Active 47 DOM
-
2026-06-07days on market $254,999 Active 46 DOM
-
2026-06-04days on market $254,999 Active 43 DOM
-
2026-06-03days on market $254,999 Active 42 DOM
-
2026-06-02days on market $254,999 Active 41 DOM
-
2026-06-02days on market $254,999 Active 40 DOM
-
2026-05-31days on market $254,999 Active 39 DOM
-
2026-05-09price $254,999 416-char remark
-
2026-05-07price $255,999 416-char remark
-
2026-04-28price $258,999 416-char remark
-
2026-04-22$263,999 Active 416-char remark
ⓘ Source: listings_history table (triggers on properties + properties_extension) + one-shot
backfill from property_details.listing_events for pre-trigger history.
Nearby sold comps map
Loading sold comps map…
Walkable amenities ~0.75 mi
Loading nearby amenities…
Taxation est. · year 1
- Rental income
- $23,955
- − Mortgage interest
- −$17,673
- − Property taxes
- −$4,732
- − Insurance
- −$1,577
- − Repairs & maintenance
- −$1,916
- − Management
- −$1,916
- − Depreciation
- −$9,178
- Taxable loss
- −$13,038
- Est. tax savings @ 24.0%
- +$3,129
- After-tax cash flow
- $-4,110/yr
For passive investors: Depreciation is non-cash, so a rental often shows a tax loss while cash-flowing — sheltering income. Rental losses are passive: they offset passive income freely, and up to $25,000/yr can offset ordinary (W-2) income if you actively participate and your MAGI is under $100k (phasing out to $0 by $150k); unused losses carry forward. On sale, claimed depreciation is recaptured at up to 25%, and gains may owe capital-gains tax (a 1031 exchange can defer both). Figures are a year-1 estimate at your 24.0% rate — not tax advice; consult a CPA.
Schools (NCES district)
- District
- New Braunfels ISD
- NCES district ID
- 4832370
- Math proficiency
- 47% ▼ -10.00%
- Reading proficiency
- 53% ▼ -2.00%
- Median HH income
- $60,945
- Composite
- 43.81/100
- National rank
- #2931
- State rank
- #157 of 826 in TX
Livability — New Braunfels
- Score
- 83/100
- State rank
- #9
- US rank
- #925
Category grades
Schools grade is shown separately in the Schools card above.
Census & demographics
- Census place
- New Braunfels, TX
- County
- Comal County · 206,262 people
- City population
- 144,962
- Metro
- San Antonio-New Braunfels, TX
- Population (ZIP)
- 104,009
- Household income
- $83,064
- Rent vs Own
- Severe rent burden
- 2912.0
Population outlook (Comal County) Hauer SSP2
- Today (2025)
- 175,637 people
- By 2030
- 199,911 · +13.8%
- By 2040
- 249,436 · +42.0%
- By 2050
- 299,430 · +70.5%
- By 2075
- 423,857 · +141.3%
- By 2100
- 512,048 · +191.5%
Race, ethnicity, and origin ACS 2023
- Neighborhood character
- Majority White (58%)
- Race & ethnicity
- White 58% Hispanic / Latino 37% Two or more races 19% Black 2%
- Hispanic origin (detail)
- Mexican 32%
- Common ancestry
- Romanian 2% Lithuanian 2% Slovak 2%
- Foreign-born
- 7% · Canada
- Languages at home
- 78% English-only · Spanish 20% German/W. Germanic 1%
Political lean MEDSL · Comal
- 2024 margin
- Solid R (+45.5) · D 26.8% · R 72.2%
- 2008→2024 swing
- +1.9pp toward D · 2008: -47.4pp · 2024: -45.5pp
- All cycles
- 2024: R+45.5 2020: R+42.7 2016: R+50.1 2012: R+54.1 2008: R+47.4
Not yet ingested
- Civics
- —
Market trends
- HPI YoY
- ▼ -190.61%
- Current HPI
- 173.7128
- Rent YoY
- ▼ -1.97%
- Metro
- San Antonio-New Braunfels, TX
- State GDP YoY
- ▲ 3.95%
- F500 in state
- 110
Industry mix (Fortune 500 HQ in TX)
| Industry | F500 HQs | Revenue |
|---|---|---|
| Energy | 16 | $1,198B |
|
||
| Technology | 5 | $198B |
|
||
| Engineering / Construction | 4 | $72B |
|
||
| Energy Services | 3 | $60B |
|
||
| Utilities | 3 | $41B |
|
||
| Healthcare | 2 | $330B |
|
||
Cash-flow waterfall
monthlySold comps — $/sqft
last 12 mo · ≤1 miLoading sold comps…