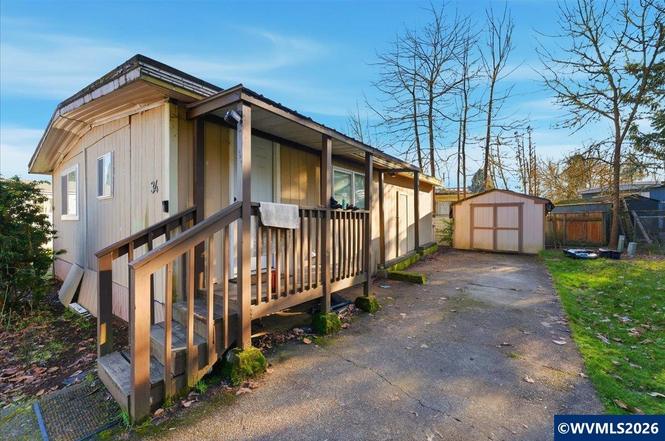
2010 SE 3rd St #34 · Corvallis, OR
Flood risk 4/10 · Minor
- FEMA flood zone
- X (shaded)
- Chance of flooding over 30 yrs
- 0.24%
- Est. flood insurance / yr
- $507 – $1,088
Fire risk 3/10 · Minor
- Est. fire insurance / yr
- $498 – $926
Heat risk 4/10 · Minor
- Hot days now (above 91°F)
- 7 days/yr
- Hot days in 30 yrs
- 14 days/yr
Wind risk 1/10 · Minimal
- Chance of severe wind over 30 yrs
- —
Air-quality risk 9/10 · Severe
- Unhealthy air days now
- 12 days/yr
- Unhealthy air days in 30 yrs
- 12 days/yr
Risk factors via First Street. Map © Google.
Why this score? — see what drove the B grade
The composite is a weighted blend of 9 inputs, each scored 0–100. Each bar is that input's sub-score; the figure is the points it added to the 100-point composite (weight × sub-score).
- Cash flow +30.0/30.0
- 1% rule +10.0/10.0
- DSCR +10.0/10.0
- ARV discount +9.8/15.0
- Schools +4.9/10.0
- Livability +4.1/5.0
- Rent growth +3.2/5.0
- Condition / age +2.2/5.0
- Appreciation +0.0/10.0
$69,000
🖨 Deal sheet (PDF) 📄 Offer letter ✓ Due diligence
Listing remarks
Solid manufactured home in a fantastic all age park! Located in desirable location. All new appliances, countertops, and flooring throughout. Park rent is $525 per month and that includes garbage and sewer. Manufactured home financed available. Must see to appreciate!
Key facts
- Manufactured home
- New flooring
- Desirable location
Tags
Property features AI
Finance
- Other: Square footage source: County
- Financial info: Park rent $525 per month (includes sewer and garbage); Home warranty negotiable; Manufactured home financing available
Exterior
- Parking: Carport; 1-car garage
- Utilities: City water; City sewer; Electric water heater; Park rent includes sewer and garbage
- Home design: Double wide manufactured home
- Construction: Built in 1974; Statler manufactured home (Serial: 61NS3624F2S3); Located in Sunrise Mobile park (non-adult park)
- Exterior features: Shed; Cul-de-sac lot
Interior
- Bedrooms: Bonus room: Breakfast room/nook; Dining area (combination)
- Flooring: Carpet; Vinyl; Laminate
- Heating & cooling: Electric heating; Central air conditioning
- Interior features: High-speed communication available; No garbage disposal
Neighborhood map
What this means for you Summary
Snapshot
- This is a 2-bed/1.0-bath manufactured listed at $69k. Condition is rated fair.
Deal economics
- At list price, monthly cash flow is $851 ($10k/yr) — positive.
- The deal already cash-flows at list — no discount required.
- Meets the 1% rule at list price ($2k rent vs $69k).
- Recommended offer: $61k (12.0% below list) — sets the bar for market timing.
- Cap rate 21.1% vs local median 2.6% in Corvallis — top-decile yield for the area; either an underpriced asset or a hidden risk that comps aren't pricing in. Stress-test before assuming the spread holds.
Location & tenants
- Location reads 82/100 on livability (#45 in OR, #1,113 nationally) — a professional / high-income tenant draw. Strengths: amenities A+, commute A+, health & safety A+; Watch: cost of living F.
- Corvallis SD 509J (urban): math 49% / reading 62% proficiency, ranked #15 of 183 in OR (top 8%) — acceptable for families but not a draw, mixed tenant base, ~2y average lease.
- Zoned schools: Lincoln Elementary School (331 students, 45% FRL); Corvallis High School (1,284 students, 40% FRL).
- Market conditions: Rents rising (+2.6%/yr); 87 active listings in the ZIP; 22 comparable units currently listed for rent nearby; rentals lingering (median 45d on market — plan ~5-8 weeks vacancy on turnover, expect pricing pressure); 100% of comp listings sitting > 30 days — soft ceiling on asking rent; 116 units permitted in Benton County in 2024 (0 in 5+ unit buildings).
- This rent runs 31% of the median local income ($65k/yr) — at the standard rent-burdened threshold; future hikes will face affordability resistance.
Forward outlook
- Local home prices are declining (-3.0%/yr); year-one equity from $477 of loan paydown is wiped out by about $2k of value loss. Plan a longer hold.
- Benton County population projected at +23% by 2050 — long-run rental-demand tailwind backs the buy-and-hold thesis.
- At projected returns (-3.0% appreciation + 2.6% rent growth), your $19k cash investment doubles in ~3 years — after that, you're playing with house money.
Negotiation context
- It's been on market 130 days — a 12% lower offer ($61k) is reasonable based on typical stale-listing flexibility.
Questions for the listing agent
- It's been on market 130 days. Have you received any prior offers? Is the seller open to a 12% concession, seller financing, or rate buy-down credit?
- Have any recent inspections been done? Can we get a copy of the seller's disclosures and any deferred-maintenance estimates?
- Built in 1974 — when were the roof, HVAC, electrical panel, plumbing, and water heater last replaced?
- Why hasn't it sold? Are there any deal-killer items the seller is aware of (foundation, flood, title, zoning, code violations)?
- Is there a deadline driving the sale (1031 exchange, divorce, estate, relocation)? That informs how much negotiation room exists.
- Schools are A-rated — typically a magnet for longer-tenancy family renters. What's the average tenant stay here, and is there a school-zone premium baked into asking?
- What's the average days-on-market for RENTAL listings here right now (not sales)? A rising rental-DOM trend means longer vacancies and softer asking-rent achievability than the comps imply.
- What's the recent tenant-quality profile in this submarket — average credit score on applications, eviction rate, late-payment / NSF rate, and stable-employment percentage? A property-management company in the area should have these aggregated.
- How much new for-sale + rental construction is in the pipeline within 1–3 miles? Heavy new supply typically softens prices + rents 12–24 months out; constrained supply supports both.
Investment metrics
- 1% rule
- 2.44% ✓
- Cap rate
- 21.09%
- Cash-on-cash
- 52.83%
- DSCR
- 3.35
- GRM
- 3.4
CMA / ARV
- ARV (on-the-fly)
- $72,800
- Comps found
- 2
Show comp detail 2 sales within ~0.75 mi
| Address | Dist | Beds/Ba | Sqft | Sold | Price | $/sf | Match |
|---|---|---|---|---|---|---|---|
| 2010 SW 3rd St #10 | 0.08mi | 2/1.0 | 728 (-9%) | 11mo | $65,000 | $89 | 72 |
| 2010 SW 3rd St #19 | 0.08mi | 3/2.0 (+1) | 756 (-6%) | 14mo | $69,000 | $91 | 66 |
Match score weights: distance 35% · size 25% · config 20% · recency 20%. Top-matched comps best support the ARV.
Projected returns pro-forma
-3.0% appreciation · 2.63% rent growth · sell at horizon
- IRR
- 50.4%
- Equity multiple
- 3.19×
- Total profit
- $42,397
- Equity at exit
- $10,288
- IRR
- 55.7%
- Equity multiple
- 6.40×
- Total profit
- $104,243
- Equity at exit
- $5,966
Cash invested: $19,320 (down + closing). Projections, not guarantees.
Landlord ↔ Tenant lean methodology
- Overall (STATE)
- 28 Tenant-Leaning
- State Oregon
- 28 Tenant-Leaning · D+6
- County
- — inherits STATE
- City
- — inherits STATE
ZIP-level market 97333
- Rents YoY
- 2.6%
- Active inventory
- 87
- Price-to-rent
- 3.4×
Monthly cashflow live
- Estimated rent
- $1,680 high interval (Pro) →
- Mortgage (P&I)
- −$362
- Tax est. 1.5%
- −$86 /mo · $1,035/yr
- Insurance
- −$29
- HOA
- −$0
- Vacancy / Maint / Mgmt
- −$353
- Net cashflow
- $851
Break-even live
Sensitivity live
| Price | -10% $898 | -5% $874 | +0% $851 | +5% $827 | +10% $803 |
|---|---|---|---|---|---|
| Rent | -10% $718 | -5% $784 | +0% $851 | +5% $917 | +10% $983 |
| Rate | -1.0pp $885 | -0.5pp $868 | base $851 | +0.5pp $833 | +1.0pp $815 |
UW: 25.0% down · 7.5% · 30yr · 1.5% tax · 5.0% vac · 8.0% maint · 8.0% mgmt
Financing live
Cash to close
- Down payment
- $17,250
- Closing costs
- $2,070
- Reserves months
- —
- Total cash needed
- —
Loan-product check · same deal, 3 products live
Conventional
25% down · 7.5% · 30yr
- Down + closing
- —
- Monthly P&I
- —
- Monthly cashflow
- —
- DSCR
- —
- Eligible?
- —
Personal DTI + credit; lowest rate.
DSCR
20% down · 8.5% · 30yr
- Down + closing
- —
- Monthly P&I
- —
- Monthly cashflow
- —
- DSCR
- —
- Eligible?
- —
No personal income docs; deal must DSCR.
Hard money
10% down · 12.0% · 12mo
- Down + closing
- —
- Monthly P&I
- —
- Monthly cashflow
- —
- DSCR
- —
- Eligible?
- —
Short-term bridge; refi at stabilization.
Rent comps 22 comps
| Address | Beds | Baths | Sqft | Rent | $/sqft | DOM | Units | Dist |
|---|---|---|---|---|---|---|---|---|
| 100 SE Viewmont Ave Unit 110-A Corvallis, OR | 2.0 | 1.5 | 1080 | $1,550 | $1.44 | 44d | 1 | 0.17mi |
| 350 SE Lilly Ave Apt 3 Corvallis, OR | 1.0 | 1.0 | 600 | $1,395 | $2.33 | 44d | 1 | 0.21mi |
| 325 SE Lilly Ave Unit A Corvallis, OR | 2.0 | 1.5 | 856 | $1,525 | $1.78 | 44d | 1 | 0.22mi |
| 445 SW Tunison Ave Unit 445-13 Corvallis, OR | 2.0 | 1.0 | 760 | $1,395 | $1.84 | 44d | 1 | 0.26mi |
| 2000 SE Bethel St Corvallis, OR | 3.0 | 1.0 | 937 | $2,325 | $2.48 | 44d | 1 | 0.32mi |
| 2567 SW Pickford St Unit C Corvallis, OR | 2.0 | 1.0 | 800 | $1,295 | $1.62 | 45d | 1 | 0.37mi |
| 2665 SW Pickford St Unit CNV 57 Corvallis, OR | 2.0 | 1.0 | 756 | $1,395 | $1.85 | 45d | 1 | 0.43mi |
| 1750 SE Crystal Lake Dr Unit 1750-E Corvallis, OR | 2.0 | 2.0 | 954 | $1,499 | $1.57 | 44d | 1 | 0.53mi |
| 1680 SE Crystal Lake Dr Unit 1680-E Corvallis, OR | 2.0 | 2.0 | 954 | $1,499 | $1.57 | 44d | 1 | 0.53mi |
| 1300 SW E Ave Apt 322 Corvallis, OR | 1.0 | 1.0 | 650 | $1,195 | $1.84 | 44d | 1 | 0.83mi |
| 1315 SW E Ave Corvallis, OR | 1.0 | 1.0 | 700 | $1,400 | $2.00 | 44d | 1 | 0.86mi |
| 363 SW B Ave Unit 363-01 Corvallis, OR | 1.0 | 1.0 | 650 | $1,295 | $1.99 | 44d | 1 | 0.89mi |
| 975 SW 15th St Corvallis, OR | 1.0–2.0 | 1.0–1.5 | 720 | $1,895 | $2.63 | 44d | 8 | 0.90mi |
| 900 SE Centerpointe Dr Corvallis, OR | 1.0–3.0 | 1.0–2.0 | 952 | $1,662 | $1.74 | 44d | 1 | 1.03mi |
| 2610 SW Western Blvd Unit 10301 Corvallis, OR | 2.0 | 1.0 | 1050 | $1,595 | $1.52 | 44d | 1 | 1.05mi |
| 427 SW 5th St Corvallis, OR | 2.0 | 1.0 | 602 | $1,775 | $2.95 | 44d | 1 | 1.06mi |
| 707 SW 10th St Corvallis, OR | 4.0 | 1.0–3.0 | 1513 | $2,935 | $1.94 | 44d | 14 | 1.07mi |
| 2740 SW Western Blvd Corvallis, OR | 1.0 | 1.0 | 566 | $1,377 | $2.43 | 44d | 1 | 1.07mi |
| 3460 SE Midvale Dr Corvallis, OR | 1.0–3.0 | 1.0–1.5 | 858 | $1,610 | $1.88 | 44d | 1 | 1.10mi |
| 422 SW 9th St Corvallis, OR | 3.0 | 1.0 | 1009 | $2,295 | $2.27 | 44d | 1 | 1.15mi |
| 118 NW Jackson Ave Unit 306 Corvallis, OR | 2.0 | 1.5 | 828 | $2,200 | $2.66 | 44d | 1 | 1.33mi |
| 118 NW Jackson Ave Unit 409 Corvallis, OR | 1.0 | 1.0 | 768 | $2,095 | $2.73 | 44d | 1 | 1.34mi |
Listing history 17 events
-
2026-06-19days on market $69,000 Active 130 DOM
-
2026-06-18days on market $69,000 Active 129 DOM
-
2026-06-17days on market $69,000 Active 128 DOM
-
2026-06-16days on market $69,000 Active 127 DOM
-
2026-06-15days on market $69,000 Active 126 DOM
-
2026-06-14days on market $69,000 Active 124 DOM
-
2026-06-10days on market $69,000 Active 121 DOM
-
2026-06-09days on market $69,000 Active 120 DOM
-
2026-06-08days on market $69,000 Active 119 DOM
-
2026-06-07days on market $69,000 Active 118 DOM
-
2026-06-05days on market $69,000 Active 115 DOM
-
2026-06-03days on market $69,000 Active 114 DOM
-
2026-06-02days on market $69,000 Active 113 DOM
-
2026-06-01days on market $69,000 Active 112 DOM
-
2026-05-31days on market $69,000 Active 111 DOM
-
2026-05-30days on market $69,000 Active 110 DOM
-
2026-02-10$69,000 Active
ⓘ Source: listings_history table (triggers on properties + properties_extension) + one-shot
backfill from property_details.listing_events for pre-trigger history.
Climate risk First Street
- Flood 4/10 Moderate FEMA zone X (shaded) · 24% chance over 30 yrs
- Wildfire 3/10 Moderate
- Heat 4/10 Moderate 7 d/yr ≥91°F today · 14 d/yr by 30 yrs out
- Wind 1/10 Low
- Air quality 9/10 Extreme 12 unhealthy d/yr today · 12 by 30 yrs out
Nearby sold comps map
Loading sold comps map…
Walkable amenities ~0.75 mi
Loading nearby amenities…
Taxation est. · year 1
- Rental income
- $20,164
- − Mortgage interest
- −$3,865
- − Property taxes
- −$1,035
- − Insurance
- −$345
- − Repairs & maintenance
- −$1,613
- − Management
- −$1,613
- − Depreciation
- −$2,007
- Taxable income
- $9,685
- Est. tax owed @ 24.0%
- −$2,324
- After-tax cash flow
- $7,883/yr
For passive investors: Depreciation is non-cash, so a rental often shows a tax loss while cash-flowing — sheltering income. Rental losses are passive: they offset passive income freely, and up to $25,000/yr can offset ordinary (W-2) income if you actively participate and your MAGI is under $100k (phasing out to $0 by $150k); unused losses carry forward. On sale, claimed depreciation is recaptured at up to 25%, and gains may owe capital-gains tax (a 1031 exchange can defer both). Figures are a year-1 estimate at your 24.0% rate — not tax advice; consult a CPA.
Condition & rehab AI · 13 photos
This manufactured home requires moderate repairs and maintenance, including painting and landscaping, to improve its condition and value.
Repairs flagged
- Major roof — Significant wear and tear
- Major exterior siding — Worn and peeling
- Major landscaping — Sparse and unkempt
Value-add opportunities
- Both Paint exterior siding — Enhances curb appeal and value
- Both Paint interior walls — Improves interior appearance and value
- Both Landscaping and yard maintenance — Enhances curb appeal and value
Renovation cost estimate screening
| Repair item | Severity | Est. cost |
|---|---|---|
| roof · Significant wear and tear | Major | $15,000–50,000 |
| exterior siding · Worn and peeling | Major | $15,000–50,000 |
| landscaping · Sparse and unkempt | Major | $15,000–50,000 |
| Total estimated repair cost · 3 items | $45,000–150,000 |
Value-add ROI direction
- Both Paint exterior siding — Enhances curb appeal and value ↑
- Both Paint interior walls — Improves interior appearance and value ↑
- Both Landscaping and yard maintenance — Enhances curb appeal and value ↑
ⓘ Cost ranges are severity-bucket heuristics (US national rule-of-thumb). Get contractor quotes + a written scope before underwriting a rehab budget.
Schools (NCES district)
- District
- Corvallis SD 509J
- NCES district ID
- 4103480
- Math proficiency
- 49% ▼ -3.00%
- Reading proficiency
- 62% ▼ -1.00%
- Median HH income
- $44,820
- Composite
- 48.62/100
- National rank
- #4584
- State rank
- #15 of 183 in OR
Livability — Corvallis
- Score
- 82/100
- State rank
- #45
- US rank
- #1113
Category grades
Schools grade is shown separately in the Schools card above.
Census & demographics
- Census place
- Corvallis, OR
- County
- Benton County · 98,484 people
- City population
- 67,812
- Metro
- Corvallis, OR
- Population (ZIP)
- 23,934
- Household income
- $65,191
- Rent vs Own
- Severe rent burden
- 2038.0
Population outlook (Benton County) Hauer SSP2
- Today (2025)
- 96,963 people
- By 2030
- 101,658 · +4.8%
- By 2040
- 110,157 · +13.6%
- By 2050
- 119,275 · +23.0%
- By 2075
- 145,172 · +49.7%
- By 2100
- 165,349 · +70.5%
Race, ethnicity, and origin ACS 2023
- Neighborhood character
- Predominantly White (78%)
- Race & ethnicity
- White 78% Hispanic / Latino 9% Two or more races 8% Asian 7%
- Hispanic origin (detail)
- Mexican 7%
- Common ancestry
- Italian 5% Slovak 4% Portuguese 3%
- Foreign-born
- 10% · China, Canada
- Languages at home
- 87% English-only · Spanish 5% Chinese 4% Other Indo-European 2%
Political lean MEDSL · Benton
- 2024 margin
- Solid D (+39.6) · D 68.1% · R 28.5% · Other 3.5%
- 2008→2024 swing
- +8.1pp toward D · 2008: 31.5pp · 2024: 39.6pp
- All cycles
- 2024: D+39.6 2020: D+39.7 2016: D+33.8 2012: D+28.8 2008: D+31.5
Not yet ingested
- Civics
- —
Market trends
- HPI YoY
- ▼ -376.98%
- Current HPI
- 309.2734
- Rent YoY
- ▲ 2.63%
- Metro
- Corvallis, OR
- State GDP YoY
- ▲ 2.05%
- F500 in state
- 2
Industry mix (Fortune 500 HQ in OR)
| Industry | F500 HQs | Revenue |
|---|---|---|
| Consumer Goods | 1 | $51B |
|
||
Price history
1 event — show timeline
- 2026-02-10 Listed $69,000 WVMLS
Cash-flow waterfall
monthlySold comps — $/sqft
last 12 mo · ≤1 miLoading sold comps…