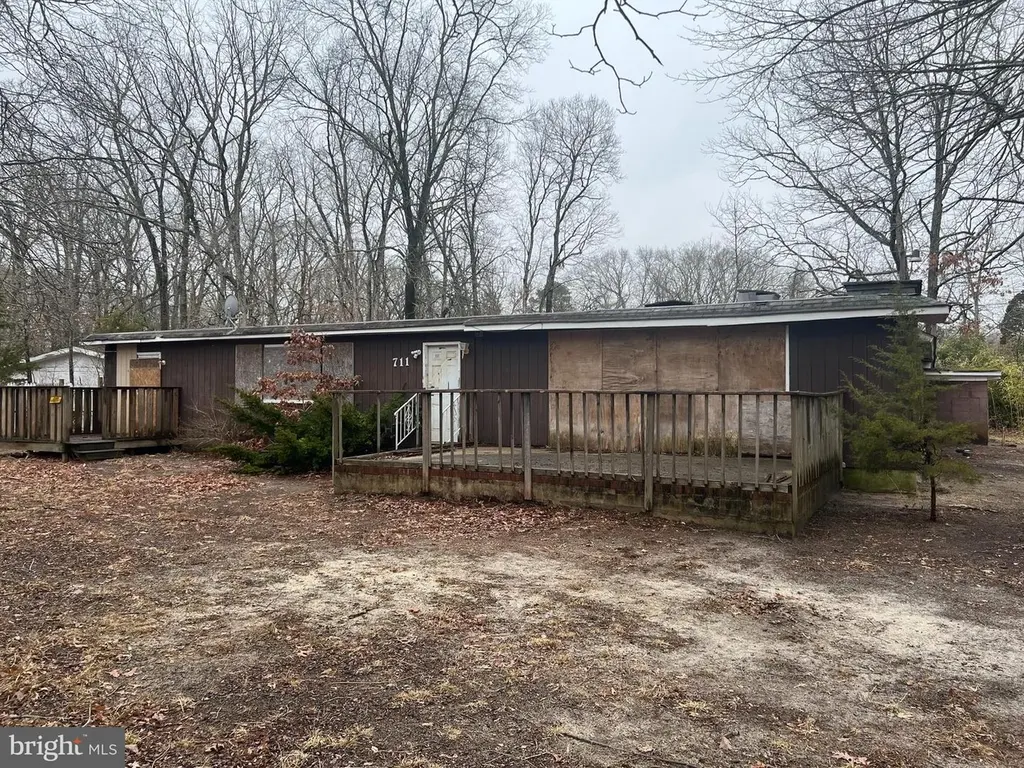
711 Woodland Dr · Millville, NJ
Flood risk 7/10 · Major
- FEMA flood zone
- X (unshaded)
- Chance of flooding over 30 yrs
- 0.99%
- Est. flood insurance / yr
- $507 – $1,088
Fire risk 4/10 · Minor
- Est. fire insurance / yr
- $526 – $976
Heat risk 7/10 · Major
- Hot days now (above 102°F)
- 7 days/yr
- Hot days in 30 yrs
- 15 days/yr
Wind risk 8/10 · Major
- Chance of severe wind over 30 yrs
- 80.0%
Air-quality risk 3/10 · Minor
- Unhealthy air days now
- 3 days/yr
- Unhealthy air days in 30 yrs
- 5 days/yr
Risk factors via First Street. Map © Google.
Why this score? — see what drove the B- grade
The composite is a weighted blend of 9 inputs, each scored 0–100. Each bar is that input's sub-score; the figure is the points it added to the 100-point composite (weight × sub-score).
- Cash flow +30.0/30.0
- 1% rule +10.0/10.0
- DSCR +10.0/10.0
- ARV discount +7.5/15.0
- Livability +3.2/5.0
- Rent growth +3.0/5.0
- Condition / age +2.5/5.0
- Schools +1.5/10.0
- Appreciation +0.0/10.0
$119,900
🖨 Deal sheet 📄 Offer letter ✓ Due diligence
Listing remarks MLS
Back to active due to buyer financing. Investors, flippers, and handymen/women looking for their next money making investment, you found it. Rare side by side rancher duplex with approx. 2,300+ sq ft of living space. Both units feature 2BR, 1BA. Tucked away in a quiet neighborhood on the outskirts of Millville, sitting on a comfortable . 60 acre lot. A true diamond in the rough waiting to be brought back to life and maxed out to it's true CASH COW potential. The back portion of the building has already been gutted out and redone with newer studs, electric, and some rough-in plumbing. You won't find another property with this much potential at this low of a price any time soon! Cash or rehab loan ONLY. Property does not qualify for traditional FHA or conventional financing. Property is being sold strictly AS-IS. Seller and Seller’s Broker make no representations or warranties, express or implied, regarding the condition of the property, systems, structure, zoning, permitted uses, square footage, tax information, or code compliance. All information provided is deemed reliable but not guaranteed. Buyer is responsible for conducting all due diligence, inspections, and independent verification of condition, zoning, permits, and intended use prior to closing. Seller will make no repairs or credits.
Key facts
- Newer electric
- Newer studs
- Quiet neighborhood
Tags
Neighborhood map
What this means for you Summary
Snapshot
- This is a 4-bed/3.0-bath single-family listed at $120k.
Deal economics
- At list price, monthly cash flow is $772 ($9k/yr) — positive.
- The deal already cash-flows at list — no discount required.
- Meets the 1% rule at list price ($2k rent vs $120k).
- Recommended offer: $113k (6.0% below list) — sets the bar for market timing.
- Cap rate 14.7% vs local median 4.2% in Millville — top-decile yield for the area; either an underpriced asset or a hidden risk that comps aren't pricing in. Stress-test before assuming the spread holds.
Location & tenants
- Location reads 63/100 on livability (#431 in NJ) — a middle-class / working-renter tenant base. Strengths: housing A+, health & safety B+; Watch: schools F, crime F, amenities F.
- Millville School District (suburban): math 6% / reading 28% proficiency, ranked #447 of 472 in NJ (top 95%) — low school quality limits family demand, transient renter base, plan for 1-2y turnover; 60% free/reduced lunch — lower-income household profile, screen leases tightly.
- Market conditions: Rents rising (+1.9%/yr); 296 active listings in the ZIP; 216 units permitted in Cumberland County in 2024 (73 in 5+ unit buildings).
- This rent runs 42% of the median local income ($67k/yr) — at the standard rent-burdened threshold; future hikes will face affordability resistance.
Forward outlook
- Local home prices are declining (-3.0%/yr); year-one equity from $829 of loan paydown is wiped out by about $4k of value loss. Plan a longer hold.
- Cumberland County population projected to shrink 7% by 2050 — rents likely to lag national; underwrite the cash flow, not the appreciation.
- At projected returns (-3.0% appreciation + 1.9% rent growth), your $34k cash investment doubles in ~5 years — after that, you're playing with house money.
Negotiation context
- It's been on market 87 days — a 6% lower offer ($113k) is reasonable based on typical stale-listing flexibility.
- 10 sale attempts since 28y ago with the ask held roughly flat each time — persistent listings suggest the price (not the market) is what's stuck; bring a comps-based counter.
- Current owner paid $22k; list at $120k implies a 435% gain — meaningful room to come down on a strong offer.
Risks & watch-outs
- Watch-outs: property tax is 3.3% of price; flood insurance adds $66/mo; built in 1945 — expect roof / HVAC / electrical / plumbing capex.
- Climate carrying-cost: major flood risk; severe wind risk, 80% chance of damaging wind over 30y; extreme-heat days projected 7→15/yr by 2055 (HVAC capex compounding) — expect insurance premiums to compound above CPI over the hold.
Questions for the listing agent
- It's been on market 87 days. Have you received any prior offers? Is the seller open to a 6% concession, seller financing, or rate buy-down credit?
- Built in 1945 — when were the roof, HVAC, electrical panel, plumbing, and water heater last replaced?
- Property tax is high relative to price — has the assessment been appealed recently, and will the sale trigger a re-assessment?
- What's the actual annual flood-insurance premium (NFIP or private), and is the property in a SFHA with mandatory coverage?
- Why hasn't it sold? Are there any deal-killer items the seller is aware of (foundation, flood, title, zoning, code violations)?
- Is there a deadline driving the sale (1031 exchange, divorce, estate, relocation)? That informs how much negotiation room exists.
- Schools are F-rated, which usually means shorter tenancies and higher turnover. Who's the typical renter profile here, and what's been the actual vacancy rate?
- Crime grade is F in this area — have there been break-ins, vandalism, or insurance claims at this property in the last 3 years? What carrier currently insures it and at what premium?
- What's the average days-on-market for RENTAL listings here right now (not sales)? A rising rental-DOM trend means longer vacancies and softer asking-rent achievability than the comps imply.
- What's the recent tenant-quality profile in this submarket — average credit score on applications, eviction rate, late-payment / NSF rate, and stable-employment percentage? A property-management company in the area should have these aggregated.
- How much new for-sale + rental construction is in the pipeline within 1–3 miles? Heavy new supply typically softens prices + rents 12–24 months out; constrained supply supports both.
Investment metrics
- 1% rule
- 1.95% ✓
- Cap rate
- 14.69%
- Cash-on-cash
- 29.98%
- DSCR
- 2.33
- GRM
- 4.3
CMA / ARV
- ARV (on-the-fly)
- $341,288
- Comps found
- 1
Show comp detail 1 sale within ~0.75 mi
| Address | Dist | Beds/Ba | Sqft | Sold | Price | $/sf | Match |
|---|---|---|---|---|---|---|---|
| 12 Deborah Dr | 0.44mi | 3/2.0 (-1) | 2,432 (+6%) | 6mo | $360,000 | $148 | 56 |
Match score weights: distance 35% · size 25% · config 20% · recency 20%. Top-matched comps best support the ARV.
Projected returns pro-forma
-3.0% appreciation · 1.94% rent growth · sell at horizon
- IRR
- 20.4%
- Equity multiple
- 1.82×
- Total profit
- $27,480
- Equity at exit
- $17,877
- IRR
- 27.8%
- Equity multiple
- 3.33×
- Total profit
- $78,120
- Equity at exit
- $10,367
Cash invested: $33,572 (down + closing). Projections, not guarantees.
Landlord ↔ Tenant lean methodology
- Overall (STATE)
- 21 Tenant-Leaning
- State New Jersey
- 21 Tenant-Leaning · D+6
- County
- — inherits STATE
- City
- — inherits STATE
ZIP-level market 08332
- Home prices YoY
- -28.9%
- Rents YoY
- 1.9%
- Active inventory
- 296
- Price-to-rent
- 4.3×
Monthly cashflow live
- Estimated rent
- $2,335 medium interval (Pro) →
- Mortgage (P&I)
- −$629
- Tax from tax record
- −$328 /mo · $3,930/yr
- Insurance
- −$50
- Flood insurance flood zone
- −$66 /mo · $798/yr
- HOA
- −$0
- Vacancy / Maint / Mgmt
- −$490
- Net cashflow
- $772
Break-even live
UW: 25.0% down · 7.5% · 30yr · 1.5% tax · 5.0% vac · 8.0% maint · 8.0% mgmt
Financing live
Cash to close
- Down payment
- $29,975
- Closing costs
- $3,597
- Reserves months
- —
- Total cash needed
- —
Loan-product check · same deal, 3 products live
Conventional
25% down · 7.5% · 30yr
- Down + closing
- —
- Monthly P&I
- —
- Monthly cashflow
- —
- DSCR
- —
- Eligible?
- —
Personal DTI + credit; lowest rate.
DSCR
20% down · 8.5% · 30yr
- Down + closing
- —
- Monthly P&I
- —
- Monthly cashflow
- —
- DSCR
- —
- Eligible?
- —
No personal income docs; deal must DSCR.
Hard money
10% down · 12.0% · 12mo
- Down + closing
- —
- Monthly P&I
- —
- Monthly cashflow
- —
- DSCR
- —
- Eligible?
- —
Short-term bridge; refi at stabilization.
Listing history 43 events
-
2026-06-19days on market $119,900 Active 87 DOM
-
2026-06-18days on market $119,900 Active 86 DOM
-
2026-06-17days on market $119,900 Active 85 DOM
-
2026-06-16days on market $119,900 Active 84 DOM
-
2026-06-15days on market $119,900 Active 83 DOM
-
2026-06-14days on market $119,900 Active 81 DOM
-
2026-06-13days on market $119,900 Active 80 DOM
-
2026-06-10days on market $119,900 Active 78 DOM
-
2026-06-09days on market $119,900 Active 77 DOM
-
2026-06-08days on market $119,900 Active 76 DOM
-
2026-06-07days on market $119,900 Active 75 DOM
-
2026-06-02days on market $119,900 Active 70 DOM
-
2026-06-01days on market $119,900 Active 69 DOM
-
2026-05-31days on market $119,900 Active 68 DOM
-
2026-05-30days on market $119,900 Active 67 DOM
-
2026-04-09status Active 1320-char remark
Show marketing remark (1320 chars)
Back to active due to buyer financing. Investors, flippers, and handymen/women looking for their next money making investment, you found it. Rare side by side rancher duplex with approx. 2,300+ sq ft of living space. Both units feature 2BR, 1BA. Tucked away in a quiet neighborhood on the outskirts of Millville, sitting on a comfortable . 60 acre lot. A true diamond in the rough waiting to be brought back to life and maxed out to it's true CASH COW potential. The back portion of the building has already been gutted out and redone with newer studs, electric, and some rough-in plumbing. You won't find another property with this much potential at this low of a price any time soon! Cash or rehab loan ONLY. Property does not qualify for traditional FHA or conventional financing. Property is being sold strictly AS-IS. Seller and Seller’s Broker make no representations or warranties, express or implied, regarding the condition of the property, systems, structure, zoning, permitted uses, square footage, tax information, or code compliance. All information provided is deemed reliable but not guaranteed. Buyer is responsible for conducting all due diligence, inspections, and independent verification of condition, zoning, permits, and intended use prior to closing. Seller will make no repairs or credits.
-
2026-03-20historical Active Under Contract 1320-char remark
Show marketing remark (1320 chars)
Back to active due to buyer financing. Investors, flippers, and handymen/women looking for their next money making investment, you found it. Rare side by side rancher duplex with approx. 2,300+ sq ft of living space. Both units feature 2BR, 1BA. Tucked away in a quiet neighborhood on the outskirts of Millville, sitting on a comfortable . 60 acre lot. A true diamond in the rough waiting to be brought back to life and maxed out to it's true CASH COW potential. The back portion of the building has already been gutted out and redone with newer studs, electric, and some rough-in plumbing. You won't find another property with this much potential at this low of a price any time soon! Cash or rehab loan ONLY. Property does not qualify for traditional FHA or conventional financing. Property is being sold strictly AS-IS. Seller and Seller’s Broker make no representations or warranties, express or implied, regarding the condition of the property, systems, structure, zoning, permitted uses, square footage, tax information, or code compliance. All information provided is deemed reliable but not guaranteed. Buyer is responsible for conducting all due diligence, inspections, and independent verification of condition, zoning, permits, and intended use prior to closing. Seller will make no repairs or credits.
-
2026-03-04$125,000 Active 1320-char remark
Show marketing remark (1320 chars)
Back to active due to buyer financing. Investors, flippers, and handymen/women looking for their next money making investment, you found it. Rare side by side rancher duplex with approx. 2,300+ sq ft of living space. Both units feature 2BR, 1BA. Tucked away in a quiet neighborhood on the outskirts of Millville, sitting on a comfortable . 60 acre lot. A true diamond in the rough waiting to be brought back to life and maxed out to it's true CASH COW potential. The back portion of the building has already been gutted out and redone with newer studs, electric, and some rough-in plumbing. You won't find another property with this much potential at this low of a price any time soon! Cash or rehab loan ONLY. Property does not qualify for traditional FHA or conventional financing. Property is being sold strictly AS-IS. Seller and Seller’s Broker make no representations or warranties, express or implied, regarding the condition of the property, systems, structure, zoning, permitted uses, square footage, tax information, or code compliance. All information provided is deemed reliable but not guaranteed. Buyer is responsible for conducting all due diligence, inspections, and independent verification of condition, zoning, permits, and intended use prior to closing. Seller will make no repairs or credits.
-
2022-08-10historical
-
2022-08-04historical
-
2022-02-11$109,000 Active
-
2022-02-10$109,000 Active
-
2019-03-06historical
-
2019-01-25price $7,500
-
2019-01-22price $15,000
-
2019-01-07$17,900 Active
-
2018-12-04historical
-
2018-08-30price $19,900
-
2018-06-04$24,900 Active
-
2018-05-27historical
-
2018-02-28price $26,000
-
2017-05-30soldstatus $22,430 Sold
-
2017-05-26$31,000 Active
-
2017-05-06price $32,100
-
2017-04-10historical Under Contract
-
2017-03-24$37,100 Active
-
2002-08-22soldstatus $28,507
-
2002-07-26historical
-
2002-07-18$30,000
-
1999-09-16soldstatus $79,500
-
1999-09-15soldstatus $79,500
-
1999-03-29historical
-
1998-01-20$78,500
ⓘ Source: listings_history table (triggers on properties + properties_extension) + one-shot
backfill from property_details.listing_events for pre-trigger history.
Tax reassessment forecast NJ · Partial reset (capped growth)
- Current annual tax
- $3,930 · $328/mo
- Projected year-2 tax
- $3,930 · $328/mo
- Expected delta
- $0/yr ($0/mo · 0.0%)
ⓘ Screening estimate from a state-policy table — verify with the county assessor before closing.
Climate risk First Street
- Flood 7/10 Severe FEMA zone X (unshaded) · 99% chance over 30 yrs
- Wildfire 4/10 Moderate
- Heat 7/10 Severe 7 d/yr ≥102°F today · 15 d/yr by 30 yrs out
- Wind 8/10 Severe 80% chance of damaging wind over 30 yrs
- Air quality 3/10 Moderate 3 unhealthy d/yr today · 5 by 30 yrs out
Nearby sold comps map
Loading sold comps map…
Walkable amenities ~0.75 mi
Loading nearby amenities…
Taxation est. · year 1
- Rental income
- $28,026
- − Mortgage interest
- −$6,716
- − Property taxes
- −$3,930
- − Insurance
- −$1,397
- − Repairs & maintenance
- −$2,242
- − Management
- −$2,242
- − Depreciation
- −$3,488
- Taxable income
- $8,010
- Est. tax owed @ 24.0%
- −$1,922
- After-tax cash flow
- $7,345/yr
For passive investors: Depreciation is non-cash, so a rental often shows a tax loss while cash-flowing — sheltering income. Rental losses are passive: they offset passive income freely, and up to $25,000/yr can offset ordinary (W-2) income if you actively participate and your MAGI is under $100k (phasing out to $0 by $150k); unused losses carry forward. On sale, claimed depreciation is recaptured at up to 25%, and gains may owe capital-gains tax (a 1031 exchange can defer both). Figures are a year-1 estimate at your 24.0% rate — not tax advice; consult a CPA.
Schools (NCES district)
- District
- Millville School District
- NCES district ID
- 3410320
- Math proficiency
- 6% ▼ -11.00%
- Reading proficiency
- 28% ▲ 1.00%
- Median HH income
- $48,851
- Composite
- 15.23/100
- National rank
- #9338
- State rank
- #447 of 472 in NJ
Livability — Millville
- Score
- 63/100
- State rank
- #431
- US rank
- #15561
Category grades
Schools grade is shown separately in the Schools card above.
Census & demographics
- Census place
- Millville, NJ
- County
- Cumberland County · 80,266 people
- City population
- 35,228
- Metro
- Vineland-Bridgeton, NJ
- Population (ZIP)
- 35,228
- Household income
- $67,496
- Rent vs Own
- Severe rent burden
- 1761.0
Population outlook (Cumberland County) Hauer SSP2
- Today (2025)
- 152,743 people
- By 2030
- 150,373 · -1.6%
- By 2040
- 146,881 · -3.8%
- By 2050
- 142,653 · -6.6%
- By 2075
- 129,468 · -15.2%
- By 2100
- 107,456 · -29.6%
Race, ethnicity, and origin ACS 2023
- Neighborhood character
- Diverse neighborhood (Simpson 0.60)
- Race & ethnicity
- White 59% Hispanic / Latino 17% Black 15% Two or more races 11% Asian 2%
- Hispanic origin (detail)
- Mexican 4% Puerto Rican 10%
- Common ancestry
- Romanian 4% Lithuanian 2% Slovak 1%
- Foreign-born
- 7% · Canada
- Languages at home
- 85% English-only · Spanish 11% Other Indo-European 1% Other Asian/Pacific 1%
Political lean MEDSL · Cumberland
- 2024 margin
- Toss-up / Even · D 47.6% · R 51.3% · Other 1.1%
- 2008→2024 swing
- -25.4pp toward R · 2008: 21.6pp · 2024: -3.8pp
- All cycles
- 2024: R+3.8 2020: D+6.0 2016: D+5.3 2012: D+23.1 2008: D+21.6
Not yet ingested
- Civics
- —
Market trends
- HPI YoY
- ▼ -111.45%
- Current HPI
- 274.8011
- Rent YoY
- ▲ 1.94%
- Metro
- Vineland-Bridgeton, NJ
- State GDP YoY
- ▲ 2.05%
- F500 in state
- 34
Industry mix (Fortune 500 HQ in NJ)
| Industry | F500 HQs | Revenue |
|---|---|---|
| Consumer Goods | 3 | $31B |
|
||
| Pharmaceuticals | 2 | $153B |
|
||
| Technology | 2 | $21B |
|
||
| Insurance | 2 | $20B |
|
||
| Healthcare | 2 | $19B |
|
||
| Financial Services | 1 | $70B |
|
||
Price history
+59.2% since first listed28 events — show timeline
- 2026-04-09 Relisted — BRIGHT MLS
- 2026-03-20 Contingent — BRIGHT MLS
- 2026-03-04 Listed $125,000 BRIGHT MLS
- 2022-08-10 Listing Removed — BRIGHT MLS
- 2022-08-04 Listing Removed — SJSRMLS
- 2022-02-11 Listed $109,000 BRIGHT MLS
- 2022-02-10 Listed $109,000 SJSRMLS
- 2019-03-06 Listing Removed — BRIGHT MLS
- 2019-01-25 Price Changed $7,500 BRIGHT MLS
- 2019-01-22 Price Changed $15,000 BRIGHT MLS
- 2019-01-07 Listed $17,900 BRIGHT MLS
- 2018-12-04 Listing Removed — BRIGHT MLS
- 2018-08-30 Price Changed $19,900 BRIGHT MLS
- 2018-06-04 Listed $24,900 BRIGHT MLS
- 2018-05-27 Listing Removed — BRIGHT MLS
- 2018-02-28 Price Changed $26,000 BRIGHT MLS
- 2017-05-30 Sold (MLS) $22,430 SJSRMLS
- 2017-05-26 Listed $31,000 BRIGHT MLS
- 2017-05-06 Price Changed $32,100 SJSRMLS
- 2017-04-10 Contingent — SJSRMLS
- 2017-03-24 Listed $37,100 SJSRMLS
- 2002-08-22 Sold (MLS) $28,507 SJSRMLS
- 2002-07-26 Listing Removed — SJSRMLS
- 2002-07-18 Listed $30,000 SJSRMLS
- 1999-09-16 Sold (Public Records) $79,500 Public Records
- 1999-09-15 Sold (MLS) $79,500 SJSRMLS
- 1999-03-29 Listing Removed — SJSRMLS
- 1998-01-20 Listed $78,500 SJSRMLS
Property tax history
+2.1%/yrLatest (2025): $3,930 · +3.3% YoY. Source: county tax records.
Cash-flow waterfall
monthlySold comps — $/sqft
last 12 mo · ≤1 miLoading sold comps…