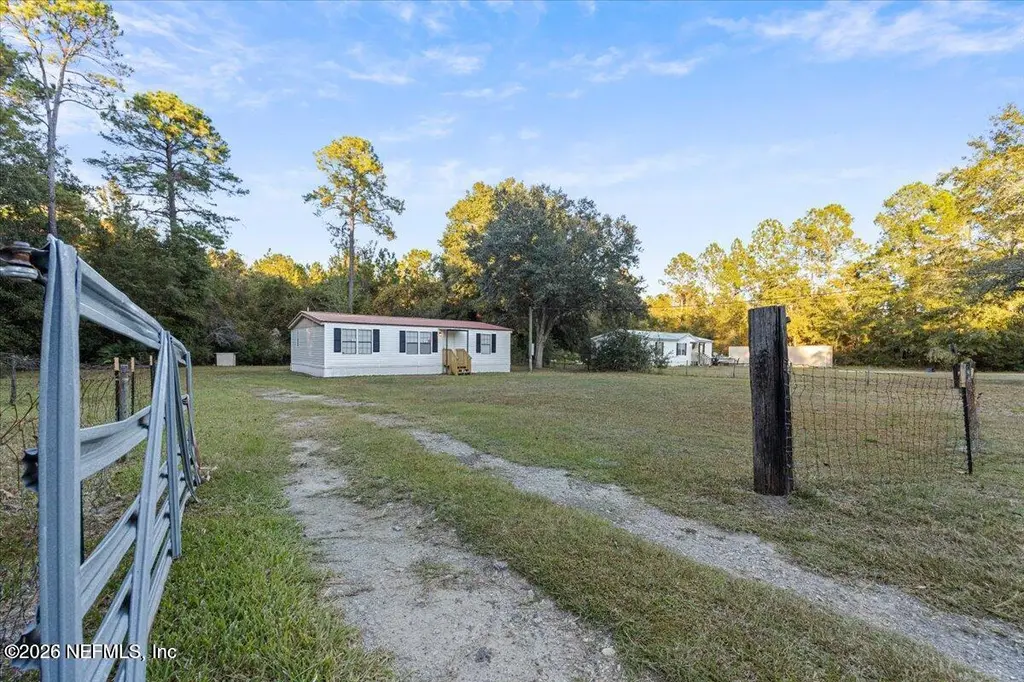
1480 Brangus Rd · Middleburg, FL
Flood risk 1/10 · Minimal
- FEMA flood zone
- X (unshaded)
- Chance of flooding over 30 yrs
- 0.0%
- Est. flood insurance / yr
- $507 – $1,088
Fire risk 8/10 · Major
- Est. fire insurance / yr
- $947 – $1,759
Heat risk 8/10 · Major
- Hot days now (above 108°F)
- 7 days/yr
- Hot days in 30 yrs
- 19 days/yr
Wind risk 9/10 · Severe
- Chance of severe wind over 30 yrs
- 99.0%
Air-quality risk 2/10 · Minimal
- Unhealthy air days now
- 2 days/yr
- Unhealthy air days in 30 yrs
- 2 days/yr
Risk factors via First Street. Map © Google.
Why this score? — see what drove the C grade
The composite is a weighted blend of 9 inputs, each scored 0–100. Each bar is that input's sub-score; the figure is the points it added to the 100-point composite (weight × sub-score).
- Cash flow +27.2/30.0
- DSCR +9.5/10.0
- 1% rule +6.4/10.0
- Schools +5.1/10.0
- Rent growth +3.3/5.0
- Livability +3.2/5.0
- Condition / age +2.5/5.0
- ARV discount +0.0/15.0
- Appreciation +0.0/10.0
$174,900
🖨 Deal sheet 📄 Offer letter ✓ Due diligence
Listing remarks
Welcome home to this charming mobile home situated on just under an acre of land, offering the perfect blend of privacy, space, and potential. Featuring a refreshed interior, this home is move-in ready and waiting for its new owner to make it their own. Nestled off the road, the property provides a peaceful setting with plenty of room to enjoy outdoor living. The fenced yard offers security for pets, children, or gardening enthusiasts, while the expansive lot provides endless possibilities for workshops, storage, recreational vehicles, or creating your dream homestead. Whether you're looking for a quiet retreat, space to grow a garden, or room for hobbies and projects, this property deliver
Key facts
- Expansive lot
- Refreshed interior
- Fenced yard
Tags
Property features AI
Finance
- HOA & community: Not a senior community
Exterior
- Parking: Unassigned parking
- Utilities: Electricity connected
- Home design: Double wide mobile home; One story
- Construction: Manufactured home (double wide)
- Exterior features: Property attached (mobile home on private lot); Lot of approximately 0.88 acres
Interior
- Kitchen: Refrigerator
- Bedrooms: 3 bedrooms
- Flooring: Carpet
- Bathrooms: 2 full bathrooms
- Heating & cooling: Central heating; Central air
- Interior features: Central heating and central air conditioning; Electric dryer hookup and washer hookup; Carpet flooring; Refrigerator included
- Laundry & utility: Washer hookup; Electric dryer hookup
Neighborhood map
What this means for you Summary
Snapshot
- This is a 3-bed/2.0-bath manufactured listed at $175k.
Deal economics
- At list price, monthly cash flow is $503 ($6k/yr) — positive.
- The deal already cash-flows at list — no discount required.
- Meets the 1% rule at list price ($2k rent vs $175k).
- Recommended offer: $172k (1.5% below list) — sets the bar for market timing.
- Cap rate 9.7% vs local median 3.8% in Middleburg — top-decile yield for the area; either an underpriced asset or a hidden risk that comps aren't pricing in. Stress-test before assuming the spread holds.
Location & tenants
- Location reads 65/100 on livability (#657 in FL) — a middle-class / working-renter tenant base. Strengths: cost of living A+, housing A+; Watch: amenities F, commute F, health & safety F.
- Clay (suburban): math 58% / reading 59% proficiency, ranked #14 of 73 in FL (top 19%) — acceptable for families but not a draw, mixed tenant base, ~2y average lease.
- Market conditions: Rents rising (+3.4%/yr); 601 active listings in the ZIP; solid renter incomes; 1,876 units permitted in Clay County in 2024 (14 in 5+ unit buildings).
Forward outlook
- Local home prices are declining (-3.0%/yr); year-one equity from $1k of loan paydown is wiped out by about $5k of value loss. Plan a longer hold.
- Clay County population projected at +19% by 2050 — long-run rental-demand tailwind backs the buy-and-hold thesis.
- At projected returns (-3.0% appreciation + 3.4% rent growth), your $49k cash investment doubles in ~9 years — after that, you're playing with house money.
Negotiation context
- It's been on market 15 days — a 2% lower offer ($172k) is reasonable based on typical stale-listing flexibility.
- 4 sale attempts since 2y ago with the ask held roughly flat each time — persistent listings suggest the price (not the market) is what's stuck; bring a comps-based counter.
Risks & watch-outs
- Climate carrying-cost: severe wind risk, 99% chance of damaging wind over 30y; severe wildfire risk; extreme-heat days projected 7→19/yr by 2055 (HVAC capex compounding) — expect insurance premiums to compound above CPI over the hold.
Questions for the listing agent
- Is there a deadline driving the sale (1031 exchange, divorce, estate, relocation)? That informs how much negotiation room exists.
- Schools are B-rated — typically a magnet for longer-tenancy family renters. What's the average tenant stay here, and is there a school-zone premium baked into asking?
- What's the average days-on-market for RENTAL listings here right now (not sales)? A rising rental-DOM trend means longer vacancies and softer asking-rent achievability than the comps imply.
- What's the recent tenant-quality profile in this submarket — average credit score on applications, eviction rate, late-payment / NSF rate, and stable-employment percentage? A property-management company in the area should have these aggregated.
- How much new for-sale + rental construction is in the pipeline within 1–3 miles? Heavy new supply typically softens prices + rents 12–24 months out; constrained supply supports both.
Investment metrics
- 1% rule
- 1.14% ✓
- Cap rate
- 9.74%
- Cash-on-cash
- 12.33%
- DSCR
- 1.55
- GRM
- 7.3
CMA / ARV
- ARV (on-the-fly)
- $123,120
- Comps found
- 3
Show comp detail 3 sales within ~0.75 mi
| Address | Dist | Beds/Ba | Sqft | Sold | Price | $/sf | Match |
|---|---|---|---|---|---|---|---|
| 5705 Short Horn Rd | 0.30mi | 3/2.0 | 1,248 (+10%) | 3mo | $135,000 | $108 | 68 |
| 5255 Peggy Ln | 0.55mi | 3/2.0 | 1,186 (+4%) | 4mo | $88,000 | $74 | 64 |
| 5637 Alford Ln | 0.69mi | 3/2.0 | 1,152 (+1%) | 7mo | $161,000 | $140 | 60 |
Match score weights: distance 35% · size 25% · config 20% · recency 20%. Top-matched comps best support the ARV.
Projected returns pro-forma
-3.0% appreciation · 3.35% rent growth · sell at horizon
- IRR
- 2.3%
- Equity multiple
- 1.09×
- Total profit
- $4,341
- Equity at exit
- $26,078
- IRR
- 12.2%
- Equity multiple
- 1.97×
- Total profit
- $47,707
- Equity at exit
- $15,122
Cash invested: $48,972 (down + closing). Projections, not guarantees.
Landlord ↔ Tenant lean methodology
- Overall (STATE)
- 87 Strongly Landlord-Friendly
- State Florida
- 87 Strongly Landlord-Friendly · R+3
- County
- — inherits STATE
- City
- — inherits STATE
ZIP-level market 32068
- Home prices YoY
- -27.5%
- Rents YoY
- 3.4%
- Active inventory
- 601
- Price-to-rent
- 7.3×
Monthly cashflow live
- Estimated rent
- $1,989 medium interval (Pro) →
- Mortgage (P&I)
- −$917
- Tax from tax record
- −$78 /mo · $939/yr
- Insurance
- −$73
- HOA
- −$0
- Vacancy / Maint / Mgmt
- −$418
- Net cashflow
- $503
Break-even live
UW: 25.0% down · 7.5% · 30yr · 1.5% tax · 5.0% vac · 8.0% maint · 8.0% mgmt
Financing live
Cash to close
- Down payment
- $43,725
- Closing costs
- $5,247
- Reserves months
- —
- Total cash needed
- —
Loan-product check · same deal, 3 products live
Conventional
25% down · 7.5% · 30yr
- Down + closing
- —
- Monthly P&I
- —
- Monthly cashflow
- —
- DSCR
- —
- Eligible?
- —
Personal DTI + credit; lowest rate.
DSCR
20% down · 8.5% · 30yr
- Down + closing
- —
- Monthly P&I
- —
- Monthly cashflow
- —
- DSCR
- —
- Eligible?
- —
No personal income docs; deal must DSCR.
Hard money
10% down · 12.0% · 12mo
- Down + closing
- —
- Monthly P&I
- —
- Monthly cashflow
- —
- DSCR
- —
- Eligible?
- —
Short-term bridge; refi at stabilization.
Listing history 19 events
-
2026-06-18days on market $174,900 Active 15 DOM
-
2026-06-17days on market $174,900 Active 14 DOM
-
2026-06-16days on market $174,900 Active 13 DOM
-
2026-06-15days on market $174,900 Active 12 DOM
-
2026-06-13days on market $174,900 Active 10 DOM
-
2026-06-13days on market $174,900 Active 9 DOM
-
2026-06-09days on market $174,900 Active 6 DOM
-
2026-06-08days on market $174,900 Active 5 DOM
-
2026-06-07remarks 699-char remark
-
2026-06-07days on market $174,900 Active 4 DOM
-
2026-05-31days on market $174,900 Active 182 DOM
-
2026-04-20status Active
-
2026-04-10status Active
-
2026-03-25status Pending
-
2026-03-25historical
-
2026-02-27price $174,900
-
2025-10-31$179,900 Active
-
2024-02-05historical
-
2024-01-30
ⓘ Source: listings_history table (triggers on properties + properties_extension) + one-shot
backfill from property_details.listing_events for pre-trigger history.
Tax reassessment forecast FL · Resets to sale price
- Current annual tax
- $939 · $78/mo
- Projected year-2 tax
- $1,452 · $121/mo
- Expected delta
- +$513/yr (+$43/mo · 54.6%)
ⓘ Screening estimate from a state-policy table — verify with the county assessor before closing.
Climate risk First Street
- Flood 1/10 Low FEMA zone X (unshaded) · 0% chance over 30 yrs
- Wildfire 8/10 Severe
- Heat 8/10 Severe 7 d/yr ≥108°F today · 19 d/yr by 30 yrs out
- Wind 9/10 Extreme 99% chance of damaging wind over 30 yrs
- Air quality 2/10 Low 2 unhealthy d/yr today · 2 by 30 yrs out
Nearby sold comps map
Loading sold comps map…
Walkable amenities ~0.75 mi
Loading nearby amenities…
Taxation est. · year 1
- Rental income
- $23,868
- − Mortgage interest
- −$9,797
- − Property taxes
- −$939
- − Insurance
- −$874
- − Repairs & maintenance
- −$1,909
- − Management
- −$1,909
- − Depreciation
- −$5,088
- Taxable income
- $3,350
- Est. tax owed @ 24.0%
- −$804
- After-tax cash flow
- $5,232/yr
For passive investors: Depreciation is non-cash, so a rental often shows a tax loss while cash-flowing — sheltering income. Rental losses are passive: they offset passive income freely, and up to $25,000/yr can offset ordinary (W-2) income if you actively participate and your MAGI is under $100k (phasing out to $0 by $150k); unused losses carry forward. On sale, claimed depreciation is recaptured at up to 25%, and gains may owe capital-gains tax (a 1031 exchange can defer both). Figures are a year-1 estimate at your 24.0% rate — not tax advice; consult a CPA.
Schools (NCES district)
- District
- Clay
- NCES district ID
- 1200300
- Math proficiency
- 58% ▼ -8.00%
- Reading proficiency
- 59% ▼ -3.00%
- Median HH income
- $59,379
- Composite
- 50.73/100
- National rank
- #1815
- State rank
- #14 of 73 in FL
Livability — Middleburg
- Score
- 65/100
- State rank
- #657
- US rank
- #13174
Category grades
Schools grade is shown separately in the Schools card above.
Census & demographics
- County
- Clay County · 208,450 people
- City population
- 58,983
- Metro
- Jacksonville, FL
- Population (ZIP)
- 58,983
- Household income
- $84,431
- Rent vs Own
- Severe rent burden
- 975.0
Population outlook (Clay County) Hauer SSP2
- Today (2025)
- 230,495 people
- By 2030
- 242,427 · +5.2%
- By 2040
- 262,244 · +13.8%
- By 2050
- 275,148 · +19.4%
- By 2075
- 295,397 · +28.2%
- By 2100
- 287,592 · +24.8%
Race, ethnicity, and origin ACS 2023
- Neighborhood character
- Predominantly White (74%)
- Race & ethnicity
- White 74% Hispanic / Latino 13% Two or more races 10% Black 7%
- Hispanic origin (detail)
- Mexican 2% Puerto Rican 5%
- Common ancestry
- Slovak 2% Romanian 2% Lithuanian 2%
- Foreign-born
- 7% · Canada, Jamaica
- Languages at home
- 87% English-only · Spanish 9% Arabic 1% German/W. Germanic 1%
Political lean MEDSL · Clay
- 2024 margin
- Solid R (+39.3) · D 29.9% · R 69.2%
- 2008→2024 swing
- +3.6pp toward D · 2008: -42.8pp · 2024: -39.3pp
- All cycles
- 2024: R+39.3 2020: R+37.1 2016: R+44.3 2012: R+45.8 2008: R+42.8
Not yet ingested
- Civics
- —
Market trends
- HPI YoY
- ▼ -115.99%
- Current HPI
- 305.2531
- Rent YoY
- ▲ 3.35%
- Metro
- Jacksonville, FL
- State GDP YoY
- ▲ 3.28%
- F500 in state
- 36
Industry mix (Fortune 500 HQ in FL)
| Industry | F500 HQs | Revenue |
|---|---|---|
| Industrial Technology | 2 | $29B |
|
||
| Insurance | 2 | $17B |
|
||
| Retail | 1 | $60B |
|
||
| Technology Distribution | 1 | $58B |
|
||
| Homebuilding | 1 | $35B |
|
||
| Technology Manufacturing | 1 | $35B |
|
||
Price history
-2.8% since first listed8 events — show timeline
- 2026-04-20 Relisted — realMLS
- 2026-04-10 Relisted — realMLS
- 2026-03-25 Pending — realMLS
- 2026-03-25 Listing Removed — realMLS
- 2026-02-27 Price Changed $174,900 realMLS
- 2025-10-31 Listed $179,900 realMLS
- 2024-02-05 Rental Removed — APPFOLIO
- 2024-01-30 Listed for Rent — APPFOLIO
Property tax history
+6.1%/yrLatest (2025): $939 · +13.7% YoY. Source: county tax records.
Cash-flow waterfall
monthlySold comps — $/sqft
last 12 mo · ≤1 miLoading sold comps…