 Multi-family
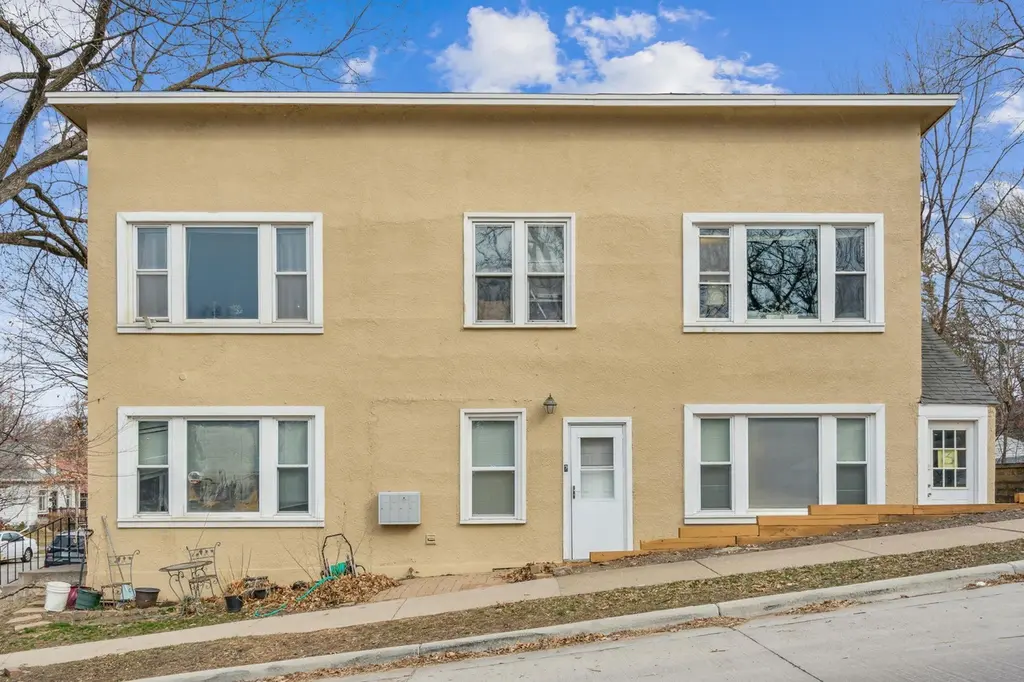
3201 Polk St NE · Minneapolis, MN
Flood risk 1/10 · Minimal
- FEMA flood zone
- X (unshaded)
- Chance of flooding over 30 yrs
- 0.0%
- Est. flood insurance / yr
- $507 – $1,088
Fire risk 1/10 · Minimal
- Est. fire insurance / yr
- $888 – $1,650
Heat risk 2/10 · Minimal
- Hot days now (above 100°F)
- 7 days/yr
- Hot days in 30 yrs
- 14 days/yr
Wind risk 2/10 · Minimal
- Chance of severe wind over 30 yrs
- —
Air-quality risk 2/10 · Minimal
- Unhealthy air days now
- 1 days/yr
- Unhealthy air days in 30 yrs
- 1 days/yr
Risk factors via First Street. Map © Google.
Why this score? — see what drove the D grade
The composite is a weighted blend of 9 inputs, each scored 0–100. Each bar is that input's sub-score; the figure is the points it added to the 100-point composite (weight × sub-score).
- Cash flow +17.9/30.0
- DSCR +5.6/10.0
- 1% rule +4.8/10.0
- Livability +3.9/5.0
- Rent growth +3.8/5.0
- Schools +3.5/10.0
- Condition / age +2.2/5.0
- ARV discount +0.0/15.0
- Appreciation +0.0/10.0
$499,999
🖨 Deal sheet (PDF) 📄 Offer letter ✓ Due diligence
Multi-family units
County records classify this as Multi-Family (2-4 Unit). Listing-text estimate: 1 unit. estimate disagrees with records
Listing remarks MLS
Exceptional four-plex just off of St. Anthony Parkway and right across the street from Deming Park. Four 1-bedroom units featuring hardwood floors, separate electric, and washer and dryer in each unit. Great opportunity for investor or owner occupant. Only unit 2 available for showings.
Key facts
- 5,270 sq ft lot
- Built 1920
- Listed 103 days
Neighborhood map
What this means for you Summary
Snapshot
- This is a 4-bed/4.0-bath multifamily listed at $500k. Condition is rated fair.
Deal economics
- At list price, monthly cash flow is $420 ($5k/yr) — positive.
- The deal already cash-flows at list — no discount required.
- To meet the 1% rule (rent ≥ 1% of price), the offer needs to be $490k (1.9% below list).
- Recommended offer: $455k (9.0% below list) — sets the bar for market timing.
- Cap rate 7.3% vs local median 3.1% in Minneapolis — top-decile yield for the area; either an underpriced asset or a hidden risk that comps aren't pricing in. Stress-test before assuming the spread holds.
Location & tenants
- Location reads 78/100 on livability (#110 in MN, #2,525 nationally) — a middle-class / working-renter tenant base. Strengths: amenities A+, commute A+, housing A+; Watch: cost of living C-, crime F.
- Minneapolis Public School District (urban): math 35% / reading 46% proficiency, ranked #217 of 301 in MN (top 72%) — families likely to look elsewhere, expect single-tenant / working-renter base with shorter leases.
- Market conditions: Rents rising fast (+5.2%/yr); 167 active listings in the ZIP; 10 comparable units currently listed for rent nearby; rentals leasing fast (median 13d on market — plan ~1-2 weeks tenant-placement turnaround); solid renter incomes; 4,651 units permitted in Hennepin County in 2024 (2,443 in 5+ unit buildings).
- At $4,905/mo this rent would consume 59% of the median local household income ($99k/yr) (locally 1179% of renters already pay >50% of income on rent) — very limited rent-growth headroom before tenants either downsize or default.
Forward outlook
- Local home prices are declining (-3.0%/yr); year-one equity from $3k of loan paydown is wiped out by about $15k of value loss. Plan a longer hold.
- Hennepin County population projected at +30% by 2050 — long-run rental-demand tailwind backs the buy-and-hold thesis.
Negotiation context
- It's been on market 103 days — a 9% lower offer ($455k) is reasonable based on typical stale-listing flexibility.
- 16 sale attempts since 24y ago with the ask held roughly flat each time — persistent listings suggest the price (not the market) is what's stuck; bring a comps-based counter.
- Current owner paid $230k; list at $500k implies a 117% gain — meaningful room to come down on a strong offer.
Risks & watch-outs
- Watch-outs: built in 1920 — expect roof / HVAC / electrical / plumbing capex.
Questions for the listing agent
- It's been on market 103 days. Have you received any prior offers? Is the seller open to a 9% concession, seller financing, or rate buy-down credit?
- Have any recent inspections been done? Can we get a copy of the seller's disclosures and any deferred-maintenance estimates?
- Built in 1920 — when were the roof, HVAC, electrical panel, plumbing, and water heater last replaced?
- Why hasn't it sold? Are there any deal-killer items the seller is aware of (foundation, flood, title, zoning, code violations)?
- Is there a deadline driving the sale (1031 exchange, divorce, estate, relocation)? That informs how much negotiation room exists.
- Crime grade is F in this area — have there been break-ins, vandalism, or insurance claims at this property in the last 3 years? What carrier currently insures it and at what premium?
- The area grade is low — what's the realistic commute time and amenity access for the typical tenant pool here? Any planned neighborhood developments (good or bad) we should know about?
- What's the average days-on-market for RENTAL listings here right now (not sales)? A rising rental-DOM trend means longer vacancies and softer asking-rent achievability than the comps imply.
- What's the recent tenant-quality profile in this submarket — average credit score on applications, eviction rate, late-payment / NSF rate, and stable-employment percentage? A property-management company in the area should have these aggregated.
- How much new apartment / multifamily construction is in the pipeline within 1–3 miles? Heavy new supply (>2% of stock underway) typically softens rents 12–24 months out; light construction supports rent growth.
Investment metrics
- 1% rule
- 0.98% ✗
- Cap rate
- 7.30%
- Cash-on-cash
- 3.60%
- DSCR
- 1.16
- GRM
- 8.5
CMA / ARV
- ARV (median comp)
- $408,261
- List price
- $499,999
- Delta
- 22.47%
- Verdict
- OVERPRICED
- Comps
- 2 within 1.0 mi
Projected returns pro-forma
-3.0% appreciation · 5.19% rent growth · sell at horizon
- IRR
- -8.2%
- Equity multiple
- 0.69×
- Total profit
- $-43,181
- Equity at exit
- $74,551
- IRR
- 4.0%
- Equity multiple
- 1.32×
- Total profit
- $44,506
- Equity at exit
- $43,231
Cash invested: $140,000 (down + closing). Projections, not guarantees.
Landlord ↔ Tenant lean methodology
- Overall (CITY)
- 34 Tenant-Leaning
- State Minnesota
- 46 Balanced · D+2
- County
- — inherits STATE
- City Minneapolis
- 34 Tenant-Leaning · D+50
ZIP-level market 55418
- Rents YoY
- 5.2%
- Active inventory
- 167
- Price-to-rent
- 34.0×
Monthly cashflow live
- Estimated rent
- $4,905 high interval (Pro) →
- Mortgage (P&I)
- −$2,622
- Tax est. 1.5%
- −$625 /mo · $7,500/yr
- Insurance
- −$208
- HOA
- −$0
- Vacancy / Maint / Mgmt
- −$1,030
- Net cashflow
- $420
Break-even live
Sensitivity live
| Price | -10% $765 | -5% $592 | +0% $420 | +5% $247 | +10% $74 |
|---|---|---|---|---|---|
| Rent | -10% $32 | -5% $226 | +0% $420 | +5% $613 | +10% $807 |
| Rate | -1.0pp $671 | -0.5pp $547 | base $420 | +0.5pp $290 | +1.0pp $158 |
4-unit breakdown (identical units grouped — click to expand)
| Units | Beds | Baths | Est. rent |
|---|---|---|---|
| 4× units | 1 | 1 | $4,904 |
| #1 | 1 | 1 | $1,226 |
| #2 | 1 | 1 | $1,226 |
| #3 | 1 | 1 | $1,226 |
| #4 | 1 | 1 | $1,226 |
| Total (4 units) | $4,905 | ||
UW: 25.0% down · 7.5% · 30yr · 1.5% tax · 5.0% vac · 8.0% maint · 8.0% mgmt
Financing live
Cash to close
- Down payment
- $125,000
- Closing costs
- $15,000
- Reserves months
- —
- Total cash needed
- —
Loan-product check · same deal, 3 products live
Conventional
25% down · 7.5% · 30yr
- Down + closing
- —
- Monthly P&I
- —
- Monthly cashflow
- —
- DSCR
- —
- Eligible?
- —
Personal DTI + credit; lowest rate.
DSCR
20% down · 8.5% · 30yr
- Down + closing
- —
- Monthly P&I
- —
- Monthly cashflow
- —
- DSCR
- —
- Eligible?
- —
No personal income docs; deal must DSCR.
Hard money
10% down · 12.0% · 12mo
- Down + closing
- —
- Monthly P&I
- —
- Monthly cashflow
- —
- DSCR
- —
- Eligible?
- —
Short-term bridge; refi at stabilization.
Rent comps 10 comps
| Address | Beds | Baths | Sqft | Rent | $/sqft | DOM | Units | Dist |
|---|---|---|---|---|---|---|---|---|
| 3317 Garfield St NE Minneapolis, MN | 4.0 | 2.0 | 2080 | $3,250 | $1.56 | 44d | 1 | 0.61mi |
| 2646 Quincy St NE Unit 2646 Minneapolis, MN | 4.0 | 3.0 | 1718 | $2,795 | $1.63 | 25d | 1 | 0.72mi |
| 2109 Saint Anthony Pkwy Minneapolis, MN | 5.0 | 3.0 | 2730 | $3,895 | $1.43 | 11d | 1 | 0.84mi |
| 3121 Roosevelt St NE Minneapolis, MN | 4.0 | 2.0 | 1794 | $2,695 | $1.50 | 0d | 1 | 0.96mi |
| 909 Gould Ave NE Minneapolis, MN | 3.0 | 1.0–2.0 | 929 | $2,724 | $2.93 | 0d | 23 | 1.01mi |
| 4010 Monroe St NE Minneapolis, MN | 5.0 | 2.0 | 2260 | $2,929 | $1.30 | 13d | 1 | 1.13mi |
| 1241 Circle Terrace Blvd NE Unit 1241 Minneapolis, MN | 3.0 | 1.5 | 1550 | $2,100 | $1.35 | 25d | 1 | 1.14mi |
| 1011 41st Ave NE #220 Minneapolis, MN | 3.0 | 2.0 | 1500 | $2,400 | $1.60 | 6d | 1 | 1.22mi |
| 636 22nd Ave NE Minneapolis, MN | 3.0–4.0 | 2.5 | 1625 | $3,594 | $2.21 | 0d | 3 | 1.25mi |
| 207 24th Ave NE Minneapolis, MN | 3.0 | 3.0 | 1575 | $2,995 | $1.90 | 44d | 1 | 1.38mi |
Listing history 38 events
-
2026-06-07days on market $499,999 Active 103 DOM
-
2026-06-04days on market $499,999 Active 100 DOM
-
2026-06-03days on market $499,999 Active 99 DOM
-
2026-06-02days on market $499,999 Active 98 DOM
-
2026-06-01days on market $499,999 Active 97 DOM
-
2026-05-31days on market $499,999 Active 96 DOM
-
2026-05-01status Active 288-char remark
Show marketing remark (288 chars)
Exceptional four-plex just off of St. Anthony Parkway and right across the street from Deming Park. Four 1-bedroom units featuring hardwood floors, separate electric, and washer and dryer in each unit. Great opportunity for investor or owner occupant. Only unit 2 available for showings.
-
2026-04-26historical 288-char remark
Show marketing remark (288 chars)
Exceptional four-plex just off of St. Anthony Parkway and right across the street from Deming Park. Four 1-bedroom units featuring hardwood floors, separate electric, and washer and dryer in each unit. Great opportunity for investor or owner occupant. Only unit 2 available for showings.
-
2026-04-01status Active 288-char remark
Show marketing remark (288 chars)
Exceptional four-plex just off of St. Anthony Parkway and right across the street from Deming Park. Four 1-bedroom units featuring hardwood floors, separate electric, and washer and dryer in each unit. Great opportunity for investor or owner occupant. Only unit 2 available for showings.
-
2026-02-12status Active 288-char remark
Show marketing remark (288 chars)
Exceptional four-plex just off of St. Anthony Parkway and right across the street from Deming Park. Four 1-bedroom units featuring hardwood floors, separate electric, and washer and dryer in each unit. Great opportunity for investor or owner occupant. Only unit 2 available for showings.
-
2026-02-10historical 288-char remark
Show marketing remark (288 chars)
Exceptional four-plex just off of St. Anthony Parkway and right across the street from Deming Park. Four 1-bedroom units featuring hardwood floors, separate electric, and washer and dryer in each unit. Great opportunity for investor or owner occupant. Only unit 2 available for showings.
-
2026-02-10$499,999 288-char remark
Show marketing remark (288 chars)
Exceptional four-plex just off of St. Anthony Parkway and right across the street from Deming Park. Four 1-bedroom units featuring hardwood floors, separate electric, and washer and dryer in each unit. Great opportunity for investor or owner occupant. Only unit 2 available for showings.
-
2024-07-01historical
-
2024-04-28price $539,999
-
2024-03-11status Active
-
2024-03-05$549,000 Active
-
2023-05-10historical
-
2023-03-07price $549,999
-
2023-02-02$575,000 Active
-
2022-11-01historical
-
2022-07-27$575,000 Active
-
2008-07-08soldstatus $230,000
-
2008-05-23historical
-
2008-02-27$259,900
-
2007-12-01historical
-
2007-03-01$315,000
-
2006-08-24historical
-
2006-05-12$375,000
-
2006-04-15historical
-
2006-03-03$425,000
-
2006-02-26historical
-
2006-02-19historical
-
2006-02-10$425,000
-
2005-11-17$425,000
-
2003-09-22historical
-
2003-07-25$399,700
-
2002-05-15historical
-
2002-05-09$239,900
ⓘ Source: listings_history table (triggers on properties + properties_extension) + one-shot
backfill from property_details.listing_events for pre-trigger history.
Climate risk First Street
- Flood 1/10 Low FEMA zone X (unshaded) · 0% chance over 30 yrs
- Wildfire 1/10 Low
- Heat 2/10 Low 7 d/yr ≥100°F today · 14 d/yr by 30 yrs out
- Wind 2/10 Low
- Air quality 2/10 Low 1 unhealthy d/yr today · 1 by 30 yrs out
Nearby sold comps map
Loading sold comps map…
Walkable amenities ~0.75 mi
Loading nearby amenities…
Taxation est. · year 1
- Rental income
- $58,860
- − Mortgage interest
- −$28,008
- − Property taxes
- −$7,500
- − Insurance
- −$2,500
- − Repairs & maintenance
- −$4,709
- − Management
- −$4,709
- − Depreciation
- −$14,545
- Taxable loss
- −$3,111
- Est. tax savings @ 24.0%
- +$747
- After-tax cash flow
- $5,781/yr
For passive investors: Depreciation is non-cash, so a rental often shows a tax loss while cash-flowing — sheltering income. Rental losses are passive: they offset passive income freely, and up to $25,000/yr can offset ordinary (W-2) income if you actively participate and your MAGI is under $100k (phasing out to $0 by $150k); unused losses carry forward. On sale, claimed depreciation is recaptured at up to 25%, and gains may owe capital-gains tax (a 1031 exchange can defer both). Figures are a year-1 estimate at your 24.0% rate — not tax advice; consult a CPA.
Condition & rehab AI · 12 photos
This four-plex is in fair condition with moderate repairs and maintenance needed. It has potential for increased value with updates to the exterior, interior, and landscaping.
Repairs flagged
- Minor Kitchen cabinets — Cabinets show signs of wear and tear.
- Minor Bathroom fixtures — Fixtures show signs of wear and tear.
- Minor Exterior siding — Siding shows signs of wear and tear.
- Minor Landscaping — Minimal landscaping and overgrown areas need attention.
- Minor Paint touch-ups — Paint shows minor scuffs and marks that need touch-ups.
Value-add opportunities
- Both Paint touch-ups — Fresh paint can improve the home's appearance and value.
- Both Landscaping improvements — A well-maintained yard can increase both resale and rental value.
- Both Kitchen and bathroom updates — Fresh paint and minor updates can improve the home's appearance and value.
Renovation cost estimate screening
| Repair item | Severity | Est. cost |
|---|---|---|
| Kitchen cabinets · Cabinets show signs of wear and tear. | Minor | $500–3,000 |
| Bathroom fixtures · Fixtures show signs of wear and tear. | Minor | $500–3,000 |
| Exterior siding · Siding shows signs of wear and tear. | Minor | $500–3,000 |
| Landscaping · Minimal landscaping and overgrown areas need attention. | Minor | $500–3,000 |
| Paint touch-ups · Paint shows minor scuffs and marks that need touch-ups. | Minor | $500–3,000 |
| Total estimated repair cost · 5 items | $2,500–15,000 |
Value-add ROI direction
- Both Paint touch-ups — Fresh paint can improve the home's appearance and value. ↑
- Both Landscaping improvements — A well-maintained yard can increase both resale and rental value. ↑
- Both Kitchen and bathroom updates — Fresh paint and minor updates can improve the home's appearance and value. ↑
ⓘ Cost ranges are severity-bucket heuristics (US national rule-of-thumb). Get contractor quotes + a written scope before underwriting a rehab budget.
Schools (NCES district)
- District
- Minneapolis Public School District
- NCES district ID
- 2721240
- Math proficiency
- 35% ▼ -7.00%
- Reading proficiency
- 46% ▼ -1.00%
- Median HH income
- $50,521
- Composite
- 34.92/100
- National rank
- #5067
- State rank
- #217 of 301 in MN
Livability — Minneapolis
- Score
- 78/100
- State rank
- #110
- US rank
- #2525
Category grades
Schools grade is shown separately in the Schools card above.
Census & demographics
- Census place
- Minneapolis, MN
- County
- Hennepin County · 1,150,272 people
- City population
- 417,555
- Metro
- Minneapolis-St. Paul-Bloomington, MN-WI
- Population (ZIP)
- 31,505
- Household income
- $99,397
- Rent vs Own
- Severe rent burden
- 1179.0
Population outlook (Hennepin County) Hauer SSP2
- Today (2025)
- 1,405,227 people
- By 2030
- 1,492,650 · +6.2%
- By 2040
- 1,660,157 · +18.1%
- By 2050
- 1,823,498 · +29.8%
- By 2075
- 2,221,283 · +58.1%
- By 2100
- 2,509,976 · +78.6%
Race, ethnicity, and origin ACS 2023
- Neighborhood character
- Predominantly White (74%)
- Race & ethnicity
- White 74% Black 9% Hispanic / Latino 8% Two or more races 7% Asian 2%
- Hispanic origin (detail)
- Mexican 3%
- Common ancestry
- Portuguese 14% Romanian 6% Lithuanian 3%
- Foreign-born
- 11% · Canada, Vietnam, South Korea
- Languages at home
- 86% English-only · Spanish 5% Other Indo-European 1% German/W. Germanic 1%
Political lean MEDSL · Hennepin
- 2024 margin
- Solid D (+42.6) · D 70.2% · R 27.5% · Other 2.3%
- 2008→2024 swing
- +14.0pp toward D · 2008: 28.6pp · 2024: 42.6pp
- All cycles
- 2024: D+42.6 2020: D+43.2 2016: D+35.3 2012: D+27.1 2008: D+28.6
Not yet ingested
- Civics
- —
Market trends
- HPI YoY
- ▼ -278.21%
- Current HPI
- 277.9846
- Rent YoY
- ▲ 5.19%
- Metro
- Minneapolis-St. Paul-Bloomington, MN-WI
- State GDP YoY
- ▲ 2.41%
- F500 in state
- 34
Industry mix (Fortune 500 HQ in MN)
| Industry | F500 HQs | Revenue |
|---|---|---|
| Healthcare | 2 | $407B |
|
||
| Retail | 2 | $150B |
|
||
| Consumer Goods | 2 | $32B |
|
||
| Industrial Machinery | 2 | $6B |
|
||
| Agriculture | 1 | $40B |
|
||
| Healthcare / Medical Devices | 1 | $32B |
|
||
Price history
+108.4% since first listed32 events — show timeline
- 2026-05-01 Relisted — NORTHSTARMLS as Distributed by MLS Grid
- 2026-04-26 Listing Removed — NORTHSTARMLS as Distributed by MLS Grid
- 2026-04-01 Relisted — NORTHSTARMLS as Distributed by MLS Grid
- 2026-02-12 Relisted — NORTHSTARMLS as Distributed by MLS Grid
- 2026-02-10 Listing Removed — NORTHSTARMLS as Distributed by MLS Grid
- 2026-02-10 Listed $499,999 NORTHSTARMLS as Distributed by MLS Grid
- 2024-07-01 Listing Removed — NORTHSTARMLS as Distributed by MLS Grid
- 2024-04-28 Price Changed $539,999 NORTHSTARMLS as Distributed by MLS Grid
- 2024-03-11 Relisted — NORTHSTARMLS as Distributed by MLS Grid
- 2024-03-05 Listed $549,000 NORTHSTARMLS as Distributed by MLS Grid
- 2023-05-10 Listing Removed — NORTHSTARMLS as Distributed by MLS Grid
- 2023-03-07 Price Changed $549,999 NORTHSTARMLS as Distributed by MLS Grid
- 2023-02-02 Listed $575,000 NORTHSTARMLS as Distributed by MLS Grid
- 2022-11-01 Listing Removed — NORTHSTARMLS as Distributed by MLS Grid
- 2022-07-27 Listed $575,000 NORTHSTARMLS as Distributed by MLS Grid
- 2008-07-08 Sold (MLS) $230,000 NORTHSTARMLS as Distributed by MLS Grid
- 2008-05-23 Listing Removed — NORTHSTARMLS as Distributed by MLS Grid
- 2008-02-27 Listed $259,900 NORTHSTARMLS as Distributed by MLS Grid
- 2007-12-01 Listing Removed — NORTHSTARMLS as Distributed by MLS Grid
- 2007-03-01 Listed $315,000 NORTHSTARMLS as Distributed by MLS Grid
- 2006-08-24 Listing Removed — NORTHSTARMLS as Distributed by MLS Grid
- 2006-05-12 Listed $375,000 NORTHSTARMLS as Distributed by MLS Grid
- 2006-04-15 Listing Removed — NORTHSTARMLS as Distributed by MLS Grid
- 2006-03-03 Listed $425,000 NORTHSTARMLS as Distributed by MLS Grid
- 2006-02-26 Listing Removed — NORTHSTARMLS as Distributed by MLS Grid
- 2006-02-19 Listing Removed — NORTHSTARMLS as Distributed by MLS Grid
- 2006-02-10 Listed $425,000 NORTHSTARMLS as Distributed by MLS Grid
- 2005-11-17 Listed $425,000 NORTHSTARMLS as Distributed by MLS Grid
- 2003-09-22 Listing Removed — NORTHSTARMLS as Distributed by MLS Grid
- 2003-07-25 Listed $399,700 NORTHSTARMLS as Distributed by MLS Grid
- 2002-05-15 Listing Removed — NORTHSTARMLS as Distributed by MLS Grid
- 2002-05-09 Listed $239,900 NORTHSTARMLS as Distributed by MLS Grid
Cash-flow waterfall
monthlySold comps — $/sqft
last 12 mo · ≤1 miLoading sold comps…