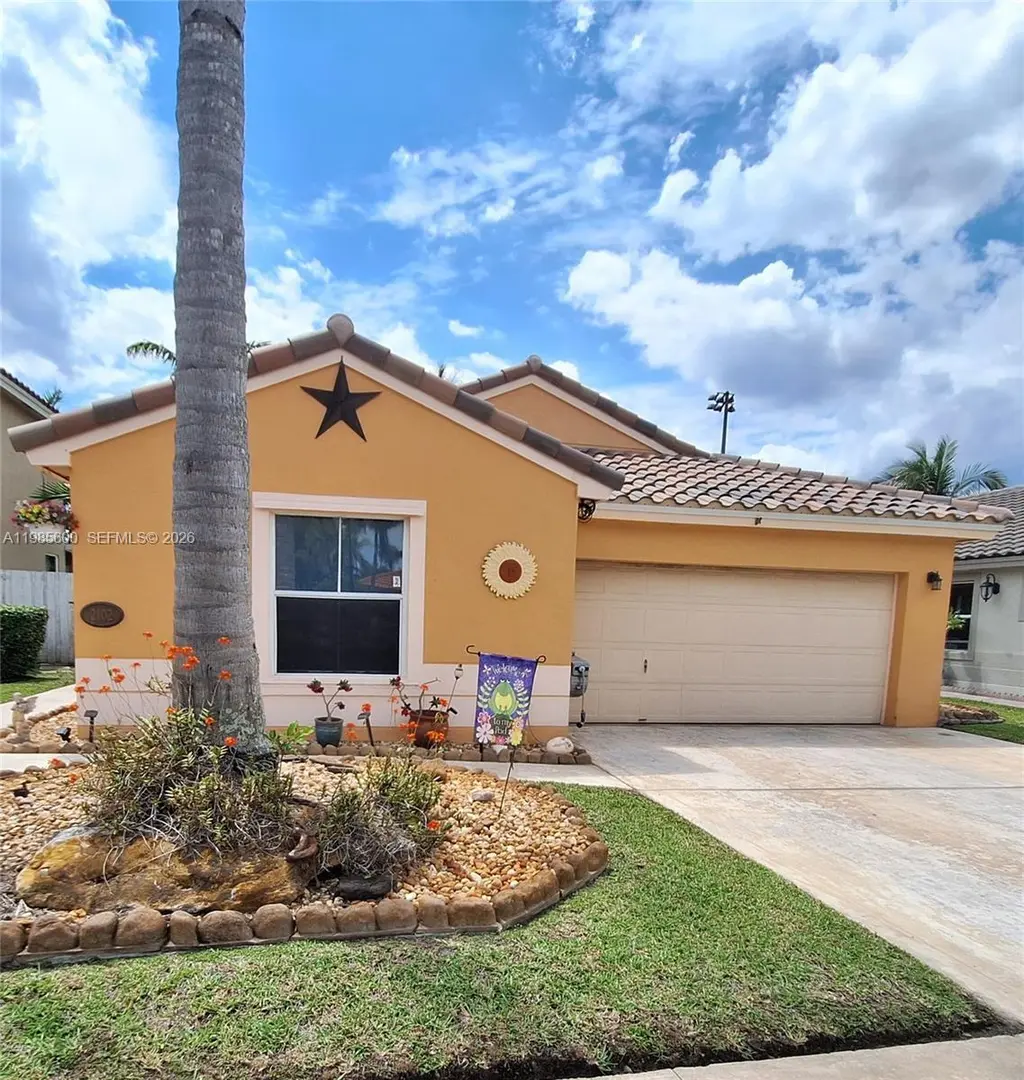
2102 NW 193rd Ave · Pembroke Pines, FL
Flood risk 1/10 · Minimal
- FEMA flood zone
- X (shaded)
- Chance of flooding over 30 yrs
- 0.0%
- Est. flood insurance / yr
- $507 – $1,088
Fire risk 4/10 · Minor
- Est. fire insurance / yr
- $947 – $1,759
Heat risk 9/10 · Severe
- Hot days now (above 107°F)
- 7 days/yr
- Hot days in 30 yrs
- 26 days/yr
Wind risk 10/10 · Severe
- Chance of severe wind over 30 yrs
- 99.0%
Air-quality risk 2/10 · Minimal
- Unhealthy air days now
- 1 days/yr
- Unhealthy air days in 30 yrs
- 2 days/yr
Risk factors via First Street. Map © Google.
Why this score? — see what drove the D+ grade
The composite is a weighted blend of 9 inputs, each scored 0–100. Each bar is that input's sub-score; the figure is the points it added to the 100-point composite (weight × sub-score).
- Cash flow +14.0/30.0
- ARV discount +12.3/15.0
- DSCR +4.2/10.0
- Livability +4.2/5.0
- Schools +4.1/10.0
- 1% rule +3.3/10.0
- Condition / age +2.5/5.0
- Rent growth +2.2/5.0
- Appreciation +0.0/10.0
$575,000
🖨 Deal sheet (PDF) 📄 Offer letter ✓ Due diligence
Listing remarks
* * Brand new roof * * * * Brand new electrical panel * * Charming 3-bedroom/2-bath single-family home in the highly desirable Tapestry community of Pembroke Pines. Enjoy a large fenced extra private backyard that backs onto a huge soccer field ensuring you'll never have backyard neighbors obstructing your view or privacy. Features include a brand new roof with 14 1/2-year warranty, 2-car garage, concrete driveway fitting two cars, concrete walkway leading up to front door, covered open patio with concrete floor — perfect for barbecuing and enjoying the outdoors while birdwatching — updated bathrooms, master bath with shower seat, (indoor laundry) brand new washe
Key facts
- Brand new roof
- Updated bathrooms
- Covered open patio
Tags
Property features AI
Finance
- Other: Pets allowed with size limit (over 20 lbs permitted)
- HOA & community: Homeowners association with monthly fee; Association fee includes common area maintenance, cable TV, and internet
Exterior
- Parking: Attached garage with 2 covered spaces; Driveway; Guest parking; Garage door opener
- Security: Storm/Security shutters
- Utilities: Public water; Public sewer; Cable available
- Home design: Single-story home; Resale property; Faces east; Planned Unit Development (PUD)
- Construction: Block construction; Spanish tile roof
- Exterior features: Patio; Exterior lighting; Storm/security shutters; Paved road access; Less than quarter acre lot
Interior
- Kitchen: Dishwasher; Electric range; Microwave; Refrigerator; Disposal; Freezer
- Bedrooms: Bedroom on main level; Primary bedroom with sitting area and walk-in closet
- Flooring: Laminate flooring
- Bathrooms: 2 full bathrooms
- Heating & cooling: Central heating (electric); Central air conditioning (electric); Ceiling fans
- Interior features: Blinds on windows; High ceilings; Sitting area in primary bedroom; Split bedroom layout; Walk-in closet(s); First floor entry
- Laundry & utility: Washer; Dryer; Electric water heater
Neighborhood map
What this means for you Summary
Snapshot
- This is a 3-bed/2.0-bath single-family listed at $575k.
Deal economics
- At list price, monthly cash flow is $73 ($873/yr) — positive.
- The deal already cash-flows at list — no discount required.
- To meet the 1% rule (rent ≥ 1% of price), the offer needs to be $477k (17.0% below list).
- Recommended offer: $477k (17.0% below list) — sets the bar for 1% rule.
- Cap rate 6.4% vs local median 4.0% in Pembroke Pines — top-decile yield for the area; either an underpriced asset or a hidden risk that comps aren't pricing in. Stress-test before assuming the spread holds.
Location & tenants
- Location reads 83/100 on livability (#54 in FL, #933 nationally) — a professional / high-income tenant draw. Strengths: housing A+, health & safety A+, crime A-; Watch: amenities D+, cost of living D+.
- Broward (suburban): math 42% / reading 53% proficiency, ranked #46 of 73 in FL (top 63%) — families likely to look elsewhere, expect single-tenant / working-renter base with shorter leases.
- Zoned schools: Nova Blanche Forman Elementary (math 35% / reading 55%, grade D-, #1,271 of 2,144 statewide, top 60%, 769 students, 72% FRL); Nova Middle School (math 44% / reading 53%, grade C-, #274 of 571 statewide, top 50%, 1,284 students, 68% FRL); West Broward High School (math 46% / reading 69%, grade C, #125 of 667 statewide, top 19%, 2,586 students, 33% FRL).
- Market conditions: Rents soft (-1.2%/yr); 246 active listings in the ZIP; 40 comparable units currently listed for rent nearby; rentals at typical pace (median 26d on market — plan ~3-4 weeks tenant-placement turnaround); high-income renter base; 2,111 units permitted in Broward County in 2024 (1,265 in 5+ unit buildings).
- This rent runs 39% of the median local income ($146k/yr) — at the standard rent-burdened threshold; future hikes will face affordability resistance.
Forward outlook
- Local home prices are declining (-3.0%/yr); year-one equity from $4k of loan paydown is wiped out by about $17k of value loss. Plan a longer hold.
- Broward County population projected at +34% by 2050 — long-run rental-demand tailwind backs the buy-and-hold thesis.
Negotiation context
- It's been on market 83 days — a 6% lower offer ($540k) is reasonable based on typical stale-listing flexibility.
- Current owner paid $113k; list at $575k implies a 407% gain — meaningful room to come down on a strong offer.
Risks & watch-outs
- Climate carrying-cost: severe wind risk, 99% chance of damaging wind over 30y; extreme-heat days projected 7→26/yr by 2055 (HVAC capex compounding) — expect insurance premiums to compound above CPI over the hold.
Questions for the listing agent
- It's been on market 83 days. Have you received any prior offers? Is the seller open to a 17% concession, seller financing, or rate buy-down credit?
- What does the HOA fee cover, when was the last increase, and are there any pending special assessments or reserve-fund shortfalls?
- Why hasn't it sold? Are there any deal-killer items the seller is aware of (foundation, flood, title, zoning, code violations)?
- Is there a deadline driving the sale (1031 exchange, divorce, estate, relocation)? That informs how much negotiation room exists.
- Schools are A-rated — typically a magnet for longer-tenancy family renters. What's the average tenant stay here, and is there a school-zone premium baked into asking?
- The area grade is low — what's the realistic commute time and amenity access for the typical tenant pool here? Any planned neighborhood developments (good or bad) we should know about?
- What's the average days-on-market for RENTAL listings here right now (not sales)? A rising rental-DOM trend means longer vacancies and softer asking-rent achievability than the comps imply.
- What's the recent tenant-quality profile in this submarket — average credit score on applications, eviction rate, late-payment / NSF rate, and stable-employment percentage? A property-management company in the area should have these aggregated.
- How much new for-sale + rental construction is in the pipeline within 1–3 miles? Heavy new supply typically softens prices + rents 12–24 months out; constrained supply supports both.
Investment metrics
- 1% rule
- 0.83% ✗
- Cap rate
- 6.44%
- Cash-on-cash
- 0.54%
- DSCR
- 1.02
- GRM
- 10.0
CMA / ARV
- ARV (on-the-fly)
- $643,860
- Comps found
- 10
Show comp detail 10 sales within ~0.75 mi
| Address | Dist | Beds/Ba | Sqft | Sold | Price | $/sf | Match |
|---|---|---|---|---|---|---|---|
| 2166 NW 191st Ave | 0.15mi | 3/2.5 | 1,998 (+13%) | 1mo | $580,000 | $290 | 68 |
| 19237 NW 13th St | 0.28mi | 3/2.5 | 1,984 (+12%) | 1mo | $635,000 | $320 | 63 |
| 18801 NW 5th St | 0.71mi | 3/2.0 | 1,782 (+1%) | 3mo | $550,000 | $309 | 63 |
| 19179 NW 22nd St | 0.12mi | 4/2.0 (+1) | 1,878 (+6%) | 23mo | $659,000 | $351 | 59 |
| 19185 NW 22nd St | 0.11mi | 3/2.5 | 1,998 (+13%) | 16mo | $700,000 | $350 | 58 |
| 18921 NW 10 St | 0.66mi | 3/2.0 | 1,650 (-6%) | 2mo | $602,000 | $365 | 56 |
| 18951 NW 10th Ter | 0.62mi | 3/2.0 | 1,624 (-8%) | 7mo | $631,100 | $389 | 52 |
| 18731 NW 12th St | 0.60mi | 3/2.0 | 1,624 (-8%) | 12mo | $640,000 | $394 | 49 |
| 18628 NW 24th Pl | 0.72mi | 3/2.0 | 1,648 (-7%) | 13mo | $775,000 | $470 | 44 |
| 451 NW 190th Ave | 0.68mi | 3/2.0 | 1,632 (-8%) | 18mo | $650,000 | $398 | 41 |
Match score weights: distance 35% · size 25% · config 20% · recency 20%. Top-matched comps best support the ARV.
Projected returns pro-forma
-3.0% appreciation · 0.0% rent growth · sell at horizon
- IRR
- -18.6%
- Equity multiple
- 0.36×
- Total profit
- $-102,629
- Equity at exit
- $85,734
- IRR
- -18.0%
- Equity multiple
- 0.14×
- Total profit
- $-137,862
- Equity at exit
- $49,715
Cash invested: $161,000 (down + closing). Projections, not guarantees.
Landlord ↔ Tenant lean methodology
- Overall (STATE)
- 87 Strongly Landlord-Friendly
- State Florida
- 87 Strongly Landlord-Friendly · R+3
- County
- — inherits STATE
- City
- — inherits STATE
ZIP-level market 33029
- Home prices YoY
- -18.3%
- Rents YoY
- -1.2%
- Active inventory
- 246
- Price-to-rent
- 10.0×
Monthly cashflow live
- Estimated rent
- $4,774 high interval (Pro) →
- Mortgage (P&I)
- −$3,015
- Tax from tax record
- −$261 /mo · $3,127/yr
- Insurance
- −$240
- HOA
- −$183
- Vacancy / Maint / Mgmt
- −$1,002
- Net cashflow
- $73
Break-even live
Sensitivity live
| Price | -10% $398 | -5% $235 | +0% $73 | +5% $-90 | +10% $-253 |
|---|---|---|---|---|---|
| Rent | -10% $-304 | -5% $-116 | +0% $73 | +5% $261 | +10% $450 |
| Rate | -1.0pp $362 | -0.5pp $219 | base $73 | +0.5pp $-76 | +1.0pp $-228 |
UW: 25.0% down · 7.5% · 30yr · 1.5% tax · 5.0% vac · 8.0% maint · 8.0% mgmt
Financing live
Cash to close
- Down payment
- $143,750
- Closing costs
- $17,250
- Reserves months
- —
- Total cash needed
- —
Loan-product check · same deal, 3 products live
Conventional
25% down · 7.5% · 30yr
- Down + closing
- —
- Monthly P&I
- —
- Monthly cashflow
- —
- DSCR
- —
- Eligible?
- —
Personal DTI + credit; lowest rate.
DSCR
20% down · 8.5% · 30yr
- Down + closing
- —
- Monthly P&I
- —
- Monthly cashflow
- —
- DSCR
- —
- Eligible?
- —
No personal income docs; deal must DSCR.
Hard money
10% down · 12.0% · 12mo
- Down + closing
- —
- Monthly P&I
- —
- Monthly cashflow
- —
- DSCR
- —
- Eligible?
- —
Short-term bridge; refi at stabilization.
Rent comps 40 comps
| Address | Beds | Baths | Sqft | Rent | $/sqft | DOM | Units | Dist |
|---|---|---|---|---|---|---|---|---|
| 19199 NW 19th St Pembroke Pines, FL | 4.0 | 2.5 | 2166 | $3,900 | $1.80 | 14d | 1 | 0.08mi |
| 19227 NW 22nd St Unit 19227 Pembroke Pines, FL | 3.0 | 2.0 | 1764 | $4,100 | $2.32 | 26d | 1 | 0.09mi |
| 19185 NW 22nd St Unit 19185 Pembroke Pines, FL | 3.0 | 2.5 | 1998 | $6,490 | $3.25 | 15d | 1 | 0.11mi |
| 19185 NW 22nd St Unit 19185 Pembroke Pines, FL | 3.0 | 2.5 | 1998 | $6,190 | $3.10 | 7d | 1 | 0.11mi |
| 19257 NW 13th St Pembroke Pines, FL | 4.0 | 2.5 | 2144 | $3,800 | $1.77 | 26d | 1 | 0.22mi |
| 1298 NW 192nd Ter Pembroke Pines, FL | 4.0 | 3.0 | 2144 | $4,850 | $2.26 | 26d | 1 | 0.29mi |
| 1325 NW 192nd Ter Unit 1325 Pembroke Pines, FL | 4.0 | 2.0 | 1483 | $3,600 | $2.43 | 9d | 1 | 0.31mi |
| 1325 NW 192nd Ter Unit 1325 Pembroke Pines, FL | 3.0 | 2.0 | 1483 | $3,700 | $2.49 | 26d | 1 | 0.31mi |
| 1230 NW 192nd Ter Pembroke Pines, FL | 4.0 | 2.5 | 2144 | $3,820 | $1.78 | 13d | 1 | 0.33mi |
| 19010 NW 10th St Pembroke Pines, FL | 4.0 | 3.0 | 2391 | $4,800 | $2.01 | 26d | 1 | 0.53mi |
| 1320 NW 185th Ave Pembroke Pines, FL | 4.0 | 3.0 | 2362 | $5,500 | $2.33 | 26d | 1 | 0.56mi |
| 18801 NW 12th St Unit 18801 Pembroke Pines, FL | 3.0 | 2.5 | 2071 | $4,100 | $1.98 | 26d | 1 | 0.56mi |
| 18801 NW 12th St Unit 18801 Pembroke Pines, FL | 3.0 | 2.5 | 2071 | $4,100 | $1.98 | 9d | 1 | 0.56mi |
| 19920 NW 9th Dr Unit 19920 Pembroke Pines, FL | 4.0 | 2.5 | 2483 | $5,800 | $2.34 | 19d | 1 | 0.61mi |
| 19920 NW 9th Dr Pembroke Pines, FL | 4.0 | 2.5 | 2479 | $5,800 | $2.34 | 21d | 1 | 0.61mi |
| 18910 NW 10th Ter Pembroke Pines, FL | 4.0 | 2.0 | 2071 | $5,000 | $2.41 | 26d | 1 | 0.63mi |
| 491 NW 188th Ter Unit 491 Pembroke Pines, FL | 3.0 | 2.0 | 1782 | $3,600 | $2.02 | 26d | 1 | 0.72mi |
| 18430 NW 11th St Pembroke Pines, FL | 3.0 | 2.0 | 2035 | $3,950 | $1.94 | 26d | 1 | 0.78mi |
| 18430 NW 11th St Pembroke Pines, FL | 3.0 | 2.0 | 2035 | $3,950 | $1.94 | 4d | 1 | 0.78mi |
| 19440 NW 2nd St Pembroke Pines, FL | 4.0 | 3.0 | 2505 | $5,200 | $2.08 | 26d | 1 | 0.88mi |
| 2010 NW 182nd Ter Pembroke Pines, FL | 3.0 | 2.0 | 1731 | $3,700 | $2.14 | 26d | 1 | 1.02mi |
| 18426 SW 2nd St Pembroke Pines, FL | 3.0 | 2.5 | 1536 | $3,950 | $2.57 | 16d | 1 | 1.03mi |
| 18402 SW 2nd St Pembroke Pines, FL | 4.0 | 2.5 | 1787 | $4,200 | $2.35 | 18d | 1 | 1.03mi |
| 18402 SW 2nd St Pembroke Pines, FL | 4.0 | 2.5 | 1787 | $4,200 | $2.35 | 3d | 1 | 1.03mi |
| 19440 SW 2nd St Pembroke Pines, FL | 4.0 | 2.5 | 2505 | $5,200 | $2.08 | 26d | 1 | 1.04mi |
| 19440 SW 2nd St Unit 19440 Pembroke Pines, FL | 4.0 | 2.5 | 2505 | $5,200 | $2.08 | 17d | 1 | 1.04mi |
| 18333 NW 7th St Unit 1833 Pembroke Pines, FL | 3.0 | 2.0 | 1262 | $3,500 | $2.77 | 26d | 1 | 1.08mi |
| 18273 NW 7th St Unit 1 Pembroke Pines, FL | 3.0 | 2.0 | 1262 | $3,700 | $2.93 | 26d | 1 | 1.10mi |
| 19317 SW 65th St Fort Lauderdale, FL | 4.0 | 2.5 | 2366 | $4,150 | $1.75 | 26d | 1 | 1.12mi |
| 303 SW 190th Ter Pembroke Pines, FL | 4.0 | 2.5 | 2232 | $6,300 | $2.82 | 26d | 1 | 1.16mi |
| 105 SW 184th Pl Pembroke Pines, FL | 3.0 | 2.5 | 1760 | $3,500 | $1.99 | 26d | 1 | 1.16mi |
| 19213 SW 4th St Pembroke Pines, FL | 3.0 | 2.0 | 1942 | $4,300 | $2.21 | 24d | 1 | 1.18mi |
| 19871 SW 3rd Pl Pembroke Pines, FL | 4.0 | 3.0 | 2554 | $5,600 | $2.19 | 24d | 1 | 1.21mi |
| 19871 SW 3rd Pl Pembroke Pines, FL | 4.0 | 3.0 | 2554 | $5,600 | $2.19 | 12d | 1 | 1.21mi |
| 106 SW 184th Pl Pembroke Pines, FL | 3.0 | 2.5 | 1281 | $3,100 | $2.42 | 9d | 1 | 1.23mi |
| 106 SW 184th Ave Unit 106 Pembroke Pines, FL | 3.0 | 2.5 | 1281 | $3,100 | $2.42 | 12d | 1 | 1.23mi |
| 685 SW 198th Ter Pembroke Pines, FL | 4.0 | 4.0 | 2554 | $4,800 | $1.88 | 0d | 1 | 1.38mi |
| 17851 NW 19th St Pembroke Pines, FL | 2.0 | 2.0 | 1652 | $4,100 | $2.48 | 26d | 1 | 1.40mi |
| 6291 SW 188th Ave Southwest Ranches, FL | 3.0 | 2.0 | 1720 | $4,600 | $2.67 | 26d | 1 | 1.41mi |
| 210 NW 207th Way Pembroke Pines, FL | 3.0 | 2.0 | 1620 | $3,395 | $2.10 | 0d | 1 | 1.45mi |
HOA detail
- Monthly dues
- $183 · $2,196/yr
- Likely covers
- electric
Listing history 12 events
-
2026-06-09days on market $575,000 Active 83 DOM
-
2026-06-08days on market $575,000 Active 82 DOM
-
2026-06-07days on market $575,000 Active 81 DOM
-
2026-06-04days on market $575,000 Active 78 DOM
-
2026-06-03days on market $575,000 Active 77 DOM
-
2026-06-02days on market $575,000 Active 76 DOM
-
2026-06-01days on market $575,000 Active 75 DOM
-
2026-05-31days on market $575,000 Active 74 DOM
-
2026-04-15price $600,000
-
2026-03-26price $613,000
-
2026-03-18$620,000 Active
-
1994-06-13soldstatus $113,400
ⓘ Source: listings_history table (triggers on properties + properties_extension) + one-shot
backfill from property_details.listing_events for pre-trigger history.
Tax reassessment forecast FL · Resets to sale price
- Current annual tax
- $3,127 · $261/mo
- Projected year-2 tax
- $4,772 · $398/mo
- Expected delta
- +$1,645/yr (+$137/mo · 52.6%)
ⓘ Screening estimate from a state-policy table — verify with the county assessor before closing.
Climate risk First Street
- Flood 1/10 Low FEMA zone X (shaded) · 0% chance over 30 yrs
- Wildfire 4/10 Moderate
- Heat 9/10 Extreme 7 d/yr ≥107°F today · 26 d/yr by 30 yrs out
- Wind 10/10 Extreme 99% chance of damaging wind over 30 yrs
- Air quality 2/10 Low 1 unhealthy d/yr today · 2 by 30 yrs out
Nearby sold comps map
Loading sold comps map…
Walkable amenities ~0.75 mi
Loading nearby amenities…
Taxation est. · year 1
- Rental income
- $57,285
- − Mortgage interest
- −$32,209
- − Property taxes
- −$3,127
- − Insurance
- −$2,875
- − Repairs & maintenance
- −$4,583
- − Management
- −$4,583
- − HOA
- −$2,196
- − Depreciation
- −$16,727
- Taxable loss
- −$9,015
- Est. tax savings @ 24.0%
- +$2,164
- After-tax cash flow
- $3,036/yr
For passive investors: Depreciation is non-cash, so a rental often shows a tax loss while cash-flowing — sheltering income. Rental losses are passive: they offset passive income freely, and up to $25,000/yr can offset ordinary (W-2) income if you actively participate and your MAGI is under $100k (phasing out to $0 by $150k); unused losses carry forward. On sale, claimed depreciation is recaptured at up to 25%, and gains may owe capital-gains tax (a 1031 exchange can defer both). Figures are a year-1 estimate at your 24.0% rate — not tax advice; consult a CPA.
Schools (NCES district)
- District
- Broward
- NCES district ID
- 1200180
- Math proficiency
- 42% ▼ -18.00%
- Reading proficiency
- 53% ▼ -5.00%
- Median HH income
- $52,139
- Composite
- 40.88/100
- National rank
- #3621
- State rank
- #46 of 73 in FL
Livability — Pembroke Pines
- Score
- 83/100
- State rank
- #54
- US rank
- #933
Category grades
Schools grade is shown separately in the Schools card above.
Census & demographics
- Census place
- Pembroke Pines, FL
- County
- Broward County · 1,963,430 people
- City population
- 180,224
- Metro
- Miami-Fort Lauderdale-Pompano Beach, FL
- Population (ZIP)
- 44,070
- Household income
- $146,237
- Rent vs Own
- Severe rent burden
- 307.0
Population outlook (Broward County) Hauer SSP2
- Today (2025)
- 2,207,033 people
- By 2030
- 2,360,704 · +7.0%
- By 2040
- 2,661,208 · +20.6%
- By 2050
- 2,946,698 · +33.5%
- By 2075
- 3,602,273 · +63.2%
- By 2100
- 3,970,984 · +79.9%
Race, ethnicity, and origin ACS 2023
- Neighborhood character
- Highly diverse neighborhood (Simpson 0.70)
- Race & ethnicity
- Hispanic / Latino 43% Two or more races 29% White 27% Black 20% Asian 7%
- Hispanic origin (detail)
- Mexican 2% Puerto Rican 5% Cuban 14% Dominican 3%
- Common ancestry
- Hispanic 2% Russian 1% Estonian 1%
- Foreign-born
- 33% · Canada, Jamaica, China
- Languages at home
- 53% English-only · Spanish 38% Other Indo-European 4% French/Haitian/Cajun 2%
Political lean MEDSL · Broward
- 2024 margin
- D (+17.0) · D 58.0% · R 41.0%
- 2008→2024 swing
- -17.8pp toward R · 2008: 34.7pp · 2024: 17.0pp
- All cycles
- 2024: D+17.0 2020: D+29.8 2016: D+35.0 2012: D+34.9 2008: D+34.7
Not yet ingested
- Civics
- —
Market trends
- HPI YoY
- ▼ -83.68%
- Current HPI
- 373.7752
- Rent YoY
- ▼ -1.17%
- Metro
- Miami-Fort Lauderdale-Pompano Beach, FL
- State GDP YoY
- ▲ 3.28%
- F500 in state
- 36
Industry mix (Fortune 500 HQ in FL)
| Industry | F500 HQs | Revenue |
|---|---|---|
| Industrial Technology | 2 | $29B |
|
||
| Insurance | 2 | $17B |
|
||
| Retail | 1 | $60B |
|
||
| Technology Distribution | 1 | $58B |
|
||
| Homebuilding | 1 | $35B |
|
||
| Technology Manufacturing | 1 | $35B |
|
||
Price history
+429.1% since first listed4 events — show timeline
- 2026-04-15 Price Changed $600,000 MARMLS
- 2026-03-26 Price Changed $613,000 MARMLS
- 2026-03-18 Listed $620,000 MARMLS
- 1994-06-13 Sold (Public Records) $113,400 Public Records
Property tax history
+2.1%/yrLatest (2025): $3,127 · -0.2% YoY. Source: county tax records.
Cash-flow waterfall
monthlySold comps — $/sqft
last 12 mo · ≤1 miLoading sold comps…