1401 Beech Ave · Cincinnati, OH
Flood risk 1/10 · Minimal
- FEMA flood zone
- X (unshaded)
- Chance of flooding over 30 yrs
- 0.0%
- Est. flood insurance / yr
- $473 – $860
Fire risk 1/10 · Minimal
- Est. fire insurance / yr
- $713 – $1,323
Heat risk 4/10 · Minor
- Hot days now (above 103°F)
- 7 days/yr
- Hot days in 30 yrs
- 19 days/yr
Wind risk 2/10 · Minimal
- Chance of severe wind over 30 yrs
- 1.0%
Air-quality risk 3/10 · Minor
- Unhealthy air days now
- 3 days/yr
- Unhealthy air days in 30 yrs
- 5 days/yr
Risk factors via First Street. Map © Google.
Why this score? — see what drove the D grade
The composite is a weighted blend of 9 inputs, each scored 0–100. Each bar is that input's sub-score; the figure is the points it added to the 100-point composite (weight × sub-score).
- Cash flow +13.9/30.0
- ARV discount +9.2/15.0
- DSCR +4.2/10.0
- Livability +4.0/5.0
- 1% rule +3.6/10.0
- Rent growth +3.3/5.0
- Schools +2.5/10.0
- Condition / age +2.5/5.0
- Appreciation +0.0/10.0
$189,000
🖨 Deal sheet 📄 Offer letter ✓ Due diligence
Listing remarks
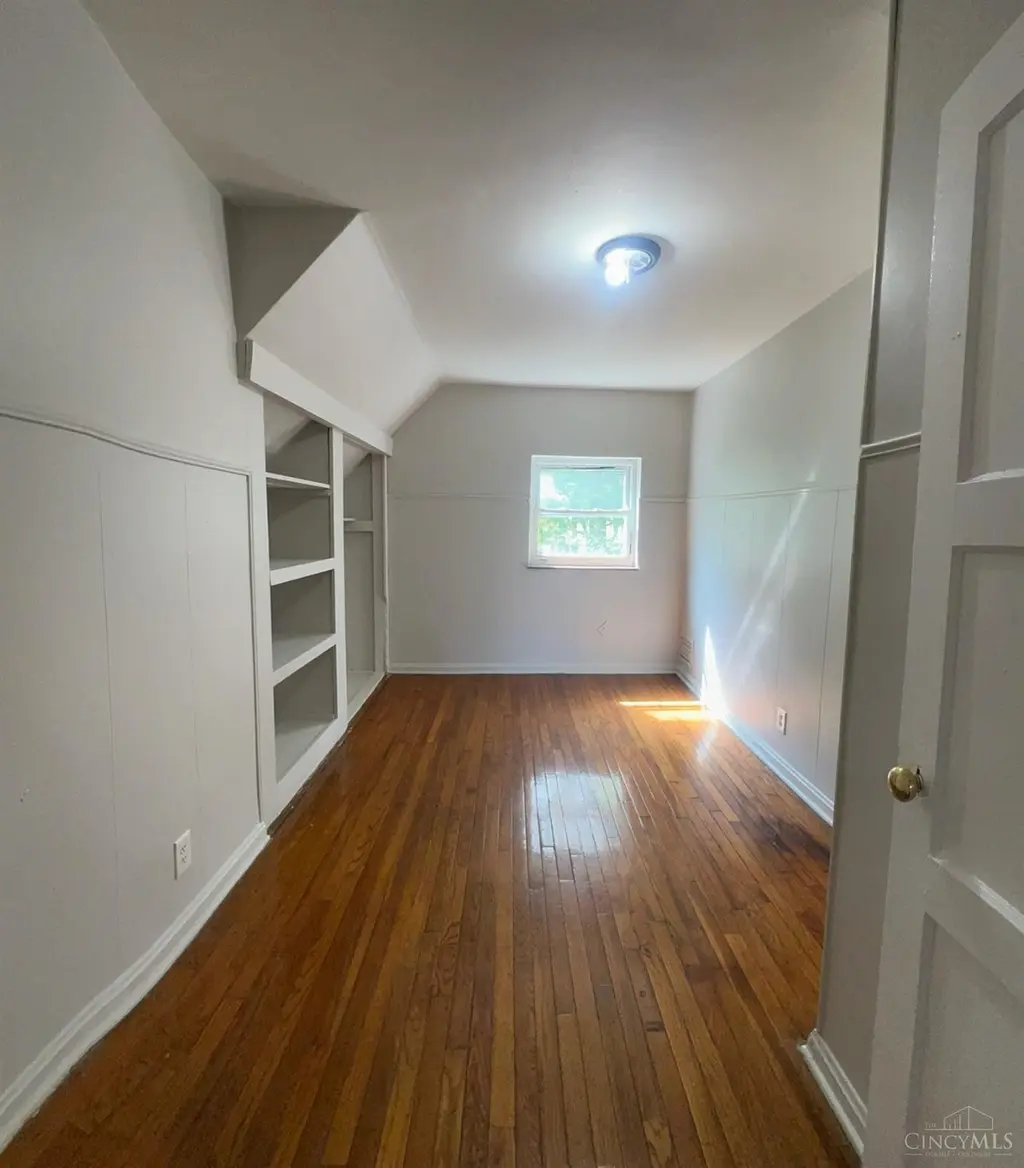
This is your opportunity to own a beautiful home with bedrooms split on 2 levels. This home features natural wood floors, a large lot, private yard, 2 full baths as well as a basement bath. one car garage as well as a long driveway makes ample parking spaces available. welcome to view this GEM. ..
Key facts
- Natural wood floors
- Basement bath
- Large lot
Tags
Property features AI
Finance
- Other: Zoned residential
- HOA & community: No HOA
Exterior
- Parking: Built-in, attached front garage with 1 garage space
- Utilities: Public water; Public sewer; Natural gas
- Home design: Cape Cod style; Single-family home; Two levels; Poured foundation
- Construction: Brick and stone exterior; Shingle roof
- Exterior features: Patio; Porch; Fencing: Other
Interior
- Kitchen: Butler's pantry; Pantry; Eat-in kitchen with walkout; Wood cabinets; Laminate flooring in kitchen
- Bedrooms: 5 bedrooms total; Primary bedroom (15 x 15) on level 1; Bedroom 2 (11 x 12) on level 1; Bedroom 3 (10 x 9) on level 2; Bedroom 4 (12 x 12) on level 2; Bedroom 5 (11 x 10) on level 2
- Flooring: Wood floors in living and dining areas; Laminate floor in kitchen; Wood floor in foyer
- Bathrooms: Two full bathrooms and one half bath; Primary bathroom includes tub and shower; Full bathroom on level 1; Full bathroom on level 2
- Heating & cooling: Forced-air heating; Window cooling units; Gas water heating; HVAC with thermostat (smart technology)
- Interior features: Natural woodwork; Full basement with walkout; Basement has bath rough-in and concrete floor; 10 total rooms
- Laundry & utility: Basement utility area
Neighborhood map
What this means for you Summary
Snapshot
- This is a 4-bed/2.0-bath single-family listed at $189k.
Deal economics
- At list price, monthly cash flow is $21 ($252/yr) — positive.
- The deal already cash-flows at list — no discount required.
- To meet the 1% rule (rent ≥ 1% of price), the offer needs to be $162k (14.5% below list).
- Recommended offer: $162k (14.5% below list) — sets the bar for 1% rule.
- Cap rate 6.4% vs local median 3.9% in Cincinnati — top-decile yield for the area; either an underpriced asset or a hidden risk that comps aren't pricing in. Stress-test before assuming the spread holds.
Location & tenants
- Location reads 80/100 on livability (#130 in OH, #1,856 nationally) — a professional / high-income tenant draw. Strengths: amenities A+, commute A+, cost of living A+; Watch: employment D, crime F.
- Cincinnati Public Schools (urban): math 25% / reading 36% proficiency, ranked #581 of 656 in OH (top 89%) — families likely to look elsewhere, expect single-tenant / working-renter base with shorter leases; 70% free/reduced lunch — lower-income household profile, screen leases tightly.
- Market conditions: Rents rising (+3.3%/yr); 69 active listings in the ZIP; 25 comparable units currently listed for rent nearby; rentals at typical pace (median 21d on market — plan ~3-4 weeks tenant-placement turnaround); lower-income renter base — watch delinquency; 801 units permitted in Hamilton County in 2024 (190 in 5+ unit buildings).
- This rent runs 44% of the median local income ($44k/yr) — at the standard rent-burdened threshold; future hikes will face affordability resistance.
Forward outlook
- Local home prices are declining (-3.0%/yr); year-one equity from $1k of loan paydown is wiped out by about $6k of value loss. Plan a longer hold.
Negotiation context
- Only 6 days on market — expect competitive offers; lowballing is unlikely to land.
- 6 sale attempts since 26y ago with the ask held roughly flat each time — persistent listings suggest the price (not the market) is what's stuck; bring a comps-based counter.
Risks & watch-outs
- Watch-outs: built in 1946 — expect roof / HVAC / electrical / plumbing capex.
Questions for the listing agent
- Built in 1946 — when were the roof, HVAC, electrical panel, plumbing, and water heater last replaced?
- Is there a deadline driving the sale (1031 exchange, divorce, estate, relocation)? That informs how much negotiation room exists.
- Schools are B-rated — typically a magnet for longer-tenancy family renters. What's the average tenant stay here, and is there a school-zone premium baked into asking?
- Crime grade is F in this area — have there been break-ins, vandalism, or insurance claims at this property in the last 3 years? What carrier currently insures it and at what premium?
- The area grade is low — what's the realistic commute time and amenity access for the typical tenant pool here? Any planned neighborhood developments (good or bad) we should know about?
- What's the average days-on-market for RENTAL listings here right now (not sales)? A rising rental-DOM trend means longer vacancies and softer asking-rent achievability than the comps imply.
- What's the recent tenant-quality profile in this submarket — average credit score on applications, eviction rate, late-payment / NSF rate, and stable-employment percentage? A property-management company in the area should have these aggregated.
- How much new for-sale + rental construction is in the pipeline within 1–3 miles? Heavy new supply typically softens prices + rents 12–24 months out; constrained supply supports both.
Investment metrics
- 1% rule
- 0.86% ✗
- Cap rate
- 6.43%
- Cash-on-cash
- 0.48%
- DSCR
- 1.02
- GRM
- 9.7
CMA / ARV
- ARV (on-the-fly)
- $196,560
- Comps found
- 12
Show comp detail 12 sales within ~0.75 mi
| Address | Dist | Beds/Ba | Sqft | Sold | Price | $/sf | Match |
|---|---|---|---|---|---|---|---|
| 4012 Fawnhill Ln | 0.37mi | 3/2.0 (-1) | 1,673 (+2%) | 7mo | $139,000 | $83 | 68 |
| 1237 Carson Ave | 0.39mi | 4/1.5 | 1,776 (+8%) | 5mo | $220,000 | $124 | 61 |
| 1113 Gilsey Ave | 0.50mi | 3/2.0 (-1) | 1,560 (-5%) | 3mo | $190,000 | $122 | 61 |
| 1634 Gilsey Ave | 0.20mi | 4/2.0 | 1,398 (-15%) | 7mo | $120,000 | $86 | 61 |
| 1242 Ross Ave | 0.32mi | 3/2.0 (-1) | 1,821 (+11%) | 4mo | $103,000 | $57 | 58 |
| 1215 Ridlen Ave | 0.39mi | 4/2.0 | 1,454 (-11%) | 7mo | $195,000 | $134 | 57 |
| 1120 Carson Ave | 0.50mi | 3/2.0 (-1) | 1,756 (+7%) | 7mo | $193,000 | $110 | 54 |
| 1697 Atson Ln | 0.31mi | 3/1.5 (-1) | 1,840 (+12%) | 6mo | $175,000 | $95 | 53 |
| 1114 Winfield Ave | 0.55mi | 3/2.0 (-1) | 1,879 (+15%) | 0mo | $234,000 | $125 | 45 |
| 1027 Woodlawn Ave | 0.74mi | 3/2.0 (-1) | 1,469 (-10%) | 5mo | $176,500 | $120 | 39 |
| 928 Harris Ave | 0.69mi | 3/1.5 (-1) | 1,806 (+10%) | 7mo | $225,000 | $125 | 38 |
| 836 Harris Ave | 0.75mi | 3/1.5 (-1) | 1,464 (-11%) | 4mo | $151,000 | $103 | 37 |
Match score weights: distance 35% · size 25% · config 20% · recency 20%. Top-matched comps best support the ARV.
Projected returns pro-forma
-3.0% appreciation · 3.3% rent growth · sell at horizon
- IRR
- -15.2%
- Equity multiple
- 0.46×
- Total profit
- $-28,808
- Equity at exit
- $28,181
- IRR
- -6.2%
- Equity multiple
- 0.60×
- Total profit
- $-21,371
- Equity at exit
- $16,341
Cash invested: $52,920 (down + closing). Projections, not guarantees.
Landlord ↔ Tenant lean methodology
- Overall (STATE)
- 73 Landlord-Friendly
- State Ohio
- 73 Landlord-Friendly · R+6
- County
- — inherits STATE
- City
- — inherits STATE
ZIP-level market 45205
- Rents YoY
- 3.3%
- Active inventory
- 69
- Price-to-rent
- 9.7×
Monthly cashflow live
- Estimated rent
- $1,616 high interval (Pro) →
- Mortgage (P&I)
- −$991
- Tax from tax record
- −$186 /mo · $2,233/yr
- Insurance
- −$79
- HOA
- −$0
- Vacancy / Maint / Mgmt
- −$339
- Net cashflow
- $21
Break-even live
UW: 25.0% down · 7.5% · 30yr · 1.5% tax · 5.0% vac · 8.0% maint · 8.0% mgmt
Financing live
Cash to close
- Down payment
- $47,250
- Closing costs
- $5,670
- Reserves months
- —
- Total cash needed
- —
Loan-product check · same deal, 3 products live
Conventional
25% down · 7.5% · 30yr
- Down + closing
- —
- Monthly P&I
- —
- Monthly cashflow
- —
- DSCR
- —
- Eligible?
- —
Personal DTI + credit; lowest rate.
DSCR
20% down · 8.5% · 30yr
- Down + closing
- —
- Monthly P&I
- —
- Monthly cashflow
- —
- DSCR
- —
- Eligible?
- —
No personal income docs; deal must DSCR.
Hard money
10% down · 12.0% · 12mo
- Down + closing
- —
- Monthly P&I
- —
- Monthly cashflow
- —
- DSCR
- —
- Eligible?
- —
Short-term bridge; refi at stabilization.
Rent comps 25 comps
| Address | Beds | Baths | Sqft | Rent | $/sqft | DOM | Units | Dist |
|---|---|---|---|---|---|---|---|---|
| 1311 Manss Ave Cincinnati, OH | 4.0 | 1.0 | 1409 | $1,295 | $0.92 | 4d | 1 | 0.11mi |
| 1620 Minion Ave Cincinnati, OH | 4.0 | 2.0 | 1845 | $1,550 | $0.84 | 20d | 1 | 0.12mi |
| 1607 Minion Ave Cincinnati, OH | 3.0 | 1.5 | 1066 | $1,675 | $1.57 | 23d | 1 | 0.13mi |
| 3772 W Liberty St Cincinnati, OH | 3.0 | 1.0 | 1066 | $1,350 | $1.27 | 4d | 1 | 0.16mi |
| 1214 Gilsey Ave Cincinnati, OH | 3.0 | 1.0 | 1300 | $1,300 | $1.00 | 20d | 1 | 0.36mi |
| 1214 Gilsey Ave Cincinnati, OH | 3.0 | 1.0 | 1300 | $1,300 | $1.00 | 23d | 1 | 0.36mi |
| 1233 Dewey Ave Cincinnati, OH | 3.0 | 1.0 | 1411 | $1,375 | $0.97 | 4d | 1 | 0.37mi |
| 3666 Glenway Ave Cincinnati, OH | 3.0 | 1.0 | 1339 | $1,250 | $0.93 | 23d | 1 | 0.38mi |
| 868 Academy Ave Unit 2 Cincinnati, OH | 4.0 | 1.0 | 1100 | $1,699 | $1.54 | 23d | 1 | 0.69mi |
| 862 Academy Ave Unit 2 Cincinnati, OH | 4.0 | 1.0 | 1627 | $1,450 | $0.89 | 17d | 1 | 0.71mi |
| 943 Rosemont Ave Cincinnati, OH | 5.0 | 1.5 | 2132 | $1,700 | $0.80 | 16d | 1 | 0.72mi |
| 931 Olive Ave Cincinnati, OH | 3.0 | 1.0 | 1852 | $1,500 | $0.81 | 2d | 1 | 0.72mi |
| 905 Suire Ave Unit 2 Cincinnati, OH | 4.0 | 1.0 | 1699 | $1,400 | $0.82 | 23d | 1 | 0.76mi |
| 928 Fairbanks Ave Cincinnati, OH | 5.0 | 2.0 | 1530 | $2,200 | $1.44 | 43d | 1 | 0.87mi |
| 916 Fairbanks Ave Cincinnati, OH | 4.0 | 1.0 | 1438 | $1,695 | $1.18 | 23d | 1 | 0.90mi |
| 1014 Considine Ave Cincinnati, OH | 4.0 | 2.0 | 2200 | $2,000 | $0.91 | 1d | 1 | 0.97mi |
| 1723 Tuxworth Ave Cincinnati, OH | 3.0 | 2.0 | 1587 | $1,800 | $1.13 | 23d | 1 | 1.00mi |
| 4227 W 8th St Cincinnati, OH | 3.0 | 2.0 | 1832 | $2,050 | $1.12 | 1d | 1 | 1.09mi |
| 2504 White St Apt 5 Cincinnati, OH | 3.0 | 2.0 | 1150 | $1,150 | $1.00 | 23d | 1 | 1.12mi |
| 2621 Gehrum Ln Cincinnati, OH | 3.0 | 1.0 | 1373 | $1,850 | $1.35 | 23d | 1 | 1.13mi |
| 927 Chateau Ave Cincinnati, OH | 3.0 | 1.0 | 1354 | $1,550 | $1.14 | 21d | 1 | 1.19mi |
| 2682 Lafeuille Cir Cincinnati, OH | 2.0–3.0 | 1.0–2.0 | 950 | $1,574 | $1.66 | 3d | 16 | 1.19mi |
| 2706 E Tower Dr Cincinnati, OH | 1.0–3.0 | 1.0–2.0 | 951 | $1,520 | $1.60 | 1d | 61 | 1.27mi |
| 1852 Knox St Cincinnati, OH | 4.0 | 1.5 | 1747 | $1,850 | $1.06 | 23d | 1 | 1.30mi |
| 4284 Foley Rd Cincinnati, OH | 3.0 | 2.0 | 1242 | $2,800 | $2.25 | 43d | 1 | 1.33mi |
Listing history 6 events
-
2026-06-18days on market $189,000 Active 6 DOM
-
2026-06-17days on market $189,000 Active 5 DOM
-
2026-06-16days on market $189,000 Active 4 DOM
-
2026-06-15days on market $189,000 Active 3 DOM
-
2026-06-13remarks 298-char remark
-
2026-06-13$189,000 Active 1 DOM
ⓘ Source: listings_history table (triggers on properties + properties_extension) + one-shot
backfill from property_details.listing_events for pre-trigger history.
Tax reassessment forecast OH · Partial reset (capped growth)
- Current annual tax
- $2,233 · $186/mo
- Projected year-2 tax
- $2,591 · $216/mo
- Expected delta
- +$358/yr (+$30/mo · 16.0%)
ⓘ Screening estimate from a state-policy table — verify with the county assessor before closing.
Climate risk First Street
- Flood 1/10 Low FEMA zone X (unshaded) · 0% chance over 30 yrs
- Wildfire 1/10 Low
- Heat 4/10 Moderate 7 d/yr ≥103°F today · 19 d/yr by 30 yrs out
- Wind 2/10 Low 100% chance of damaging wind over 30 yrs
- Air quality 3/10 Moderate 3 unhealthy d/yr today · 5 by 30 yrs out
Nearby sold comps map
Loading sold comps map…
Walkable amenities ~0.75 mi
Loading nearby amenities…
Taxation est. · year 1
- Rental income
- $19,397
- − Mortgage interest
- −$10,587
- − Property taxes
- −$2,233
- − Insurance
- −$945
- − Repairs & maintenance
- −$1,552
- − Management
- −$1,552
- − Depreciation
- −$5,498
- Taxable loss
- −$2,970
- Est. tax savings @ 24.0%
- +$713
- After-tax cash flow
- $964/yr
For passive investors: Depreciation is non-cash, so a rental often shows a tax loss while cash-flowing — sheltering income. Rental losses are passive: they offset passive income freely, and up to $25,000/yr can offset ordinary (W-2) income if you actively participate and your MAGI is under $100k (phasing out to $0 by $150k); unused losses carry forward. On sale, claimed depreciation is recaptured at up to 25%, and gains may owe capital-gains tax (a 1031 exchange can defer both). Figures are a year-1 estimate at your 24.0% rate — not tax advice; consult a CPA.
Schools (NCES district)
- District
- Cincinnati Public Schools
- NCES district ID
- 3904375
- Math proficiency
- 25% ▼ -19.00%
- Reading proficiency
- 36% ▼ -14.00%
- Median HH income
- $35,743
- Composite
- 25.21/100
- National rank
- #7508
- State rank
- #581 of 656 in OH
Livability — Cincinnati
- Score
- 80/100
- State rank
- #130
- US rank
- #1856
Category grades
Schools grade is shown separately in the Schools card above.
Census & demographics
- Census place
- Cincinnati, OH
- County
- Hamilton County · 701,295 people
- City population
- 505,555
- Metro
- Cincinnati, OH-KY-IN
- Population (ZIP)
- 18,651
- Household income
- $43,682
- Rent vs Own
- Severe rent burden
- 980.0
Population outlook (Hamilton County) Hauer SSP2
- Today (2025)
- 826,054 people
- By 2030
- 830,947 · +0.6%
- By 2040
- 832,319 · +0.8%
- By 2050
- 822,428 · -0.4%
- By 2075
- 788,688 · -4.5%
- By 2100
- 710,674 · -14.0%
Race, ethnicity, and origin ACS 2023
- Neighborhood character
- Diverse neighborhood (Simpson 0.69)
- Race & ethnicity
- Black 43% White 32% Hispanic / Latino 16% Two or more races 7% Asian 2%
- Hispanic origin (detail)
- Mexican 2%
- Common ancestry
- Lithuanian 1% Slovak 1% Serbian 1%
- Foreign-born
- 9% · Canada, India, China
- Languages at home
- 84% English-only · Spanish 10% Other Asian/Pacific 2% Other Indo-European 1%
Political lean MEDSL · Hamilton
- 2024 margin
- D (+14.9) · D 57.0% · R 42.1%
- 2008→2024 swing
- +7.9pp toward D · 2008: 7.0pp · 2024: 14.9pp
- All cycles
- 2024: D+14.9 2020: D+15.9 2016: D+9.5 2012: D+4.9 2008: D+7.0
Not yet ingested
- Civics
- —
Market trends
- HPI YoY
- ▼ -138.67%
- Current HPI
- 163.3375
- Rent YoY
- ▲ 3.30%
- Metro
- Cincinnati, OH-KY-IN
- State GDP YoY
- ▲ 1.98%
- F500 in state
- 48
Industry mix (Fortune 500 HQ in OH)
| Industry | F500 HQs | Revenue |
|---|---|---|
| Insurance | 3 | $145B |
|
||
| Industrial Machinery | 3 | $49B |
|
||
| Financial Services | 3 | $24B |
|
||
| Consumer Goods | 2 | $93B |
|
||
| Aerospace / Defense | 2 | $47B |
|
||
| Utilities | 2 | $33B |
|
||
Price history
+425.0% since first listed17 events — show timeline
- 2026-06-11 Listed $189,000 Cincy MLS
- 2024-05-23 Sold (Public Records) $165,000 Public Records
- 2011-07-25 Sold (Public Records) $290,518 Public Records
- 2008-07-11 Listing Removed — Cincy MLS
- 2008-04-11 Listing Removed — Cincy MLS
- 2008-04-10 Listed $99,900 Cincy MLS
- 2007-04-10 Listed $99,900 Cincy MLS
- 2006-12-06 Sold (Public Records) $22,500 Public Records
- 2006-11-30 Sold (MLS) $22,500 Cincy MLS
- 2006-08-30 Listed $24,900 Cincy MLS
- 2001-12-18 Sold (Public Records) $65,000 Public Records
- 2001-12-05 Sold (MLS) $65,000 Cincy MLS
- 2001-09-29 Listed $67,500 Cincy MLS
- 2000-09-11 Listing Removed — Cincy MLS
- 2000-03-10 Listed $69,900 Cincy MLS
- 1992-12-31 Sold (Public Records) $52,000 Public Records
- 1986-08-25 Sold (Public Records) $36,000 Public Records
Property tax history
+8.5%/yrLatest (2025): $2,233 · +0.1% YoY. Source: county tax records.
Cash-flow waterfall
monthlySold comps — $/sqft
last 12 mo · ≤1 miLoading sold comps…