3066 Rt 9 · Seaville, NJ
Flood risk No data
- FEMA flood zone
- —
- Chance of flooding over 30 yrs
- —
- Est. flood insurance / yr
- —
Fire risk No data
- Est. fire insurance / yr
- —
Heat risk No data
- Hot days now (above threshold)
- —
- Hot days in 30 yrs
- —
Wind risk No data
- Chance of severe wind over 30 yrs
- —
Air-quality risk No data
- Unhealthy air days now
- —
- Unhealthy air days in 30 yrs
- —
Risk factors via First Street. Map © Google.
Why this score? — see what drove the B- grade
The composite is a weighted blend of 9 inputs, each scored 0–100. Each bar is that input's sub-score; the figure is the points it added to the 100-point composite (weight × sub-score).
- Cash flow +30.0/30.0
- 1% rule +10.0/10.0
- DSCR +10.0/10.0
- ARV discount +7.5/15.0
- Schools +4.3/10.0
- Rent growth +2.5/5.0
- Livability +2.5/5.0
- Condition / age +2.2/5.0
- Appreciation +0.0/10.0
$65,000
🖨 Deal sheet 📄 Offer letter ✓ Due diligence
Listing remarks MLS
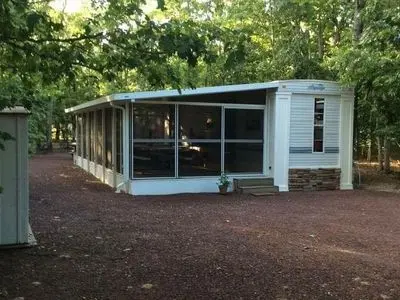
Start your summer fun in this well maintained, bright and spacious Park Model vacation home in Echo Farms Resorts in Ocean View NJ. Step into the large enclosed sunroom porch area to relax, read, or watch TV. Enter through the sliding glass doors to the bright kitchen and living area with plenty of windows with a cathedral ceiling. 1 bedroom with 2 upstairs lofts for additional guests. Newer roof, New Shed. All Furniture and 3 TV's are included. Owner has paid the 2026 lot rent for the season. Lot Rent is $7,596.00. Propane tank is also filled. Water and sewer included in the lot fee. Echo Farm Resorts offer many amenities for your summer fun. Outdoor Pool, Playground, Basketball Court, Volleyball, Laundry facilities on site and much more. Just minutes to Sea Isle City beaches. Close to shopping, boardwalks, restaurants, Atlantic City, Ocean City, Wildwood, and Historic Cape May. Easy access from Garden State Parkway and Route 9 South. Seasonal from April 1st to October 25
Key facts
- Community center
- Fully paved exterior
- Campground amenities
Tags
Property features AI
Finance
- Financial info: Land lease payment of $7,568 annually; Approximately 1 year remaining on land lease
Exterior
- Parking: Other parking
- Utilities: Shared well water; Public septic
- Home design: Manufactured home; Land lease ownership
- Construction: Estimated year built; Finished area estimated at 400
- Exterior features: Community pool; Above-grade other structures
Interior
- Bedrooms: One bedroom on the main level; One bedroom on the first upper level
- Bathrooms: One full bathroom on the main level; One full bathroom total
- Heating & cooling: Central heating; Propane (leased) for heating; Central air conditioning; Cooling uses bottled gas; Hot water by propane
- Interior features: Furnished
Neighborhood map
What this means for you Summary
Snapshot
- This is a 2-bed/1.0-bath manufactured listed at $65k. Condition is rated fair.
Deal economics
- At list price, monthly cash flow is $491 ($6k/yr) — positive.
- The deal already cash-flows at list — no discount required.
- Meets the 1% rule at list price ($1k rent vs $65k).
Location & tenants
- Location reads: area grade B — affects rentability + tenant quality, not the cash-flow math above.
- Upper Township School District (suburban): math 33% / reading 62% proficiency, ranked #151 of 472 in NJ (top 32%) — families likely to look elsewhere, expect single-tenant / working-renter base with shorter leases; only 10% free/reduced lunch — higher-income household profile.
- Market conditions: 76 active listings in the ZIP; 877 units permitted in Cape May County in 2024 (35 in 5+ unit buildings).
Forward outlook
- Local home prices are declining (-3.0%/yr); year-one equity from $449 of loan paydown is wiped out by about $2k of value loss. Plan a longer hold.
- Cape May County population projected at -24% by 2050 — secular population decline; favor cash flow + early exit over multi-decade hold.
- At projected returns (-3.0% appreciation + 3.0% rent growth), your $18k cash investment doubles in ~4 years — after that, you're playing with house money.
Negotiation context
- Only 12 days on market — expect competitive offers; lowballing is unlikely to land.
- 15 sale attempts since 8y ago; this cycle's ask is 124% above the opening price — seller raised mid-cycle; expect resistance to lowballs.
- Current owner paid $36k; list at $65k implies a 81% gain — meaningful room to come down on a strong offer.
Questions for the listing agent
- Have any recent inspections been done? Can we get a copy of the seller's disclosures and any deferred-maintenance estimates?
- Is there a deadline driving the sale (1031 exchange, divorce, estate, relocation)? That informs how much negotiation room exists.
- What's the average days-on-market for RENTAL listings here right now (not sales)? A rising rental-DOM trend means longer vacancies and softer asking-rent achievability than the comps imply.
- What's the recent tenant-quality profile in this submarket — average credit score on applications, eviction rate, late-payment / NSF rate, and stable-employment percentage? A property-management company in the area should have these aggregated.
- How much new for-sale + rental construction is in the pipeline within 1–3 miles? Heavy new supply typically softens prices + rents 12–24 months out; constrained supply supports both.
Investment metrics
- 1% rule
- 1.83% ✓
- Cap rate
- 15.36%
- Cash-on-cash
- 32.38%
- DSCR
- 2.44
- GRM
- 4.6
CMA / ARV
- ARV (median comp)
- $26,275
- List price
- $65,000
- Delta
- 52.24%
- Verdict
- OVERPRICED
- Comps
- 1 within 2.0 mi
Projected returns pro-forma
-3.0% appreciation · 3.0% rent growth · sell at horizon
- IRR
- 27.5%
- Equity multiple
- 2.14×
- Total profit
- $20,767
- Equity at exit
- $9,692
- IRR
- 35.0%
- Equity multiple
- 4.21×
- Total profit
- $58,437
- Equity at exit
- $5,620
Cash invested: $18,200 (down + closing). Projections, not guarantees.
Landlord ↔ Tenant lean methodology
- Overall (STATE)
- 21 Tenant-Leaning
- State New Jersey
- 21 Tenant-Leaning · D+6
- County
- — inherits STATE
- City
- — inherits STATE
ZIP-level market 08230
- Home prices YoY
- -15.3%
- Active inventory
- 76
- Price-to-rent
- 4.6×
Monthly cashflow live
- Estimated rent
- $1,190 medium interval (Pro) →
- Mortgage (P&I)
- −$341
- Tax est. 1.5%
- −$81 /mo · $975/yr
- Insurance
- −$27
- HOA
- −$0
- Vacancy / Maint / Mgmt
- −$250
- Net cashflow
- $491
Break-even live
UW: 25.0% down · 7.5% · 30yr · 1.5% tax · 5.0% vac · 8.0% maint · 8.0% mgmt
Financing live
Cash to close
- Down payment
- $16,250
- Closing costs
- $1,950
- Reserves months
- —
- Total cash needed
- —
Loan-product check · same deal, 3 products live
Conventional
25% down · 7.5% · 30yr
- Down + closing
- —
- Monthly P&I
- —
- Monthly cashflow
- —
- DSCR
- —
- Eligible?
- —
Personal DTI + credit; lowest rate.
DSCR
20% down · 8.5% · 30yr
- Down + closing
- —
- Monthly P&I
- —
- Monthly cashflow
- —
- DSCR
- —
- Eligible?
- —
No personal income docs; deal must DSCR.
Hard money
10% down · 12.0% · 12mo
- Down + closing
- —
- Monthly P&I
- —
- Monthly cashflow
- —
- DSCR
- —
- Eligible?
- —
Short-term bridge; refi at stabilization.
Listing history 48 events
-
2026-06-19days on market $65,000 Active 12 DOM
-
2026-06-18days on market $65,000 Active 11 DOM
-
2026-06-17days on market $65,000 Active 10 DOM
-
2026-06-16days on market $65,000 Active 9 DOM
-
2026-06-15days on market $65,000 Active 8 DOM
-
2026-06-14days on market $65,000 Active 6 DOM
-
2026-06-13pricedays on market $65,000 Active 5 DOM
-
2026-06-10days on market $55,000 Active 3 DOM
-
2026-06-09days on market $55,000 Active 2 DOM
-
2026-06-07remarks 675-char remark
-
2026-06-07pricedays on market $55,000 Active 1 DOM
-
2026-06-05days on market $39,000 Active 16 DOM
-
2026-06-03days on market $39,000 Active 15 DOM
-
2026-06-02days on market $39,000 Active 14 DOM
-
2026-06-01days on market $39,000 Active 13 DOM
-
2026-05-31days on market $39,000 Active 12 DOM
-
2026-05-30days on market $39,000 Active 11 DOM
-
2026-05-12$270,000 Active 867-char remark
-
2026-04-15soldstatus $36,000 Sold Coop by Member 760-char remark
-
2026-04-01soldstatus $39,000 Sold Non Member
-
2026-04-01soldstatus $39,000 Sold
-
2026-03-14price $44,900
-
2026-03-14price $44,900
-
2026-01-19$49,900 Active
-
2026-01-19$49,900 Active
-
2025-11-01historical Expired
-
2025-10-18price $40,000 760-char remark
-
2025-09-07$45,000 Active 760-char remark
-
2025-07-10price $54,900
-
2025-06-13$59,900 Active
-
2025-05-19soldstatus $40,000 Closed
-
2025-05-06$50,000 Active
-
2024-07-02soldstatus $53,000 Sold In-House
-
2024-06-25status Under Contract
-
2024-05-23price $55,000
-
2024-05-15soldstatus $42,000 Sold In-House
-
2024-05-14status Under Contract
-
2024-04-29price $50,000
-
2024-03-22price $65,000
-
2024-03-19price $65,000
-
2024-03-01$75,000 Active
-
2024-02-19$75,000 Active
-
2022-06-30soldstatus $29,900 Sold
-
2022-06-22historical Under Contract
-
2022-05-03price $29,900
-
2022-04-13$39,900 Active
-
2019-04-12soldstatus $47,000 Sold
-
2018-12-18$49,900 Active
ⓘ Source: listings_history table (triggers on properties + properties_extension) + one-shot
backfill from property_details.listing_events for pre-trigger history.
Nearby sold comps map
Loading sold comps map…
Walkable amenities ~0.75 mi
Loading nearby amenities…
Taxation est. · year 1
- Rental income
- $14,284
- − Mortgage interest
- −$3,641
- − Property taxes
- −$975
- − Insurance
- −$325
- − Repairs & maintenance
- −$1,143
- − Management
- −$1,143
- − Depreciation
- −$1,891
- Taxable income
- $5,167
- Est. tax owed @ 24.0%
- −$1,240
- After-tax cash flow
- $4,654/yr
For passive investors: Depreciation is non-cash, so a rental often shows a tax loss while cash-flowing — sheltering income. Rental losses are passive: they offset passive income freely, and up to $25,000/yr can offset ordinary (W-2) income if you actively participate and your MAGI is under $100k (phasing out to $0 by $150k); unused losses carry forward. On sale, claimed depreciation is recaptured at up to 25%, and gains may owe capital-gains tax (a 1031 exchange can defer both). Figures are a year-1 estimate at your 24.0% rate — not tax advice; consult a CPA.
Condition & rehab AI · 12 photos
This manufactured home requires moderate renovations, focusing on appliances, fixtures, and flooring to improve its resale value.
Repairs flagged
- Major Appliances — Outdated and worn
- Major Bathroom fixtures — Dated appearance
- Minor Exterior siding — Some wear
Value-add opportunities
- Resale Paint interior walls — Fresh paint enhances curb appeal
- Resale Replace carpeted flooring — New flooring improves aesthetics
- Resale Upgrade kitchen appliances — Modern appliances attract buyers
Renovation cost estimate screening
| Repair item | Severity | Est. cost |
|---|---|---|
| Appliances · Outdated and worn | Major | $15,000–50,000 |
| Bathroom fixtures · Dated appearance | Major | $15,000–50,000 |
| Exterior siding · Some wear | Minor | $500–3,000 |
| Total estimated repair cost · 3 items | $30,500–103,000 |
Value-add ROI direction
- Resale Paint interior walls — Fresh paint enhances curb appeal ↑
- Resale Replace carpeted flooring — New flooring improves aesthetics ↑
- Resale Upgrade kitchen appliances — Modern appliances attract buyers ↑
ⓘ Cost ranges are severity-bucket heuristics (US national rule-of-thumb). Get contractor quotes + a written scope before underwriting a rehab budget.
Schools (NCES district)
- District
- Upper Township School District
- NCES district ID
- 3416650
- Math proficiency
- 33% ▼ -33.00%
- Reading proficiency
- 62% ▼ -16.00%
- Median HH income
- $78,141
- Composite
- 43.29/100
- National rank
- #3040
- State rank
- #151 of 472 in NJ
Livability — Seaville
No livability data for this city. (Only ~50 U.S. cities are tracked.)
Census & demographics
- Census place
- Seaville, NJ
- City population
- 5,998
- Population (ZIP)
- 5,998
Population outlook (Cape May County) Hauer SSP2
- Today (2025)
- 88,234 people
- By 2030
- 84,144 · -4.6%
- By 2040
- 75,146 · -14.8%
- By 2050
- 67,389 · -23.6%
- By 2075
- 55,732 · -36.8%
- By 2100
- 44,972 · -49.0%
Race, ethnicity, and origin ACS 2023
- Neighborhood character
- Predominantly White (96%)
- Race & ethnicity
- White 96% Two or more races 2% Hispanic / Latino 1%
- Common ancestry
- Romanian 6% Slovak 3% Iranian 2%
- Foreign-born
- 2% · Canada, South Korea
- Languages at home
- 97% English-only · Other Indo-European 2% Spanish 1%
Political lean MEDSL · Cape May
- 2024 margin
- R (+19.2) · D 39.7% · R 58.9% · Other 1.4%
- 2008→2024 swing
- -10.6pp toward R · 2008: -8.7pp · 2024: -19.2pp
- All cycles
- 2024: R+19.2 2020: R+15.9 2016: R+19.9 2012: R+8.9 2008: R+8.7
Not yet ingested
- Civics
- —
Market trends
- HPI YoY
- ▼ -62.62%
- Current HPI
- 347.2196
- Rent YoY
- —
- Metro
- —
- State GDP YoY
- ▲ 2.05%
- F500 in state
- 34
Industry mix (Fortune 500 HQ in NJ)
| Industry | F500 HQs | Revenue |
|---|---|---|
| Consumer Goods | 3 | $31B |
|
||
| Pharmaceuticals | 2 | $153B |
|
||
| Technology | 2 | $21B |
|
||
| Insurance | 2 | $20B |
|
||
| Healthcare | 2 | $19B |
|
||
| Financial Services | 1 | $70B |
|
||
Price history
+30.3% since first listed39 events — show timeline
- 2026-06-12 Price Changed $65,000 BRIGHT MLS
- 2026-06-12 Price Changed $69,500 SJSRMLS
- 2026-06-11 Listed $29,000 CMCMLS
- 2026-06-07 Listed $55,000 BRIGHT MLS
- 2026-06-06 Listed $65,000 CMCMLS
- 2026-05-19 Listed $73,500 SJSRMLS
- 2026-05-18 Listed $39,000 CMCMLS
- 2026-04-15 Sold (MLS) $36,000 CMCMLS
- 2026-04-06 Delisted — CMCMLS
- 2026-04-01 Sold (MLS) $39,000 SJSRMLS
- 2026-04-01 Sold (MLS) $39,000 CMCMLS
- 2026-03-14 Price Changed $44,900 SJSRMLS
- 2026-03-14 Price Changed $44,900 CMCMLS
- 2026-02-02 Listed $60,000 CMCMLS
- 2026-01-19 Listed $49,900 SJSRMLS
- 2026-01-19 Listed $49,900 CMCMLS
- 2025-11-01 Delisted — CMCMLS
- 2025-10-18 Price Changed $40,000 CMCMLS
- 2025-09-07 Listed $45,000 CMCMLS
- 2025-07-10 Price Changed $54,900 CMCMLS
- 2025-06-13 Listed $59,900 CMCMLS
- 2025-05-19 Sold (MLS) $40,000 BRIGHT MLS
- 2025-05-06 Listed $50,000 BRIGHT MLS
- 2024-07-02 Sold (MLS) $53,000 CMCMLS
- 2024-06-25 Pending — CMCMLS
- 2024-05-23 Price Changed $55,000 CMCMLS
- 2024-05-15 Sold (MLS) $42,000 CMCMLS
- 2024-05-14 Pending — CMCMLS
- 2024-04-29 Price Changed $50,000 CMCMLS
- 2024-03-22 Price Changed $65,000 CMCMLS
- 2024-03-19 Price Changed $65,000 CMCMLS
- 2024-03-01 Listed $75,000 CMCMLS
- 2024-02-19 Listed $75,000 CMCMLS
- 2022-06-30 Sold (MLS) $29,900 SJSRMLS
- 2022-06-22 Contingent — SJSRMLS
- 2022-05-03 Price Changed $29,900 SJSRMLS
- 2022-04-13 Listed $39,900 SJSRMLS
- 2019-04-12 Sold (MLS) $47,000 SJSRMLS
- 2018-12-18 Listed $49,900 SJSRMLS
Cash-flow waterfall
monthlySold comps — $/sqft
last 12 mo · ≤1 miLoading sold comps…