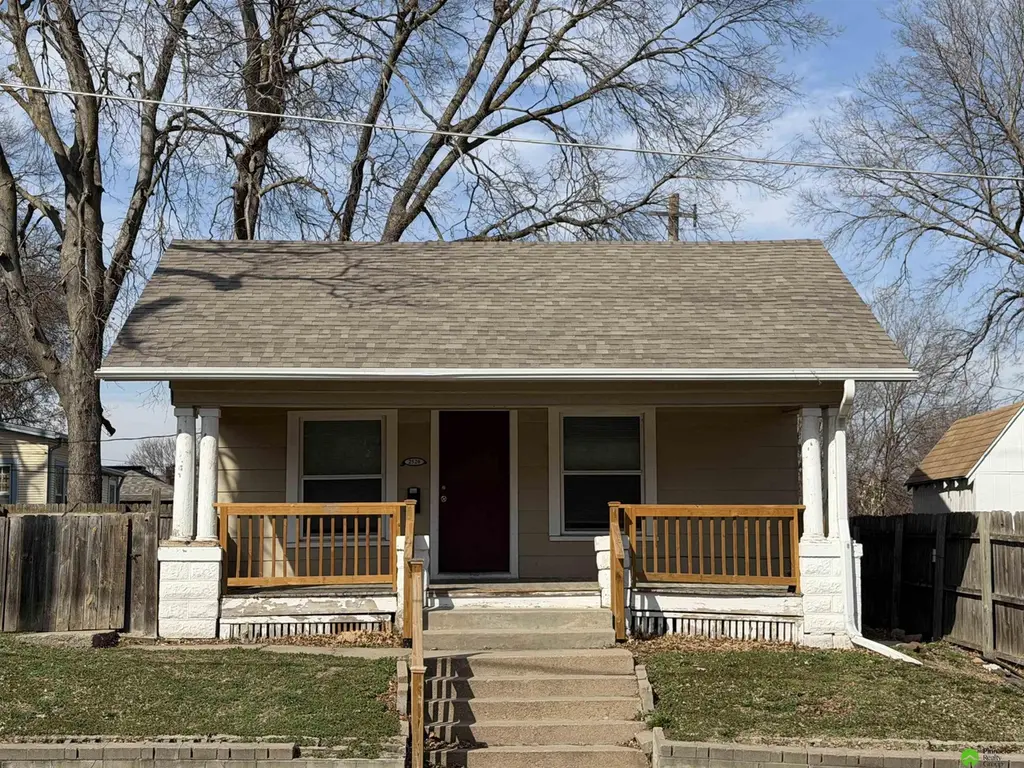
2520 Garfield St · Lincoln, NE
Flood risk 1/10 · Minimal
- FEMA flood zone
- X (unshaded)
- Chance of flooding over 30 yrs
- 0.0%
- Est. flood insurance / yr
- $473 – $860
Fire risk 1/10 · Minimal
- Est. fire insurance / yr
- $1,161 – $2,155
Heat risk 3/10 · Minor
- Hot days now (above 104°F)
- 7 days/yr
- Hot days in 30 yrs
- 16 days/yr
Wind risk 2/10 · Minimal
- Chance of severe wind over 30 yrs
- —
Air-quality risk 1/10 · Minimal
- Unhealthy air days now
- 0 days/yr
- Unhealthy air days in 30 yrs
- 0 days/yr
Risk factors via First Street. Map © Google.
Why this score? — see what drove the D grade
The composite is a weighted blend of 9 inputs, each scored 0–100. Each bar is that input's sub-score; the figure is the points it added to the 100-point composite (weight × sub-score).
- ARV discount +15.0/15.0
- Cash flow +9.0/30.0
- Schools +4.4/10.0
- Livability +4.2/5.0
- Rent growth +3.1/5.0
- 1% rule +2.8/10.0
- DSCR +2.5/10.0
- Condition / age +2.5/5.0
- Appreciation +0.0/10.0
$109,900
🖨 Deal sheet (PDF) 📄 Offer letter ✓ Due diligence
Listing remarks
Welcome to 2520 Garfield Street. This 864 Sq ft bungalow is perfect for a first time home buyer or investor looking to expand their portfolio. it features 2 beds, 1 bath, a living room and kitchen. With a great front porch, this home is centrally located in the Near South Neighborhood, near schools, shopping and dining, this one is not to miss. Schedule your private showing today. Seller holds a Nebraska real estate license.
Key facts
- Front porch
- Centrally located
- 3,049 sq ft lot
Tags
Property features AI
Exterior
- Parking: No garage
- Utilities: Public water; Public sewer
- Home design: Single family residence; Residential property; Built in 1900; One-story (main floor living); Slab foundation
- Construction: Building area 864; Above-grade finished area 864
- Exterior features: Lot up to 1/4 acre; Lot dimensions approximately 59 x 53; Lot included in price
Interior
- Bedrooms: Master bedroom on the main floor; Second bedroom on the main floor
- Bathrooms: One full bathroom on the main floor
- Heating & cooling: Natural gas forced air heating; Central air conditioning
- Interior features: Basement present (finished area information provided separately); No fireplaces
Neighborhood map
What this means for you Summary
Snapshot
- This is a 2-bed/1.0-bath single-family listed at $110k.
Deal economics
- At list price, monthly cash flow is $-87 ($-1k/yr) — negative.
- To cash-flow at today's rent, offer at most $95k (14.0% below list).
- To meet the 1% rule (rent ≥ 1% of price), the offer needs to be $86k (21.7% below list).
- Recommended offer: $86k (21.7% below list) — sets the bar for 1% rule.
- Cap rate 5.3% vs local median 3.0% in Lincoln — top-decile yield for the area; either an underpriced asset or a hidden risk that comps aren't pricing in. Stress-test before assuming the spread holds.
Location & tenants
- Location reads 85/100 on livability (#5 in NE, #545 nationally) — a professional / high-income tenant draw. Strengths: amenities A+, cost of living A+, housing A+; Watch: crime D+.
- Lincoln Public Schools (urban): math 50% / reading 53% proficiency, ranked #59 of 111 in NE (top 53%) — acceptable for families but not a draw, mixed tenant base, ~2y average lease.
- Zoned schools: Prescott Elementary School (math 37% / reading 52%, grade F, #289 of 502 statewide, top 63%, 505 students, 71% FRL); Irving Middle School (math 50% / reading 55%, grade C+, #42 of 128 statewide, top 32%, 890 students, 46% FRL); Lincoln High School (math 38% / reading 41%, grade F, #184 of 261 statewide, top 76%, 2,196 students, 59% FRL) — zoned schools average 59% FRL vs 37% district-wide (21 pts higher); higher-poverty schools than district average — tighter screening recommended.
- Market conditions: Rents rising (+2.4%/yr); 146 active listings in the ZIP; 40 comparable units currently listed for rent nearby; rentals at typical pace (median 23d on market — plan ~3-4 weeks tenant-placement turnaround); 48% of comp listings sitting > 30 days — soft ceiling on asking rent; 1,940 units permitted in Lancaster County in 2024 (895 in 5+ unit buildings).
- This rent is only 15% of the median local income ($69k/yr) — well below the 30% rent-burden line; pricing power to push rent on renewal without tenant pushback.
Forward outlook
- Local home prices are declining (-3.0%/yr); year-one equity from $760 of loan paydown is wiped out by about $3k of value loss. Plan a longer hold.
- Lancaster County population projected at +37% by 2050 — long-run rental-demand tailwind backs the buy-and-hold thesis.
Negotiation context
- Only 14 days on market — expect competitive offers; lowballing is unlikely to land.
- 9 sale attempts since 13y ago with the ask held roughly flat each time — persistent listings suggest the price (not the market) is what's stuck; bring a comps-based counter.
Risks & watch-outs
- Watch-outs: built in 1900 — expect roof / HVAC / electrical / plumbing capex.
Questions for the listing agent
- What do current leases actually rent for vs. the listed asking? Can we see a recent rent roll and the last 12 months of T-12 income?
- Built in 1900 — when were the roof, HVAC, electrical panel, plumbing, and water heater last replaced?
- Is there a deadline driving the sale (1031 exchange, divorce, estate, relocation)? That informs how much negotiation room exists.
- Schools are A-rated — typically a magnet for longer-tenancy family renters. What's the average tenant stay here, and is there a school-zone premium baked into asking?
- Crime grade is D in this area — have there been break-ins, vandalism, or insurance claims at this property in the last 3 years? What carrier currently insures it and at what premium?
- The area grade is low — what's the realistic commute time and amenity access for the typical tenant pool here? Any planned neighborhood developments (good or bad) we should know about?
- What's the average days-on-market for RENTAL listings here right now (not sales)? A rising rental-DOM trend means longer vacancies and softer asking-rent achievability than the comps imply.
- What's the recent tenant-quality profile in this submarket — average credit score on applications, eviction rate, late-payment / NSF rate, and stable-employment percentage? A property-management company in the area should have these aggregated.
- How much new for-sale + rental construction is in the pipeline within 1–3 miles? Heavy new supply typically softens prices + rents 12–24 months out; constrained supply supports both.
Investment metrics
- 1% rule
- 0.78% ✗
- Cap rate
- 5.34%
- Cash-on-cash
- -3.39%
- DSCR
- 0.85
- GRM
- 10.6
CMA / ARV
- ARV (median comp)
- $165,408
- List price
- $109,900
- Delta
- -33.56%
- Verdict
- UNDERPRICED
- Comps
- 20 within 1.0 mi
Show comp detail 12 sales within ~0.75 mi
| Address | Dist | Beds/Ba | Sqft | Sold | Price | $/sf | Match |
|---|---|---|---|---|---|---|---|
| 2520 Garfield St | 0.00mi | 2/1.0 | 864 (0%) | 1mo | $100,000 | $116 | 100 |
| 2839 Sumner St | 0.32mi | 2/1.0 | 845 (-2%) | 3mo | $200,000 | $237 | 79 |
| 1215 S 22nd St | 0.39mi | 3/1.0 (+1) | 864 (0%) | 5mo | $72,000 | $83 | 73 |
| 1940 Pepper Ave | 0.29mi | 2/1.0 | 904 (+5%) | 8mo | $168,500 | $186 | 72 |
| 2776 California Ct | 0.66mi | 2/1.0 | 885 (+2%) | 1mo | $80,000 | $90 | 64 |
| 3228 Normal Blvd | 0.58mi | 2/1.0 | 826 (-4%) | 8mo | $129,400 | $157 | 60 |
| 1349 Chautauqua Ave | 0.60mi | 2/1.0 | 816 (-6%) | 6mo | $165,000 | $202 | 58 |
| 3132 F St | 0.75mi | 2/1.0 | 904 (+5%) | 1mo | $215,000 | $238 | 57 |
| 3244 C St | 0.67mi | 2/1.0 | 936 (+8%) | 6mo | $215,000 | $230 | 50 |
| 1021 S 31st St | 0.63mi | 2/1.0 | 958 (+11%) | 8mo | $200,000 | $209 | 46 |
| 3234 C St | 0.66mi | 2/2.0 | 936 (+8%) | 7mo | $200,000 | $214 | 46 |
| 901 S 24th St | 0.56mi | 1/1.0 (-1) | 981 (+14%) | 2mo | $128,000 | $130 | 45 |
Match score weights: distance 35% · size 25% · config 20% · recency 20%. Top-matched comps best support the ARV.
Projected returns pro-forma
-3.0% appreciation · 2.38% rent growth · sell at horizon
- IRR
- -22.7%
- Equity multiple
- 0.22×
- Total profit
- $-23,866
- Equity at exit
- $16,386
- IRR
- -18.6%
- Equity multiple
- 0.02×
- Total profit
- $-30,008
- Equity at exit
- $9,502
Cash invested: $30,772 (down + closing). Projections, not guarantees.
Landlord ↔ Tenant lean methodology
- Overall (STATE)
- 83 Strongly Landlord-Friendly
- State Nebraska
- 83 Strongly Landlord-Friendly · R+13
- County
- — inherits STATE
- City
- — inherits STATE
ZIP-level market 68502
- Rents YoY
- 2.4%
- Active inventory
- 146
- Price-to-rent
- 10.6×
Monthly cashflow live
- Estimated rent
- $860 high interval (Pro) →
- Mortgage (P&I)
- −$576
- Tax from tax record
- −$145 /mo · $1,735/yr
- Insurance
- −$46
- HOA
- −$0
- Vacancy / Maint / Mgmt
- −$181
- Net cashflow
- $-87
Break-even live
Sensitivity live
| Price | -10% $-25 | -5% $-56 | +0% $-87 | +5% $-118 | +10% $-149 |
|---|---|---|---|---|---|
| Rent | -10% $-155 | -5% $-121 | +0% $-87 | +5% $-53 | +10% $-19 |
| Rate | -1.0pp $-32 | -0.5pp $-59 | base $-87 | +0.5pp $-115 | +1.0pp $-144 |
UW: 25.0% down · 7.5% · 30yr · 1.5% tax · 5.0% vac · 8.0% maint · 8.0% mgmt
Financing live
Cash to close
- Down payment
- $27,475
- Closing costs
- $3,297
- Reserves months
- —
- Total cash needed
- —
Loan-product check · same deal, 3 products live
Conventional
25% down · 7.5% · 30yr
- Down + closing
- —
- Monthly P&I
- —
- Monthly cashflow
- —
- DSCR
- —
- Eligible?
- —
Personal DTI + credit; lowest rate.
DSCR
20% down · 8.5% · 30yr
- Down + closing
- —
- Monthly P&I
- —
- Monthly cashflow
- —
- DSCR
- —
- Eligible?
- —
No personal income docs; deal must DSCR.
Hard money
10% down · 12.0% · 12mo
- Down + closing
- —
- Monthly P&I
- —
- Monthly cashflow
- —
- DSCR
- —
- Eligible?
- —
Short-term bridge; refi at stabilization.
Rent comps 40 comps
| Address | Beds | Baths | Sqft | Rent | $/sqft | DOM | Units | Dist |
|---|---|---|---|---|---|---|---|---|
| 2423 B St Unit 1 Lincoln, NE | 2.0 | 1.0 | 705 | $845 | $1.20 | 45d | 1 | 0.20mi |
| 2335 B St Unit 5 Lincoln, NE | 2.0 | 1.0 | 920 | $875 | $0.95 | 23d | 1 | 0.22mi |
| 2144 B St Unit 3 Lincoln, NE | 1.0 | 1.0 | 700 | $700 | $1.00 | 23d | 1 | 0.33mi |
| 1560 S 20th St Lincoln, NE | 2.0 | 1.0 | 900 | $999 | $1.11 | 23d | 1 | 0.35mi |
| 1444 S 20th St Lincoln, NE | 2.0 | 1.0 | 743 | $930 | $1.25 | 45d | 1 | 0.35mi |
| 1438 S 20th St Lincoln, NE | 1.0 | 1.0 | 623 | $745 | $1.20 | 23d | 1 | 0.35mi |
| 2000 Washington St Lincoln, NE | 2.0 | 1.0 | 743 | $895 | $1.20 | 45d | 1 | 0.35mi |
| 1424 S 20th St Lincoln, NE | 1.0 | 1.0 | 619 | $835 | $1.35 | 45d | 1 | 0.35mi |
| 1100 S 25th St Unit 3 Lincoln, NE | 1.0 | 1.0 | 553 | $825 | $1.49 | 45d | 1 | 0.36mi |
| 2209 D St Lincoln, NE | 1.0–2.0 | 1.0 | 760 | $914 | $1.20 | 15d | 3 | 0.41mi |
| 1001 S 26th St Lincoln, NE | 2.0 | 1.0 | 790 | $799 | $1.01 | 15d | 1 | 0.44mi |
| 1528 S 19th St Unit 20 Lincoln, NE | 2.0 | 1.0 | 821 | $845 | $1.03 | 23d | 1 | 0.45mi |
| 2510 E St Unit 3 Lincoln, NE | 2.0 | 1.0 | 800 | $875 | $1.09 | 15d | 1 | 0.47mi |
| 2444 E St Lincoln, NE | 2.0 | 1.0 | 650 | $749 | $1.15 | 45d | 1 | 0.48mi |
| 1833 Washington St Lincoln, NE | 2.0 | 1.0 | 761 | $829 | $1.09 | 45d | 1 | 0.51mi |
| 2044 E St Lincoln, NE | 1.0 | 1.0 | 575 | $695 | $1.21 | 23d | 1 | 0.58mi |
| 3137 South St Lincoln, NE | 2.0 | 1.0 | 625 | $799 | $1.28 | 45d | 1 | 0.58mi |
| 1736 Euclid Ave Lincoln, NE | 2.0 | 1.0 | 1120 | $850 | $0.76 | 23d | 1 | 0.59mi |
| 2457 S 27th St Unit B Lincoln, NE | 2.0 | 1.0 | 950 | $1,450 | $1.53 | 45d | 1 | 0.61mi |
| 1227 S 18th St Lincoln, NE | 1.0 | 1.0 | 702 | $695 | $0.99 | 23d | 1 | 0.61mi |
| 1730 B St Apt 2 Lincoln, NE | 2.0 | 1.0 | 911 | $950 | $1.04 | 45d | 1 | 0.62mi |
| 861 S 29th St Unit 865 Lincoln, NE | 2.0 | 1.0 | 902 | $795 | $0.88 | 15d | 1 | 0.63mi |
| 1901 E St Apt 1 Lincoln, NE | 1.0 | 1.0 | 566 | $700 | $1.24 | 15d | 1 | 0.63mi |
| 1701 B St Lincoln, NE | 1.0 | 1.0 | 830 | $800 | $0.96 | 45d | 1 | 0.64mi |
| 2040 F St Unit 7 Lincoln, NE | 1.0 | 1.0 | 570 | $695 | $1.22 | 15d | 1 | 0.64mi |
| 2068 S 18th St Unit 1 Lincoln, NE | 3.0 | 1.0 | 1048 | $1,295 | $1.24 | 45d | 1 | 0.64mi |
| 1640 Washington St Unit 1 Lincoln, NE | 1.0 | 1.0 | 563 | $695 | $1.23 | 23d | 1 | 0.65mi |
| 1641 Prospect St Unit 3 Lincoln, NE | 2.0 | 1.0 | 761 | $1,099 | $1.44 | 23d | 1 | 0.66mi |
| 2527 H St Lincoln, NE | 2.0 | 1.0 | 625 | $725 | $1.16 | 45d | 1 | 0.68mi |
| 1900 F St Unit B12 Lincoln, NE | 1.0 | 1.0 | 648 | $750 | $1.16 | 45d | 1 | 0.73mi |
| 636 S 27th St Apt 6 Lincoln, NE | 2.0 | 1.0 | 690 | $725 | $1.05 | 23d | 1 | 0.73mi |
| 1905 G St Unit 3 Lincoln, NE | 1.0 | 1.0 | 755 | $800 | $1.06 | 45d | 1 | 0.74mi |
| 1905 G St Unit 1 Lincoln, NE | 2.0 | 2.0 | 935 | $960 | $1.03 | 45d | 1 | 0.74mi |
| 1530 Rose St Unit 1534 Lincoln, NE | 2.0 | 1.0 | 864 | $975 | $1.13 | 45d | 1 | 0.74mi |
| 1612 C St Lincoln, NE | 2.0 | 1.0 | 720 | $829 | $1.15 | 23d | 1 | 0.75mi |
| 1820 F St Unit 7 Lincoln, NE | 1.0 | 1.0 | 616 | $725 | $1.18 | 15d | 1 | 0.75mi |
| 1820 F St Unit 4 Lincoln, NE | 1.0 | 1.0 | 616 | $725 | $1.18 | 45d | 1 | 0.75mi |
| 1619 D St Unit 1621 Lincoln, NE | 2.0 | 2.0 | 750 | $1,195 | $1.59 | 15d | 1 | 0.75mi |
| 1035 S 17th St Lincoln, NE | 1.0 | 1.0 | 750 | $725 | $0.97 | 23d | 1 | 0.76mi |
| 1609 D St Unit 1 Lincoln, NE | 1.0 | 1.0 | 646 | $675 | $1.04 | 45d | 1 | 0.76mi |
Listing history 22 events
-
2026-05-13$109,900 New 465-char remark
-
2026-05-13historical
-
2026-05-02$114,000 New
-
2026-04-21status Pending
-
2026-04-20historical
-
2026-04-10$114,000 New
-
2026-04-10historical
-
2026-03-09$117,500 New
-
2026-03-09historical
-
2026-01-20$127,500 New
-
2025-10-02historical $1,050
-
2025-09-25$1,050
-
2025-07-28historical $1,000
-
2025-07-19$1,000
-
2022-07-25price $1,000
-
2018-10-18soldstatus $55,000
-
2014-01-07soldstatus $47,000
-
2014-01-03soldstatus $46,750
-
2013-11-27historical
-
2013-11-20$55,000
-
2013-11-13historical
-
2013-08-13$55,000
ⓘ Source: listings_history table (triggers on properties + properties_extension) + one-shot
backfill from property_details.listing_events for pre-trigger history.
Tax reassessment forecast NE · Resets to sale price
- Current annual tax
- $1,735 · $145/mo
- Projected year-2 tax
- $1,901 · $158/mo
- Expected delta
- +$167/yr (+$14/mo · 9.6%)
ⓘ Screening estimate from a state-policy table — verify with the county assessor before closing.
Climate risk First Street
- Flood 1/10 Low FEMA zone X (unshaded) · 0% chance over 30 yrs
- Wildfire 1/10 Low
- Heat 3/10 Moderate 7 d/yr ≥104°F today · 16 d/yr by 30 yrs out
- Wind 2/10 Low
- Air quality 1/10 Low 0 unhealthy d/yr today · 0 by 30 yrs out
Nearby sold comps map
Loading sold comps map…
Walkable amenities ~0.75 mi
Loading nearby amenities…
Taxation est. · year 1
- Rental income
- $10,324
- − Mortgage interest
- −$6,156
- − Property taxes
- −$1,735
- − Insurance
- −$550
- − Repairs & maintenance
- −$826
- − Management
- −$826
- − Depreciation
- −$3,197
- Taxable loss
- −$2,965
- Est. tax savings @ 24.0%
- +$712
- After-tax cash flow
- $-332/yr
For passive investors: Depreciation is non-cash, so a rental often shows a tax loss while cash-flowing — sheltering income. Rental losses are passive: they offset passive income freely, and up to $25,000/yr can offset ordinary (W-2) income if you actively participate and your MAGI is under $100k (phasing out to $0 by $150k); unused losses carry forward. On sale, claimed depreciation is recaptured at up to 25%, and gains may owe capital-gains tax (a 1031 exchange can defer both). Figures are a year-1 estimate at your 24.0% rate — not tax advice; consult a CPA.
Schools (NCES district)
- District
- Lincoln Public Schools
- NCES district ID
- 3172840
- Math proficiency
- 50% ▼ -6.00%
- Reading proficiency
- 53% ▼ -3.00%
- Median HH income
- $50,273
- Composite
- 44.05/100
- National rank
- #2880
- State rank
- #59 of 111 in NE
Livability — Lincoln
- Score
- 85/100
- State rank
- #5
- US rank
- #545
Category grades
Schools grade is shown separately in the Schools card above.
Census & demographics
- Census place
- Lincoln, NE
- County
- Lancaster County · 291,509 people
- City population
- 291,509
- Metro
- Lincoln, NE
- Population (ZIP)
- 25,846
- Household income
- $68,523
- Rent vs Own
- Severe rent burden
- 1252.0
Population outlook (Lancaster County) Hauer SSP2
- Today (2025)
- 352,806 people
- By 2030
- 377,899 · +7.1%
- By 2040
- 428,582 · +21.5%
- By 2050
- 483,103 · +36.9%
- By 2075
- 632,390 · +79.2%
- By 2100
- 759,513 · +115.3%
Race, ethnicity, and origin ACS 2023
- Neighborhood character
- Predominantly White (72%)
- Race & ethnicity
- White 72% Hispanic / Latino 13% Two or more races 11% Black 6% Asian 3%
- Hispanic origin (detail)
- Mexican 9%
- Common ancestry
- Portuguese 3% Romanian 2% Lithuanian 2%
- Foreign-born
- 10% · Canada, Vietnam, Philippines
- Languages at home
- 86% English-only · Spanish 9% Other Asian/Pacific 2% French/Haitian/Cajun 1%
Political lean MEDSL · Lancaster
- 2024 margin
- Toss-up / Even · D 51.4% · R 47.1% · Other 1.5%
- 2008→2024 swing
- -0.7pp no change · 2008: 5.0pp · 2024: 4.3pp
- All cycles
- 2024: D+4.3 2020: D+7.8 2016: D+0.1 2012: R+1.0 2008: D+5.0
Not yet ingested
- Civics
- —
Market trends
- HPI YoY
- ▼ -252.87%
- Current HPI
- 240.304
- Rent YoY
- ▲ 2.38%
- Metro
- Lincoln, NE
- State GDP YoY
- ▲ 0.68%
- F500 in state
- 2
Industry mix (Fortune 500 HQ in NE)
| Industry | F500 HQs | Revenue |
|---|---|---|
| Conglomerate | 1 | $371B |
|
||
Price history
+81.8% since first listed24 events — show timeline
- 2026-06-05 Sold (MLS) $100,000 GPRMLS
- 2026-05-27 Pending — GPRMLS
- 2026-05-13 Listing Removed — GPRMLS
- 2026-05-13 Listed $109,900 GPRMLS
- 2026-05-02 Listed $114,000 GPRMLS
- 2026-04-21 Pending — GPRMLS
- 2026-04-20 Listing Removed — GPRMLS
- 2026-04-10 Listing Removed — GPRMLS
- 2026-04-10 Listed $114,000 GPRMLS
- 2026-03-09 Listing Removed — GPRMLS
- 2026-03-09 Listed $117,500 GPRMLS
- 2026-01-20 Listed $127,500 GPRMLS
- 2025-10-02 Rental Removed $1,050 APPFOLIO
- 2025-09-25 Listed for Rent $1,050 APPFOLIO
- 2025-07-28 Rental Removed $1,000 APPFOLIO
- 2025-07-19 Listed for Rent $1,000 APPFOLIO
- 2022-07-25 Price Changed $1,000 RENT.
- 2018-10-18 Sold (Public Records) $55,000 Public Records
- 2014-01-07 Sold (Public Records) $47,000 Public Records
- 2014-01-03 Sold (MLS) $46,750 GPRMLS
- 2013-11-27 Listing Removed — GPRMLS
- 2013-11-20 Listed $55,000 GPRMLS
- 2013-11-13 Listing Removed — GPRMLS
- 2013-08-13 Listed $55,000 GPRMLS
Property tax history
+8.2%/yrLatest (2025): $1,735 · +27.6% YoY. Source: county tax records.
Cash-flow waterfall
monthlySold comps — $/sqft
last 12 mo · ≤1 miLoading sold comps…