 Multi-family
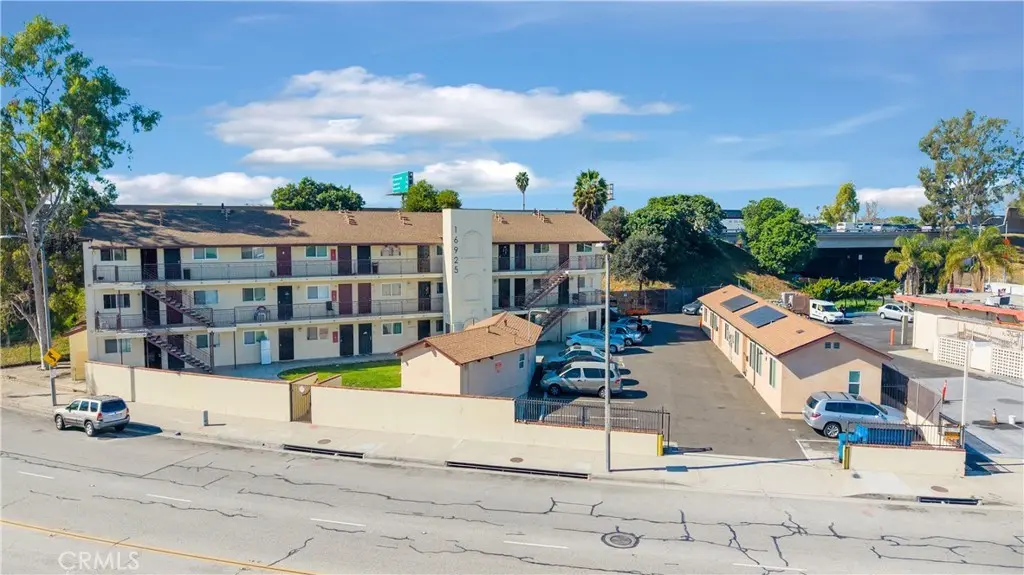
16925 Prairie · Torrance, CA
Flood risk 3/10 · Minor
- FEMA flood zone
- X (unshaded)
- Chance of flooding over 30 yrs
- 0.2%
- Est. flood insurance / yr
- $507 – $1,088
Fire risk 2/10 · Minimal
- Est. fire insurance / yr
- $659 – $1,223
Heat risk 4/10 · Minor
- Hot days now (above 86°F)
- 5 days/yr
- Hot days in 30 yrs
- 14 days/yr
Wind risk 1/10 · Minimal
- Chance of severe wind over 30 yrs
- —
Air-quality risk 5/10 · Moderate
- Unhealthy air days now
- 7 days/yr
- Unhealthy air days in 30 yrs
- 7 days/yr
Risk factors via First Street. Map © Google.
Why this score? — see what drove the D grade
The composite is a weighted blend of 9 inputs, each scored 0–100. Each bar is that input's sub-score; the figure is the points it added to the 100-point composite (weight × sub-score).
- Cash flow +12.7/30.0
- ARV discount +7.5/15.0
- Schools +5.9/10.0
- DSCR +3.8/10.0
- Livability +3.8/5.0
- 1% rule +3.3/10.0
- Rent growth +3.1/5.0
- Condition / age +2.5/5.0
- Appreciation +0.0/10.0
$6,500,000
🖨 Deal sheet (PDF) 📄 Offer letter ✓ Due diligence
Multi-family units
County records classify this as Multi-Family (5+ Unit). Listing-text estimate: 1 unit. estimate disagrees with records
5+ unit building — per-unit beds/baths from public records are typically unavailable; the breakdown below (if shown) is an estimate from the listing text.
Listing remarks MLS
We are proud to present 16925 Prairie Ave – a heavy cash-flowing 29-unit multifamily complex located in the City of Torrance. 16925 Prairie Ave is located in the Northwest region of the City of Torrance adjacent to Alondra Park and all it’s community amenities. The property is conveniently located just off of the 405 freeway and Redondo Beach Blvd, surrounded by Single Family Homes with an average home sales price exceeding $850,000. Additionally, the property is walking distance to several convenience stores and benefits from its proximity to several big-name retailers like Target, Kohls, Ralphs, Total Wine, and Trader Joes to name a few. Tenants value being within reasonable commutes to major employers like LA International Airport, Ports of Long Beach, DTLA, and others in nearby areas. The property offers 29 units, including 2 newly-constructed ADUs that have been leased out at market rate. The unit mix consists of 2, Studios, 24, one-bedrooms, and 3, two-bedroom apartments. Currently the property produces an outstanding annual income of over $643,000. The property has undergone a variety of recent capital improvements including a newly paved parking lot, a new room on 2 of the 3 buildings, electrical improvements, majority newer windows, renovated units, and more. A new investor will recognize the benefit of the heavy-cashflow through the capability of leveraging higher LTV debt opportunities. Tenants enjoy a grassy open courtyard space, on-site gated parking, and access to multiple laundry facilities.
Key facts
- 0.35 acre lot
- Built 1964
- Listed 143 days
Tags
Neighborhood map
What this means for you Summary
Snapshot
- This is a 28-bed/27.0-bath multifamily listed at $6.50M.
Deal economics
- At list price, monthly cash flow is $-694 ($-8k/yr) — negative.
- To cash-flow at today's rent, offer at most $6.38M (1.9% below list).
- To meet the 1% rule (rent ≥ 1% of price), the offer needs to be $5.40M (17.0% below list).
- Recommended offer: $5.40M (17.0% below list) — sets the bar for 1% rule.
- Cap rate 6.2% vs local median 2.1% in Torrance — top-decile yield for the area; either an underpriced asset or a hidden risk that comps aren't pricing in. Stress-test before assuming the spread holds.
Location & tenants
- Location reads 76/100 on livability (#95 in CA, #3,501 nationally) — a middle-class / working-renter tenant base. Strengths: amenities A+, commute A+, employment A+; Watch: health & safety C-, crime D+, cost of living F.
- Torrance Unified (urban): math 62% / reading 67% proficiency, ranked #150 of 1,400 in CA (top 11%) — acceptable for families but not a draw, mixed tenant base, ~2y average lease; only 20% free/reduced lunch — higher-income household profile.
- Zoned schools: Evelyn Carr Elementary (386 students, 46% FRL); Philip Magruder Middle (534 students, 48% FRL); North High (1,791 students, 36% FRL) — zoned schools average 43% FRL vs 20% district-wide (23 pts higher); higher-poverty schools than district average — tighter screening recommended.
- Market conditions: Rents rising (+2.3%/yr); 34 active listings in the ZIP; solid renter incomes; 19,697 units permitted in Los Angeles County in 2024 (9,426 in 5+ unit buildings).
- At $53,962/mo this rent would consume 602% of the median local household income ($108k/yr) (locally 1335% of renters already pay >50% of income on rent) — very limited rent-growth headroom before tenants either downsize or default.
Forward outlook
- Local home prices are declining (-3.0%/yr); year-one equity from $45k of loan paydown is wiped out by about $195k of value loss. Plan a longer hold.
- Los Angeles County population projected at +9% by 2050 — modest demand growth; plan on rents tracking national, not racing it.
Negotiation context
- It's been on market 143 days — a 12% lower offer ($5.72M) is reasonable based on typical stale-listing flexibility.
- 7 sale attempts since 11y ago; this cycle's ask has dropped $700k (10%) from the opening price — seller is motivated, your offer sets the floor, not the list.
Questions for the listing agent
- What do current leases actually rent for vs. the listed asking? Can we see a recent rent roll and the last 12 months of T-12 income?
- It's been on market 143 days. Have you received any prior offers? Is the seller open to a 17% concession, seller financing, or rate buy-down credit?
- Built in 1964 — when were the roof, HVAC, electrical panel, plumbing, and water heater last replaced?
- Why hasn't it sold? Are there any deal-killer items the seller is aware of (foundation, flood, title, zoning, code violations)?
- Is there a deadline driving the sale (1031 exchange, divorce, estate, relocation)? That informs how much negotiation room exists.
- Schools are A-rated — typically a magnet for longer-tenancy family renters. What's the average tenant stay here, and is there a school-zone premium baked into asking?
- Crime grade is D in this area — have there been break-ins, vandalism, or insurance claims at this property in the last 3 years? What carrier currently insures it and at what premium?
- The area grade is low — what's the realistic commute time and amenity access for the typical tenant pool here? Any planned neighborhood developments (good or bad) we should know about?
- What's the average days-on-market for RENTAL listings here right now (not sales)? A rising rental-DOM trend means longer vacancies and softer asking-rent achievability than the comps imply.
- What's the recent tenant-quality profile in this submarket — average credit score on applications, eviction rate, late-payment / NSF rate, and stable-employment percentage? A property-management company in the area should have these aggregated.
- How much new apartment / multifamily construction is in the pipeline within 1–3 miles? Heavy new supply (>2% of stock underway) typically softens rents 12–24 months out; light construction supports rent growth.
Investment metrics
- 1% rule
- 0.83% ✗
- Cap rate
- 6.16%
- Cash-on-cash
- -0.46%
- DSCR
- 0.98
- GRM
- 10.0
CMA / ARV
- ARV (median comp)
- $3,460,569
- List price
- $6,500,000
- Delta
- 87.83%
- Verdict
- OVERPRICED
- Comps
- 5 within 2.0 mi
Projected returns pro-forma
-3.0% appreciation · 2.26% rent growth · sell at horizon
- IRR
- -17.9%
- Equity multiple
- 0.37×
- Total profit
- $-1,137,510
- Equity at exit
- $969,171
- IRR
- -11.5%
- Equity multiple
- 0.34×
- Total profit
- $-1,209,332
- Equity at exit
- $562,001
Cash invested: $1,820,000 (down + closing). Projections, not guarantees.
Landlord ↔ Tenant lean methodology
- Overall (STATE)
- 18 Strongly Tenant-Friendly
- State California
- 18 Strongly Tenant-Friendly · D+13
- County
- — inherits STATE
- City
- — inherits STATE
ZIP-level market 90504
- Rents YoY
- 2.3%
- Active inventory
- 34
- Price-to-rent
- 291.1×
Monthly cashflow live
- Estimated rent
- $53,962 medium interval (Pro) →
- Mortgage (P&I)
- −$34,087
- Tax from tax record
- −$6,529 /mo · $78,343/yr
- Insurance
- −$2,708
- HOA
- −$0
- Vacancy / Maint / Mgmt
- −$11,332
- Net cashflow
- $-694
Break-even live
Sensitivity live
| Price | -10% $2,986 | -5% $1,146 | +0% $-694 | +5% $-2,533 | +10% $-4,373 |
|---|---|---|---|---|---|
| Rent | -10% $-4,957 | -5% $-2,825 | +0% $-694 | +5% $1,438 | +10% $3,569 |
| Rate | -1.0pp $2,580 | -0.5pp $960 | base $-694 | +0.5pp $-2,378 | +1.0pp $-4,091 |
29-unit breakdown (identical units grouped — click to expand)
| Units | Beds | Baths | Est. rent |
|---|---|---|---|
| 29× units | 1 | 1 | $53,969 |
| #1 | 1 | 1 | $1,861 |
| #2 | 1 | 1 | $1,861 |
| #3 | 1 | 1 | $1,861 |
| #4 | 1 | 1 | $1,861 |
| #5 | 1 | 1 | $1,861 |
| #6 | 1 | 1 | $1,861 |
| #7 | 1 | 1 | $1,861 |
| #8 | 1 | 1 | $1,861 |
| #9 | 1 | 1 | $1,861 |
| #10 | 1 | 1 | $1,861 |
| #11 | 1 | 1 | $1,861 |
| #12 | 1 | 1 | $1,861 |
| #13 | 1 | 1 | $1,861 |
| #14 | 1 | 1 | $1,861 |
| #15 | 1 | 1 | $1,861 |
| #16 | 1 | 1 | $1,861 |
| #17 | 1 | 1 | $1,861 |
| #18 | 1 | 1 | $1,861 |
| #19 | 1 | 1 | $1,861 |
| #20 | 1 | 1 | $1,861 |
| #21 | 1 | 1 | $1,861 |
| #22 | 1 | 1 | $1,861 |
| #23 | 1 | 1 | $1,861 |
| #24 | 1 | 1 | $1,861 |
| #25 | 1 | 1 | $1,861 |
| #26 | 1 | 1 | $1,861 |
| #27 | 1 | 1 | $1,861 |
| #28 | 1 | 1 | $1,861 |
| #29 | 1 | 1 | $1,861 |
| Total (29 units) | $53,962 | ||
UW: 25.0% down · 7.5% · 30yr · 1.5% tax · 5.0% vac · 8.0% maint · 8.0% mgmt
Financing live
Cash to close
- Down payment
- $1,625,000
- Closing costs
- $195,000
- Reserves months
- —
- Total cash needed
- —
Loan-product check · same deal, 3 products live
Conventional
25% down · 7.5% · 30yr
- Down + closing
- —
- Monthly P&I
- —
- Monthly cashflow
- —
- DSCR
- —
- Eligible?
- —
Personal DTI + credit; lowest rate.
DSCR
20% down · 8.5% · 30yr
- Down + closing
- —
- Monthly P&I
- —
- Monthly cashflow
- —
- DSCR
- —
- Eligible?
- —
No personal income docs; deal must DSCR.
Hard money
10% down · 12.0% · 12mo
- Down + closing
- —
- Monthly P&I
- —
- Monthly cashflow
- —
- DSCR
- —
- Eligible?
- —
Short-term bridge; refi at stabilization.
Listing history 37 events
-
2026-06-21days on market $6,500,000 Active 143 DOM
-
2026-06-18days on market $6,500,000 Active 140 DOM
-
2026-06-17days on market $6,500,000 Active 139 DOM
-
2026-06-16days on market $6,500,000 Active 138 DOM
-
2026-06-15days on market $6,500,000 Active 137 DOM
-
2026-06-13days on market $6,500,000 Active 135 DOM
-
2026-06-13days on market $6,500,000 Active 134 DOM
-
2026-06-09days on market $6,500,000 Active 131 DOM
-
2026-06-08days on market $6,500,000 Active 130 DOM
-
2026-06-07days on market $6,500,000 Active 129 DOM
-
2026-06-04days on market $6,500,000 Active 126 DOM
-
2026-06-03days on market $6,500,000 Active 125 DOM
-
2026-06-02days on market $6,500,000 Active 124 DOM
-
2026-06-01days on market $6,500,000 Active 123 DOM
-
2026-05-31days on market $6,500,000 Active 122 DOM
-
2026-04-09price $6,890,000 1555-char remark
Show marketing remark (1555 chars)
We are proud to present 16925 Prairie Ave – a heavy cash-flowing 29-unit multifamily complex located in the City of Torrance. 16925 Prairie Ave is located in the Northwest region of the City of Torrance adjacent to Alondra Park and all it’s community amenities. The property is conveniently located just off of the 405 freeway and Redondo Beach Blvd, surrounded by Single Family Homes with an average home sales price exceeding $850,000. Additionally, the property is walking distance to several convenience stores and benefits from its proximity to several big-name retailers like Target, Kohls, Ralphs, Total Wine, and Trader Joes to name a few. Tenants value being within reasonable commutes to major employers like LA International Airport, Ports of Long Beach, DTLA, and others in nearby areas. The property offers 29 units, including 2 newly-constructed ADUs that have been leased out at market rate. The unit mix consists of 2, Studios, 24, one-bedrooms, and 3, two-bedroom apartments. Currently the property produces an outstanding annual income of over $643,000. The property has undergone a variety of recent capital improvements including a newly paved parking lot, a new room on 2 of the 3 buildings, electrical improvements, majority newer windows, renovated units, and more. A new investor will recognize the benefit of the heavy-cashflow through the capability of leveraging higher LTV debt opportunities. Tenants enjoy a grassy open courtyard space, on-site gated parking, and access to multiple laundry facilities.
-
2026-03-17price $6,990,000 1555-char remark
Show marketing remark (1555 chars)
We are proud to present 16925 Prairie Ave – a heavy cash-flowing 29-unit multifamily complex located in the City of Torrance. 16925 Prairie Ave is located in the Northwest region of the City of Torrance adjacent to Alondra Park and all it’s community amenities. The property is conveniently located just off of the 405 freeway and Redondo Beach Blvd, surrounded by Single Family Homes with an average home sales price exceeding $850,000. Additionally, the property is walking distance to several convenience stores and benefits from its proximity to several big-name retailers like Target, Kohls, Ralphs, Total Wine, and Trader Joes to name a few. Tenants value being within reasonable commutes to major employers like LA International Airport, Ports of Long Beach, DTLA, and others in nearby areas. The property offers 29 units, including 2 newly-constructed ADUs that have been leased out at market rate. The unit mix consists of 2, Studios, 24, one-bedrooms, and 3, two-bedroom apartments. Currently the property produces an outstanding annual income of over $643,000. The property has undergone a variety of recent capital improvements including a newly paved parking lot, a new room on 2 of the 3 buildings, electrical improvements, majority newer windows, renovated units, and more. A new investor will recognize the benefit of the heavy-cashflow through the capability of leveraging higher LTV debt opportunities. Tenants enjoy a grassy open courtyard space, on-site gated parking, and access to multiple laundry facilities.
-
2026-01-29$7,200,000 Active 1555-char remark
Show marketing remark (1555 chars)
We are proud to present 16925 Prairie Ave – a heavy cash-flowing 29-unit multifamily complex located in the City of Torrance. 16925 Prairie Ave is located in the Northwest region of the City of Torrance adjacent to Alondra Park and all it’s community amenities. The property is conveniently located just off of the 405 freeway and Redondo Beach Blvd, surrounded by Single Family Homes with an average home sales price exceeding $850,000. Additionally, the property is walking distance to several convenience stores and benefits from its proximity to several big-name retailers like Target, Kohls, Ralphs, Total Wine, and Trader Joes to name a few. Tenants value being within reasonable commutes to major employers like LA International Airport, Ports of Long Beach, DTLA, and others in nearby areas. The property offers 29 units, including 2 newly-constructed ADUs that have been leased out at market rate. The unit mix consists of 2, Studios, 24, one-bedrooms, and 3, two-bedroom apartments. Currently the property produces an outstanding annual income of over $643,000. The property has undergone a variety of recent capital improvements including a newly paved parking lot, a new room on 2 of the 3 buildings, electrical improvements, majority newer windows, renovated units, and more. A new investor will recognize the benefit of the heavy-cashflow through the capability of leveraging higher LTV debt opportunities. Tenants enjoy a grassy open courtyard space, on-site gated parking, and access to multiple laundry facilities.
-
2022-02-10historical
-
2021-11-30price
-
2021-11-18price
-
2021-11-05price
-
2021-10-29Active
-
2020-12-31soldstatus $6,173,000
-
2020-12-30soldstatus $6,173,000 Sold
-
2020-10-29status Pending
-
2020-05-11$6,399,000 Active
-
2017-11-22soldstatus $5,200,000 Closed Sale
-
2017-11-22soldstatus $5,200,000
-
2017-11-22soldstatus $5,200,000
-
2017-09-14status Pending Sale
-
2017-03-10$5,200,000 Active
-
2017-03-10$5,200,000
-
2016-03-31historical
-
2016-03-31historical
-
2015-03-30$4,300,000 Active
-
2015-03-30$4,300,000
ⓘ Source: listings_history table (triggers on properties + properties_extension) + one-shot
backfill from property_details.listing_events for pre-trigger history.
Tax reassessment forecast CA · Resets to sale price
- Current annual tax
- $78,343 · $6,529/mo
- Projected year-2 tax
- $78,343 · $6,529/mo
- Expected delta
- $0/yr ($0/mo · 0.0%)
ⓘ Screening estimate from a state-policy table — verify with the county assessor before closing.
Climate risk First Street
- Flood 3/10 Moderate FEMA zone X (unshaded) · 20% chance over 30 yrs
- Wildfire 2/10 Low
- Heat 4/10 Moderate 5 d/yr ≥86°F today · 14 d/yr by 30 yrs out
- Wind 1/10 Low
- Air quality 5/10 Major 7 unhealthy d/yr today · 7 by 30 yrs out
Nearby sold comps map
Loading sold comps map…
Walkable amenities ~0.75 mi
Loading nearby amenities…
Taxation est. · year 1
- Rental income
- $647,544
- − Mortgage interest
- −$364,101
- − Property taxes
- −$78,343
- − Insurance
- −$32,500
- − Repairs & maintenance
- −$51,804
- − Management
- −$51,804
- − Depreciation
- −$189,091
- Taxable loss
- −$120,098
- Est. tax savings @ 24.0%
- +$28,823
- After-tax cash flow
- $20,500/yr
For passive investors: Depreciation is non-cash, so a rental often shows a tax loss while cash-flowing — sheltering income. Rental losses are passive: they offset passive income freely, and up to $25,000/yr can offset ordinary (W-2) income if you actively participate and your MAGI is under $100k (phasing out to $0 by $150k); unused losses carry forward. On sale, claimed depreciation is recaptured at up to 25%, and gains may owe capital-gains tax (a 1031 exchange can defer both). Figures are a year-1 estimate at your 24.0% rate — not tax advice; consult a CPA.
Schools (NCES district)
- District
- Torrance Unified
- NCES district ID
- 0639420
- Math proficiency
- 62% ▲ 2.00%
- Reading proficiency
- 67% ▬ 0.00%
- Median HH income
- $78,640
- Composite
- 58.96/100
- National rank
- #1969
- State rank
- #150 of 1400 in CA
Livability — Torrance
- Score
- 76/100
- State rank
- #95
- US rank
- #3501
Category grades
Schools grade is shown separately in the Schools card above.
Census & demographics
- Census place
- Torrance, CA
- County
- Los Angeles County · 9,444,647 people
- City population
- 153,473
- Metro
- Los Angeles-Long Beach-Anaheim, CA
- Population (ZIP)
- 33,084
- Household income
- $107,552
- Rent vs Own
- Severe rent burden
- 1335.0
Population outlook (Los Angeles County) Hauer SSP2
- Today (2025)
- 10,940,515 people
- By 2030
- 11,256,481 · +2.9%
- By 2040
- 11,729,929 · +7.2%
- By 2050
- 11,948,407 · +9.2%
- By 2075
- 11,818,114 · +8.0%
- By 2100
- 10,842,928 · -0.9%
Race, ethnicity, and origin ACS 2023
- Neighborhood character
- Highly diverse neighborhood (Simpson 0.72)
- Race & ethnicity
- Asian 39% Hispanic / Latino 26% White 24% Two or more races 16% Black 4%
- Hispanic origin (detail)
- Mexican 18%
- Common ancestry
- Lithuanian 1% Slovak 1% Portuguese 1%
- Foreign-born
- 29% · Canada, South Korea, Vietnam
- Languages at home
- 57% English-only · Spanish 14% Other Asian/Pacific 6% Korean 5%
Political lean MEDSL · Los Angeles
- 2024 margin
- Solid D (+32.9) · D 64.8% · R 31.9% · Other 3.3%
- 2008→2024 swing
- -7.4pp toward R · 2008: 40.4pp · 2024: 32.9pp
- All cycles
- 2024: D+32.9 2020: D+44.2 2016: D+48.0 2012: D+40.0 2008: D+40.4
Not yet ingested
- Civics
- —
Market trends
- HPI YoY
- ▼ -940.72%
- Current HPI
- 387.9811
- Rent YoY
- ▲ 2.26%
- Metro
- Los Angeles-Long Beach-Anaheim, CA
- State GDP YoY
- ▲ 3.21%
- F500 in state
- 116
Industry mix (Fortune 500 HQ in CA)
| Industry | F500 HQs | Revenue |
|---|---|---|
| Technology | 27 | $1,492B |
|
||
| Financial Services | 3 | $174B |
|
||
| Retail | 3 | $44B |
|
||
| Insurance | 3 | $26B |
|
||
| Media / Entertainment | 2 | $115B |
|
||
| Pharmaceuticals / Biotech | 2 | $62B |
|
||
Price history
+60.2% since first listed22 events — show timeline
- 2026-04-09 Price Changed $6,890,000 CRMLS
- 2026-03-17 Price Changed $6,990,000 CRMLS
- 2026-01-29 Listed $7,200,000 CRMLS
- 2022-02-10 Delisted — TheMLS
- 2021-11-30 Price Changed — TheMLS
- 2021-11-18 Price Changed — TheMLS
- 2021-11-05 Price Changed — TheMLS
- 2021-10-29 Listed — TheMLS
- 2020-12-31 Sold (Public Records) $6,173,000 Public Records
- 2020-12-30 Sold (MLS) $6,173,000 TheMLS
- 2020-10-29 Pending — TheMLS
- 2020-05-11 Listed $6,399,000 TheMLS
- 2017-11-22 Sold (Public Records) $5,200,000 Public Records
- 2017-11-22 Sold (MLS) $5,200,000 SDMLS
- 2017-11-22 Sold (MLS) $5,200,000 CRMLS
- 2017-09-14 Pending — CRMLS
- 2017-03-10 Listed $5,200,000 CRMLS
- 2017-03-10 Listed $5,200,000 SDMLS
- 2016-03-31 Listing Removed — SDMLS
- 2016-03-31 Listing Removed — CRMLS
- 2015-03-30 Listed $4,300,000 CRMLS
- 2015-03-30 Listed $4,300,000 SDMLS
Property tax history
+9.0%/yrLatest (2025): $78,343 · +1.1% YoY. Source: county tax records.
Cash-flow waterfall
monthlySold comps — $/sqft
last 12 mo · ≤1 miLoading sold comps…