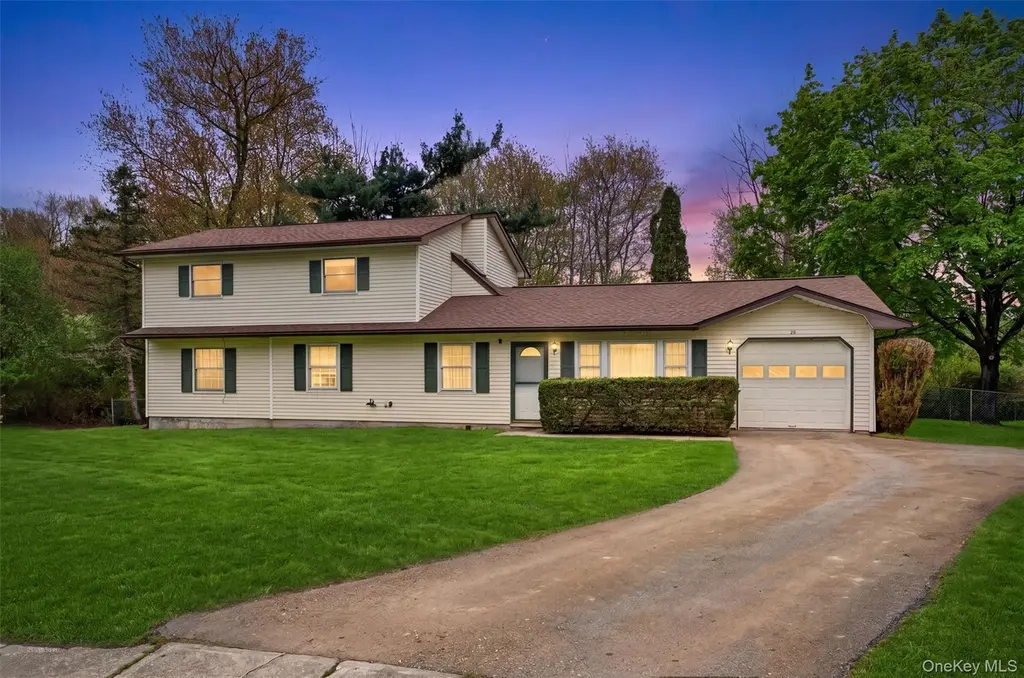
20 Oneil Cir · Monroe, NY
Flood risk 6/10 · Moderate
- FEMA flood zone
- X (unshaded)
- Chance of flooding over 30 yrs
- 0.74%
- Est. flood insurance / yr
- $473 – $860
Fire risk 4/10 · Minor
- Est. fire insurance / yr
- $691 – $1,283
Heat risk 4/10 · Minor
- Hot days now (above 96°F)
- 7 days/yr
- Hot days in 30 yrs
- 15 days/yr
Wind risk 4/10 · Minor
- Chance of severe wind over 30 yrs
- 16.0%
Air-quality risk 2/10 · Minimal
- Unhealthy air days now
- 2 days/yr
- Unhealthy air days in 30 yrs
- 2 days/yr
Risk factors via First Street. Map © Google.
Why this score? — see what drove the D grade
The composite is a weighted blend of 9 inputs, each scored 0–100. Each bar is that input's sub-score; the figure is the points it added to the 100-point composite (weight × sub-score).
- ARV discount +14.0/15.0
- Cash flow +7.6/30.0
- Schools +5.0/10.0
- Livability +3.6/5.0
- 1% rule +3.1/10.0
- Rent growth +2.9/5.0
- Condition / age +2.5/5.0
- DSCR +1.7/10.0
- Appreciation +0.0/10.0
$550,000
🖨 Deal sheet (PDF) 📄 Offer letter ✓ Due diligence
Listing remarks
Welcome to 20 O’Neil Circle! A beautifully maintained 5-bedroom home nestled on a desirable cul-de-sac, offering a unique and versatile floor plan perfect for today’s lifestyle. Step inside to discover a warm and inviting layout featuring both a spacious living room and a cozy family room with custom built-ins & gas stove, ideal for relaxing or entertaining. The dining area flows seamlessly into the kitchen, which boasts ceramic flooring, crisp white cabinetry, granite countertops, and a convenient pantry. Designed with comfort and convenience in mind, the first-floor primary bedroom includes a private half-bath ensuite, making one-level living a breeze. A second generous
Key facts
- 9,720 sq ft lot
- Garage
- Built 1976
Property features AI
Exterior
- Parking: Driveway; 1-car garage
- Utilities: Public sewer; Electric service by Orange & Rockland; Underground utilities
- Home design: Single family residence; Two levels
- Construction: Frame construction; Block foundation
- Exterior features: Back yard; Level lot; Back yard fencing; Patio; Porch; Screened porch
Interior
- Kitchen: Dishwasher; Electric range; Refrigerator; Granite counters
- Bedrooms: Master bedroom located downstairs
- Flooring: Carpet; Ceramic tile; Wood
- Bathrooms: 2 full bathrooms; 1 half bathroom
- Heating & cooling: Baseboard heating; Central air conditioning
- Interior features: First-floor bedroom; First-floor full bath; Ceiling fans; Granite counters; Primary bathroom; Master bedroom on main level; Walk-in closets; Washer/dryer hookup; Patio, porch and screened porch
- Laundry & utility: Laundry area in kitchen; Washer/dryer hookup
Neighborhood map
What this means for you Summary
Snapshot
- This is a 5-bed/2.0-bath single-family listed at $550k.
Deal economics
- At list price, monthly cash flow is $-656 ($-8k/yr) — negative.
- To cash-flow at today's rent, offer at most $434k (21.1% below list).
- To meet the 1% rule (rent ≥ 1% of price), the offer needs to be $445k (19.0% below list).
- Recommended offer: $434k (21.1% below list) — sets the bar for cash-flow.
- Cap rate 4.9% vs local median 3.3% in Monroe — top-decile yield for the area; either an underpriced asset or a hidden risk that comps aren't pricing in. Stress-test before assuming the spread holds.
Location & tenants
- Location reads 72/100 on livability (#351 in NY) — a middle-class / working-renter tenant base. Strengths: employment A+, housing A+, health & safety A+; Watch: amenities F, commute F, cost of living F.
- Monroe-Woodbury Central School District (suburban): math 50% / reading 56% proficiency, ranked #250 of 590 in NY (top 42%) — acceptable for families but not a draw, mixed tenant base, ~2y average lease; only 15% free/reduced lunch — higher-income household profile.
- Zoned schools: Pine Tree Elementary School (math 43% / reading 48%, grade D-, #1,271 of 2,108 statewide, top 60%, 786 students, 42% FRL); Monroe-Woodbury Middle School (math 28% / reading 50%, grade F, #433 of 729 statewide, top 60%, 1,584 students, 40% FRL); Monroe-Woodbury High School (math 98% / reading 95%, grade A+, #56 of 1,100 statewide, top 5%, 2,353 students, 33% FRL) — zoned schools average 38% FRL vs 15% district-wide (24 pts higher); higher-poverty schools than district average — tighter screening recommended.
- Market conditions: Rents rising (+1.5%/yr); 322 active listings in the ZIP; 9 comparable units currently listed for rent nearby; rentals at typical pace (median 25d on market — plan ~3-4 weeks tenant-placement turnaround); solid renter incomes; 1,746 units permitted in Orange County in 2024 (1,265 in 5+ unit buildings).
- At $4,454/mo this rent would consume 68% of the median local household income ($79k/yr) (locally 3149% of renters already pay >50% of income on rent) — very limited rent-growth headroom before tenants either downsize or default.
Forward outlook
- Local home prices are declining (-3.0%/yr); year-one equity from $4k of loan paydown is wiped out by about $16k of value loss. Plan a longer hold.
Negotiation context
- It's been on market 49 days — a 3% lower offer ($534k) is reasonable based on typical stale-listing flexibility.
- Current owner paid $76k; list at $550k implies a 624% gain — meaningful room to come down on a strong offer.
Risks & watch-outs
- Climate carrying-cost: major flood risk — expect insurance premiums to compound above CPI over the hold.
Questions for the listing agent
- What do current leases actually rent for vs. the listed asking? Can we see a recent rent roll and the last 12 months of T-12 income?
- It's been on market 49 days. Have you received any prior offers? Is the seller open to a 21% concession, seller financing, or rate buy-down credit?
- Built in 1976 — when were the roof, HVAC, electrical panel, plumbing, and water heater last replaced?
- Is there a deadline driving the sale (1031 exchange, divorce, estate, relocation)? That informs how much negotiation room exists.
- Schools are B-rated — typically a magnet for longer-tenancy family renters. What's the average tenant stay here, and is there a school-zone premium baked into asking?
- The area grade is low — what's the realistic commute time and amenity access for the typical tenant pool here? Any planned neighborhood developments (good or bad) we should know about?
- What's the average days-on-market for RENTAL listings here right now (not sales)? A rising rental-DOM trend means longer vacancies and softer asking-rent achievability than the comps imply.
- What's the recent tenant-quality profile in this submarket — average credit score on applications, eviction rate, late-payment / NSF rate, and stable-employment percentage? A property-management company in the area should have these aggregated.
- How much new for-sale + rental construction is in the pipeline within 1–3 miles? Heavy new supply typically softens prices + rents 12–24 months out; constrained supply supports both.
Investment metrics
- 1% rule
- 0.81% ✗
- Cap rate
- 4.86%
- Cash-on-cash
- -5.11%
- DSCR
- 0.77
- GRM
- 10.3
CMA / ARV
- ARV (median comp)
- $642,425
- List price
- $550,000
- Delta
- -14.39%
- Verdict
- UNDERPRICED
- Comps
- 20 within 1.0 mi
Show comp detail 5 sales within ~0.75 mi
| Address | Dist | Beds/Ba | Sqft | Sold | Price | $/sf | Match |
|---|---|---|---|---|---|---|---|
| 46 Moulton Cir | 0.18mi | 4/3.0 (-1) | 2,270 (+2%) | 1mo | $625,000 | $275 | 78 |
| 21 Winchester Dr | 0.60mi | 4/2.5 (-1) | 2,129 (-4%) | 20mo | $622,000 | $292 | 41 |
| 20 Forestdale Ave | 0.58mi | 4/2.5 (-1) | 1,976 (-11%) | 10mo | $605,000 | $306 | 39 |
| 144 Lakes Rd | 0.65mi | 4/2.0 (-1) | 2,030 (-9%) | 14mo | $475,000 | $234 | 39 |
| 4 Seals Dr | 0.68mi | 4/3.5 (-1) | 2,000 (-10%) | 8mo | $670,000 | $335 | 35 |
Match score weights: distance 35% · size 25% · config 20% · recency 20%. Top-matched comps best support the ARV.
Projected returns pro-forma
-3.0% appreciation · 1.5% rent growth · sell at horizon
- IRR
- -26.8%
- Equity multiple
- 0.11×
- Total profit
- $-137,252
- Equity at exit
- $82,007
- IRR
- -30.9%
- Equity multiple
- -0.29×
- Total profit
- $-198,508
- Equity at exit
- $47,554
Cash invested: $154,000 (down + closing). Projections, not guarantees.
Landlord ↔ Tenant lean methodology
- Overall (STATE)
- 15 Strongly Tenant-Friendly
- State New York
- 15 Strongly Tenant-Friendly · D+10
- County
- — inherits STATE
- City
- — inherits STATE
ZIP-level market 10950
- Rents YoY
- 1.5%
- Active inventory
- 322
- Price-to-rent
- 10.3×
Monthly cashflow live
- Estimated rent
- $4,454 high interval (Pro) →
- Mortgage (P&I)
- −$2,884
- Tax from tax record
- −$1,062 /mo · $12,741/yr
- Insurance
- −$229
- HOA
- −$0
- Vacancy / Maint / Mgmt
- −$935
- Net cashflow
- $-656
Break-even live
Sensitivity live
| Price | -10% $-345 | -5% $-501 | +0% $-656 | +5% $-812 | +10% $-968 |
|---|---|---|---|---|---|
| Rent | -10% $-1,008 | -5% $-832 | +0% $-656 | +5% $-480 | +10% $-304 |
| Rate | -1.0pp $-379 | -0.5pp $-516 | base $-656 | +0.5pp $-799 | +1.0pp $-944 |
UW: 25.0% down · 7.5% · 30yr · 1.5% tax · 5.0% vac · 8.0% maint · 8.0% mgmt
Financing live
Cash to close
- Down payment
- $137,500
- Closing costs
- $16,500
- Reserves months
- —
- Total cash needed
- —
Loan-product check · same deal, 3 products live
Conventional
25% down · 7.5% · 30yr
- Down + closing
- —
- Monthly P&I
- —
- Monthly cashflow
- —
- DSCR
- —
- Eligible?
- —
Personal DTI + credit; lowest rate.
DSCR
20% down · 8.5% · 30yr
- Down + closing
- —
- Monthly P&I
- —
- Monthly cashflow
- —
- DSCR
- —
- Eligible?
- —
No personal income docs; deal must DSCR.
Hard money
10% down · 12.0% · 12mo
- Down + closing
- —
- Monthly P&I
- —
- Monthly cashflow
- —
- DSCR
- —
- Eligible?
- —
Short-term bridge; refi at stabilization.
Rent comps 9 comps
| Address | Beds | Baths | Sqft | Rent | $/sqft | DOM | Units | Dist |
|---|---|---|---|---|---|---|---|---|
| 11 Ethan Cir Monroe, NY | 5.0 | 2.5 | 1854 | $3,800 | $2.05 | 15d | 1 | 0.20mi |
| 4 Millard Cir Monroe, NY | 4.0 | 3.0 | 2319 | $5,200 | $2.24 | 25d | 1 | 0.31mi |
| 9 Summit Pl Monroe, NY | 4.0 | 2.0 | 1427 | $3,300 | $2.31 | 46d | 1 | 0.89mi |
| 7 Brewster Rd Monroe, NY | 4.0 | 2.0 | 3000 | $3,800 | $1.27 | 15d | 1 | 1.01mi |
| 11 Peterson Rd Monroe, NY | 4.0 | 2.5 | 2988 | $4,300 | $1.44 | 25d | 1 | 1.06mi |
| 454 Round Lake Park Rd Monroe, NY | 4.0 | 2.0 | 1675 | $3,900 | $2.33 | 25d | 1 | 1.08mi |
| 80 N Main St Monroe, NY | 4.0 | 2.0 | 1722 | $2,900 | $1.68 | 15d | 1 | 1.09mi |
| 79 Quaker Hill Rd Unit 2 Monroe, NY | 5.0 | 2.0 | 2084 | $3,300 | $1.58 | 45d | 1 | 1.19mi |
| 79 Quaker Hill Rd Monroe, NY | 5.0 | 3.0 | 2300 | $3,300 | $1.43 | 45d | 1 | 1.19mi |
Listing history 19 events
-
2026-06-21days on market $550,000 Active 49 DOM
-
2026-06-18days on market $550,000 Active 46 DOM
-
2026-06-17days on market $550,000 Active 45 DOM
-
2026-06-16days on market $550,000 Active 44 DOM
-
2026-06-15days on market $550,000 Active 43 DOM
-
2026-06-14days on market $550,000 Active 41 DOM
-
2026-06-10days on market $550,000 Active 38 DOM
-
2026-06-09days on market $550,000 Active 37 DOM
-
2026-06-08days on market $550,000 Active 36 DOM
-
2026-06-07days on market $550,000 Active 35 DOM
-
2026-06-05days on market $550,000 Active 32 DOM
-
2026-06-03days on market $550,000 Active 31 DOM
-
2026-06-02pricedays on market $550,000 Active 30 DOM
-
2026-06-01days on market $560,000 Active 29 DOM
-
2026-05-31days on market $560,000 Active 28 DOM
-
2026-05-30days on market $560,000 Active 27 DOM
-
2026-05-04$575,000 Active 1513-char remark
-
2026-05-01historical $575,000 1513-char remark
-
1984-09-01soldstatus $76,000
ⓘ Source: listings_history table (triggers on properties + properties_extension) + one-shot
backfill from property_details.listing_events for pre-trigger history.
Tax reassessment forecast NY · Partial reset (capped growth)
- Current annual tax
- $12,741 · $1,062/mo
- Projected year-2 tax
- $12,741 · $1,062/mo
- Expected delta
- $0/yr ($0/mo · 0.0%)
ⓘ Screening estimate from a state-policy table — verify with the county assessor before closing.
Climate risk First Street
- Flood 6/10 Major FEMA zone X (unshaded) · 74% chance over 30 yrs
- Wildfire 4/10 Moderate
- Heat 4/10 Moderate 7 d/yr ≥96°F today · 15 d/yr by 30 yrs out
- Wind 4/10 Moderate 16% chance of damaging wind over 30 yrs
- Air quality 2/10 Low 2 unhealthy d/yr today · 2 by 30 yrs out
Nearby sold comps map
Loading sold comps map…
Walkable amenities ~0.75 mi
Loading nearby amenities…
Taxation est. · year 1
- Rental income
- $53,451
- − Mortgage interest
- −$30,809
- − Property taxes
- −$12,741
- − Insurance
- −$2,750
- − Repairs & maintenance
- −$4,276
- − Management
- −$4,276
- − Depreciation
- −$16,000
- Taxable loss
- −$17,401
- Est. tax savings @ 24.0%
- +$4,176
- After-tax cash flow
- $-3,700/yr
For passive investors: Depreciation is non-cash, so a rental often shows a tax loss while cash-flowing — sheltering income. Rental losses are passive: they offset passive income freely, and up to $25,000/yr can offset ordinary (W-2) income if you actively participate and your MAGI is under $100k (phasing out to $0 by $150k); unused losses carry forward. On sale, claimed depreciation is recaptured at up to 25%, and gains may owe capital-gains tax (a 1031 exchange can defer both). Figures are a year-1 estimate at your 24.0% rate — not tax advice; consult a CPA.
Schools (NCES district)
- District
- Monroe-Woodbury Central School District
- NCES district ID
- 3619650
- Math proficiency
- 50% ▼ -17.00%
- Reading proficiency
- 56% ▼ -1.00%
- Median HH income
- $104,681
- Composite
- 50.48/100
- National rank
- #1855
- State rank
- #250 of 590 in NY
Livability — Monroe
- Score
- 72/100
- State rank
- #351
- US rank
- #5919
Category grades
Schools grade is shown separately in the Schools card above.
Census & demographics
- Census place
- Monroe, NY
- County
- Orange County · 267,004 people
- City population
- 68,136
- Metro
- Poughkeepsie-Newburgh-Middletown, NY
- Population (ZIP)
- 68,136
- Household income
- $78,931
- Rent vs Own
- Severe rent burden
- 3149.0
Population outlook (Orange County) Hauer SSP2
- Today (2025)
- 379,830 people
- By 2030
- 378,955 · -0.2%
- By 2040
- 375,444 · -1.2%
- By 2050
- 369,311 · -2.8%
- By 2075
- 354,233 · -6.7%
- By 2100
- 318,150 · -16.2%
Race, ethnicity, and origin ACS 2023
- Neighborhood character
- Predominantly White (81%)
- Race & ethnicity
- White 81% Hispanic / Latino 12% Two or more races 6% Black 3% Asian 1%
- Hispanic origin (detail)
- Puerto Rican 5% Dominican 2%
- Common ancestry
- Romanian 3% Scandinavian 2% Italian 2%
- Foreign-born
- 11% · Canada, Dominican Republic
- Languages at home
- 33% English-only · German/W. Germanic 52% Spanish 9% Russian/Polish/Slavic 1%
Political lean MEDSL · Orange
- 2024 margin
- Lean R (+8.4) · D 45.8% · R 54.2%
- 2008→2024 swing
- -12.5pp toward R · 2008: 4.1pp · 2024: -8.4pp
- All cycles
- 2024: R+8.4 2020: R+0.2 2016: R+6.5 2012: D+5.2 2008: D+4.1
Not yet ingested
- Civics
- —
Market trends
- HPI YoY
- ▼ -309.81%
- Current HPI
- 314.2081
- Rent YoY
- ▲ 1.50%
- Metro
- Poughkeepsie-Newburgh-Middletown, NY
- State GDP YoY
- ▲ 2.60%
- F500 in state
- 92
Industry mix (Fortune 500 HQ in NY)
| Industry | F500 HQs | Revenue |
|---|---|---|
| Financial Services | 10 | $950B |
|
||
| Consumer Goods | 9 | $162B |
|
||
| Insurance | 4 | $225B |
|
||
| Telecommunications | 2 | $144B |
|
||
| Pharmaceuticals | 2 | $112B |
|
||
| Media / Entertainment | 2 | $69B |
|
||
Price history
+623.7% since first listed5 events — show timeline
- 2026-06-01 Price Changed $550,000 OneKey® MLS as Distributed by MLS Grid
- 2026-05-21 Price Changed $560,000 OneKey® MLS as Distributed by MLS Grid
- 2026-05-04 Listed $575,000 OneKey® MLS as Distributed by MLS Grid
- 2026-05-01 Coming Soon $575,000 OneKey® MLS as Distributed by MLS Grid
- 1984-09-01 Sold (Public Records) $76,000 Public Records
Property tax history
+2.1%/yrLatest (2025): $12,741 · +2.2% YoY. Source: county tax records.
Cash-flow waterfall
monthlySold comps — $/sqft
last 12 mo · ≤1 miLoading sold comps…