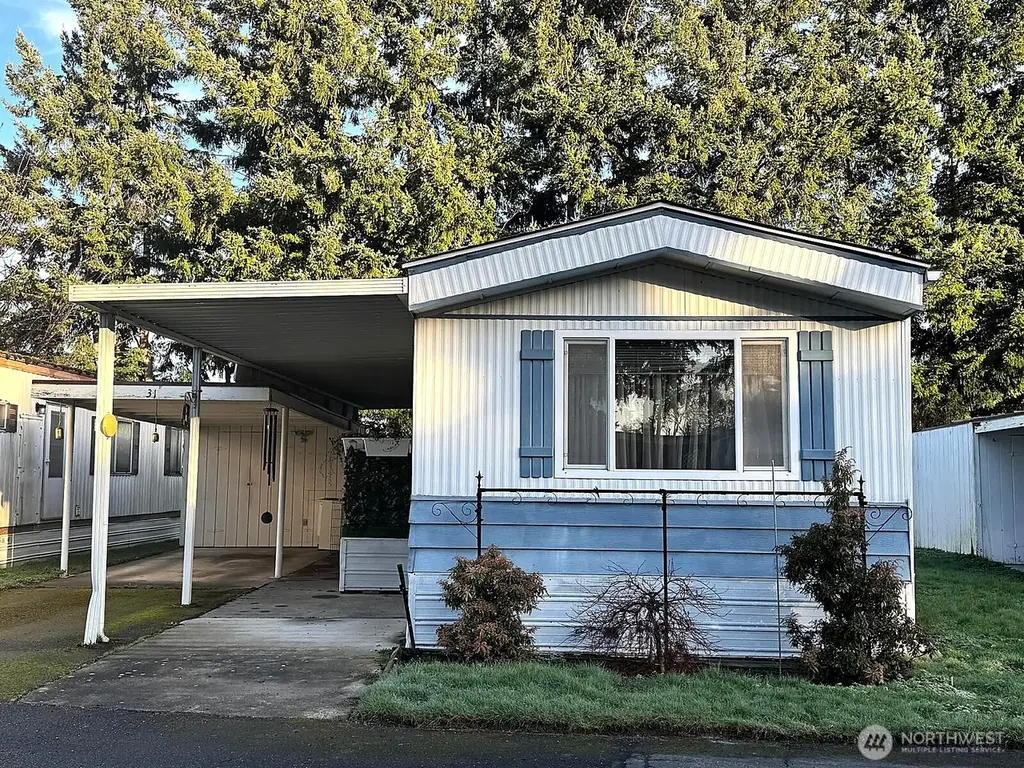
2210 Old Highway 99 South Rd #31 · Mount Vernon, WA
Flood risk 4/10 · Minor
- FEMA flood zone
- AO
- Chance of flooding over 30 yrs
- 0.22%
- Est. flood insurance / yr
- $848 – $2,087
Fire risk 3/10 · Minor
- Est. fire insurance / yr
- $604 – $1,122
Heat risk 2/10 · Minimal
- Hot days now (above 81°F)
- 7 days/yr
- Hot days in 30 yrs
- 18 days/yr
Wind risk 1/10 · Minimal
- Chance of severe wind over 30 yrs
- —
Air-quality risk 5/10 · Moderate
- Unhealthy air days now
- 7 days/yr
- Unhealthy air days in 30 yrs
- 7 days/yr
Risk factors via First Street. Map © Google.
Why this score? — see what drove the B- grade
The composite is a weighted blend of 9 inputs, each scored 0–100. Each bar is that input's sub-score; the figure is the points it added to the 100-point composite (weight × sub-score).
- Cash flow +30.0/30.0
- 1% rule +10.0/10.0
- DSCR +10.0/10.0
- ARV discount +4.5/15.0
- Schools +4.0/10.0
- Livability +4.0/5.0
- Rent growth +3.1/5.0
- Condition / age +2.5/5.0
- Appreciation +0.0/10.0
$50,000
🖨 Deal sheet 📄 Offer letter ✓ Due diligence
Listing remarks
Located in the friendly 55+ Evergreen Mobile Home Park, this well-maintained single-wide manufactured home offers comfortable, low-maintenance living at an affordable price point. Recent updates include a new dishwasher, new range, new refrigerator and a ductless mini-split system providing efficient heating and cooling—over $12,000 in improvements and extras already completed. All appliances are included. The kitchen offers good storage, and the laundry area is conveniently located near the bedrooms. The bathroom features an updated shower with a fold-down mounted chair for added accessibility. A bonus room provides extra flexible space for storage, hobbies, or a small office. Outsid
Key facts
- Bonus room
- New range
- New refrigerator
Tags
Neighborhood map
What this means for you Summary
Snapshot
- This is a 2-bed/1.0-bath manufactured listed at $50k.
Deal economics
- At list price, monthly cash flow is $1k ($14k/yr) — positive.
- The deal already cash-flows at list — no discount required.
- Meets the 1% rule at list price ($2k rent vs $50k).
- Recommended offer: $46k (9.0% below list) — sets the bar for market timing.
- Cap rate 37.4% vs local median 2.4% in Mount Vernon — top-decile yield for the area; either an underpriced asset or a hidden risk that comps aren't pricing in. Stress-test before assuming the spread holds.
Location & tenants
- Location reads 79/100 on livability (#106 in WA, #2,120 nationally) — a middle-class / working-renter tenant base. Strengths: commute A+, housing A+, health & safety A+; Watch: cost of living D+.
- Mount Vernon School District (urban): math 41% / reading 47% proficiency, ranked #189 of 291 in WA (top 65%) — families likely to look elsewhere, expect single-tenant / working-renter base with shorter leases.
- Market conditions: Rents rising (+2.3%/yr); 199 active listings in the ZIP; 5 comparable units currently listed for rent nearby; rentals lingering (median 44d on market — plan ~5-8 weeks vacancy on turnover, expect pricing pressure); 80% of comp listings sitting > 30 days — soft ceiling on asking rent; solid renter incomes; 561 units permitted in Skagit County in 2024 (270 in 5+ unit buildings).
- This rent runs 32% of the median local income ($77k/yr) — at the standard rent-burdened threshold; future hikes will face affordability resistance.
Forward outlook
- Local home prices are declining (-3.0%/yr); year-one equity from $346 of loan paydown is wiped out by about $2k of value loss. Plan a longer hold.
- Skagit County population projected at +11% by 2050 — modest demand growth; plan on rents tracking national, not racing it.
- At projected returns (-3.0% appreciation + 2.3% rent growth), your $14k cash investment doubles in ~2 years — after that, you're playing with house money.
Negotiation context
- It's been on market 103 days — a 9% lower offer ($46k) is reasonable based on typical stale-listing flexibility.
- 2 sale attempts since 2y ago; this cycle's ask has dropped $6k (11%) from the opening price — seller is motivated, your offer sets the floor, not the list.
- Current owner paid $40k; 25% above their basis — modest negotiation headroom, anchor on the comps not their cost.
Risks & watch-outs
- Watch-outs: flood insurance adds $122/mo.
- Climate carrying-cost: in FEMA flood zone AO (mandatory federal flood insurance) — expect insurance premiums to compound above CPI over the hold.
Questions for the listing agent
- It's been on market 103 days. Have you received any prior offers? Is the seller open to a 9% concession, seller financing, or rate buy-down credit?
- Built in 1977 — when were the roof, HVAC, electrical panel, plumbing, and water heater last replaced?
- What's the actual annual flood-insurance premium (NFIP or private), and is the property in a SFHA with mandatory coverage?
- Why hasn't it sold? Are there any deal-killer items the seller is aware of (foundation, flood, title, zoning, code violations)?
- Is there a deadline driving the sale (1031 exchange, divorce, estate, relocation)? That informs how much negotiation room exists.
- What's the average days-on-market for RENTAL listings here right now (not sales)? A rising rental-DOM trend means longer vacancies and softer asking-rent achievability than the comps imply.
- What's the recent tenant-quality profile in this submarket — average credit score on applications, eviction rate, late-payment / NSF rate, and stable-employment percentage? A property-management company in the area should have these aggregated.
- How much new for-sale + rental construction is in the pipeline within 1–3 miles? Heavy new supply typically softens prices + rents 12–24 months out; constrained supply supports both.
Investment metrics
- 1% rule
- 4.03% ✓
- Cap rate
- 37.36%
- Cash-on-cash
- 110.94%
- DSCR
- 5.94
- GRM
- 2.1
CMA / ARV
- ARV (median comp)
- $46,849
- List price
- $50,000
- Delta
- 6.73%
- Verdict
- FAIR
- Comps
- 4 within 1.0 mi
Show comp detail 5 sales within ~0.75 mi
| Address | Dist | Beds/Ba | Sqft | Sold | Price | $/sf | Match |
|---|---|---|---|---|---|---|---|
| 2210 Old Highway 99 South Rd #31 | 0.00mi | 2/1.0 | 938 (0%) | 0mo | $45,000 | $48 | 100 |
| 2210 Old Highway 99 S #12 | 0.06mi | 2/1.0 | 924 (-2%) | 6mo | $20,000 | $22 | 90 |
| 2522 Old Highway 99 Rd S #6 | 0.21mi | 2/1.0 | 980 (+4%) | 1mo | $60,000 | $61 | 82 |
| 2210 Old Hwy 99 St | 0.06mi | 2/2.0 | 924 (-2%) | 15mo | $30,000 | $32 | 79 |
| 1009 Parkside Ter | 0.23mi | 2/1.0 | 800 (-15%) | 24mo | $61,000 | $76 | 45 |
Match score weights: distance 35% · size 25% · config 20% · recency 20%. Top-matched comps best support the ARV.
Projected returns pro-forma
-3.0% appreciation · 2.33% rent growth · sell at horizon
- IRR
- —
- Equity multiple
- 5.66×
- Total profit
- $65,270
- Equity at exit
- $7,455
- IRR
- —
- Equity multiple
- 11.56×
- Total profit
- $147,800
- Equity at exit
- $4,323
Cash invested: $14,000 (down + closing). Projections, not guarantees.
Landlord ↔ Tenant lean methodology
- Overall (STATE)
- 28 Tenant-Leaning
- State Washington
- 28 Tenant-Leaning · D+8
- County
- — inherits STATE
- City
- — inherits STATE
ZIP-level market 98273
- Rents YoY
- 2.3%
- Active inventory
- 199
- Price-to-rent
- 2.1×
Monthly cashflow live
- Estimated rent
- $2,015 high interval (Pro) →
- Mortgage (P&I)
- −$262
- Tax from tax record
- −$14 /mo · $172/yr
- Insurance
- −$21
- Flood insurance flood zone
- −$122 /mo · $1,468/yr
- HOA
- −$0
- Vacancy / Maint / Mgmt
- −$423
- Net cashflow
- $1,172
Break-even live
UW: 25.0% down · 7.5% · 30yr · 1.5% tax · 5.0% vac · 8.0% maint · 8.0% mgmt
Financing live
Cash to close
- Down payment
- $12,500
- Closing costs
- $1,500
- Reserves months
- —
- Total cash needed
- —
Loan-product check · same deal, 3 products live
Conventional
25% down · 7.5% · 30yr
- Down + closing
- —
- Monthly P&I
- —
- Monthly cashflow
- —
- DSCR
- —
- Eligible?
- —
Personal DTI + credit; lowest rate.
DSCR
20% down · 8.5% · 30yr
- Down + closing
- —
- Monthly P&I
- —
- Monthly cashflow
- —
- DSCR
- —
- Eligible?
- —
No personal income docs; deal must DSCR.
Hard money
10% down · 12.0% · 12mo
- Down + closing
- —
- Monthly P&I
- —
- Monthly cashflow
- —
- DSCR
- —
- Eligible?
- —
Short-term bridge; refi at stabilization.
Rent comps 5 comps
| Address | Beds | Baths | Sqft | Rent | $/sqft | DOM | Units | Dist |
|---|---|---|---|---|---|---|---|---|
| 1221 S 12th St Mount Vernon, WA | 2.0 | 1.0 | 833 | $2,195 | $2.64 | 43d | 1 | 0.69mi |
| 1511 Shirley Pl Mount Vernon, WA | 2.0 | 1.0 | 936 | $2,250 | $2.40 | 43d | 1 | 0.81mi |
| 1002 S 12th St Mount Vernon, WA | 2.0 | 1.0 | 1052 | $2,575 | $2.45 | 21d | 1 | 0.85mi |
| 1011 E Division St Unit 103 Mount Vernon, WA | 1.0 | 1.0 | 800 | $1,250 | $1.56 | 43d | 1 | 1.22mi |
| 130 Stanford Dr Unit C Mount Vernon, WA | 2.0 | 1.0 | 800 | $1,595 | $1.99 | 43d | 1 | 1.45mi |
Listing history 7 events
-
2026-04-21price $50,000
-
2026-02-09$56,000 Active
-
2025-03-03soldstatus $40,000 Closed
-
2025-02-22status Pending
-
2025-01-30price $48,500
-
2025-01-13price $59,995
-
2024-11-01$67,000 Active
ⓘ Source: listings_history table (triggers on properties + properties_extension) + one-shot
backfill from property_details.listing_events for pre-trigger history.
Tax reassessment forecast WA · Resets to sale price
- Current annual tax
- $172 · $14/mo
- Projected year-2 tax
- $490 · $41/mo
- Expected delta
- +$318/yr (+$27/mo · 185.3%)
ⓘ Screening estimate from a state-policy table — verify with the county assessor before closing.
Climate risk First Street
- Flood 4/10 Moderate FEMA zone AO · 22% chance over 30 yrs
- Wildfire 3/10 Moderate
- Heat 2/10 Low 7 d/yr ≥81°F today · 18 d/yr by 30 yrs out
- Wind 1/10 Low
- Air quality 5/10 Major 7 unhealthy d/yr today · 7 by 30 yrs out
Nearby sold comps map
Loading sold comps map…
Walkable amenities ~0.75 mi
Loading nearby amenities…
Taxation est. · year 1
- Rental income
- $24,177
- − Mortgage interest
- −$2,801
- − Property taxes
- −$172
- − Insurance
- −$1,718
- − Repairs & maintenance
- −$1,934
- − Management
- −$1,934
- − Depreciation
- −$1,455
- Taxable income
- $14,164
- Est. tax owed @ 24.0%
- −$3,399
- After-tax cash flow
- $10,665/yr
For passive investors: Depreciation is non-cash, so a rental often shows a tax loss while cash-flowing — sheltering income. Rental losses are passive: they offset passive income freely, and up to $25,000/yr can offset ordinary (W-2) income if you actively participate and your MAGI is under $100k (phasing out to $0 by $150k); unused losses carry forward. On sale, claimed depreciation is recaptured at up to 25%, and gains may owe capital-gains tax (a 1031 exchange can defer both). Figures are a year-1 estimate at your 24.0% rate — not tax advice; consult a CPA.
Schools (NCES district)
- District
- Mount Vernon School District
- NCES district ID
- 5305400
- Math proficiency
- 41% ▼ -1.00%
- Reading proficiency
- 47% ▲ 1.00%
- Median HH income
- $50,829
- Composite
- 40.14/100
- National rank
- #7848
- State rank
- #189 of 291 in WA
Livability — Mount Vernon
- Score
- 79/100
- State rank
- #106
- US rank
- #2120
Category grades
Schools grade is shown separately in the Schools card above.
Census & demographics
- Census place
- Mount Vernon, WA
- County
- Skagit County · 118,108 people
- City population
- 48,861
- Metro
- Mount Vernon-Anacortes, WA
- Population (ZIP)
- 30,001
- Household income
- $76,717
- Rent vs Own
- Severe rent burden
- 1045.0
Population outlook (Skagit County) Hauer SSP2
- Today (2025)
- 131,498 people
- By 2030
- 135,556 · +3.1%
- By 2040
- 141,717 · +7.8%
- By 2050
- 145,714 · +10.8%
- By 2075
- 152,201 · +15.7%
- By 2100
- 147,980 · +12.5%
Race, ethnicity, and origin ACS 2023
- Neighborhood character
- Majority White (60%)
- Race & ethnicity
- White 60% Hispanic / Latino 32% Two or more races 9% Asian 2% Native American 1%
- Hispanic origin (detail)
- Mexican 30%
- Common ancestry
- Portuguese 6% Slovak 3% Italian 2%
- Foreign-born
- 14% · Canada
- Languages at home
- 71% English-only · Spanish 25% Russian/Polish/Slavic 1% Other Indo-European 1%
Political lean MEDSL · Skagit
- 2024 margin
- Lean D (+8.9) · D 52.9% · R 44.0% · Other 3.0%
- 2008→2024 swing
- -0.7pp no change · 2008: 9.6pp · 2024: 8.9pp
- All cycles
- 2024: D+8.9 2020: D+7.5 2016: D+3.2 2012: D+5.8 2008: D+9.6
Not yet ingested
- Civics
- —
Market trends
- HPI YoY
- ▼ -525.00%
- Current HPI
- 395.3742
- Rent YoY
- ▲ 2.33%
- Metro
- Mount Vernon-Anacortes, WA
- State GDP YoY
- ▲ 4.65%
- F500 in state
- 22
Industry mix (Fortune 500 HQ in WA)
| Industry | F500 HQs | Revenue |
|---|---|---|
| Retail | 2 | $269B |
|
||
| Technology / Retail | 1 | $638B |
|
||
| Technology | 1 | $245B |
|
||
| Telecommunications | 1 | $38B |
|
||
| Food / Beverage | 1 | $36B |
|
||
| Automotive / Trucks | 1 | $34B |
|
||
Price history
-25.4% since first listed7 events — show timeline
- 2026-04-21 Price Changed $50,000 NWMLS as Distributed by MLS Grid
- 2026-02-09 Listed $56,000 NWMLS as Distributed by MLS Grid
- 2025-03-03 Sold (MLS) $40,000 NWMLS as Distributed by MLS Grid
- 2025-02-22 Pending — NWMLS as Distributed by MLS Grid
- 2025-01-30 Price Changed $48,500 NWMLS as Distributed by MLS Grid
- 2025-01-13 Price Changed $59,995 NWMLS as Distributed by MLS Grid
- 2024-11-01 Listed $67,000 NWMLS as Distributed by MLS Grid
Property tax history
-1.4%/yrLatest (2026): $172 · +14.3% YoY. Source: county tax records.
Cash-flow waterfall
monthlySold comps — $/sqft
last 12 mo · ≤1 miLoading sold comps…