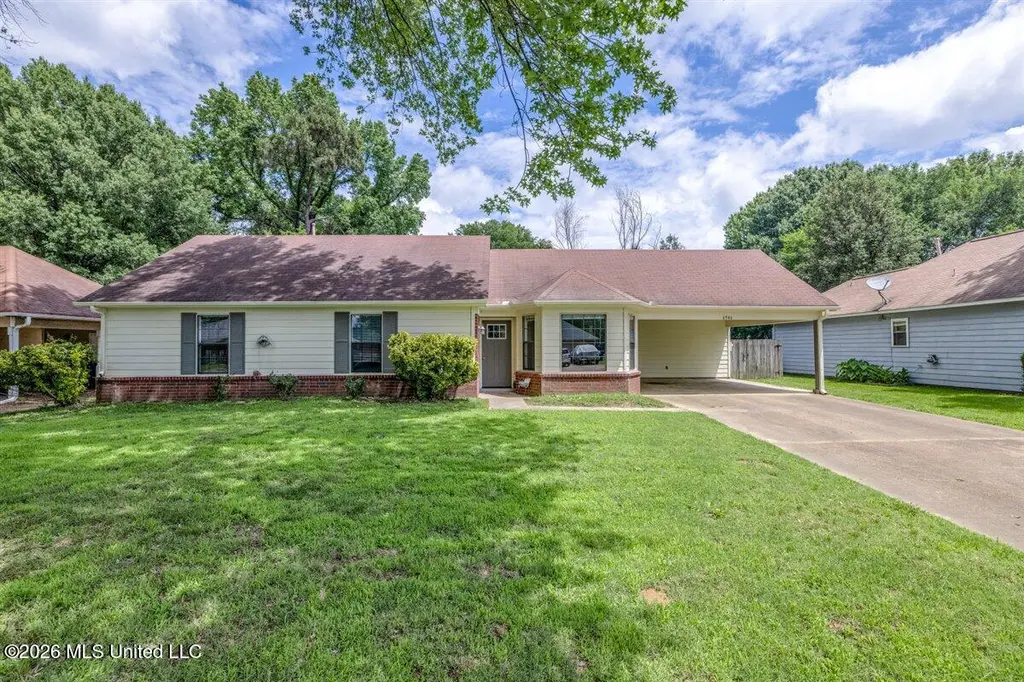
6946 River Birch Rd · Lynchburg, MS
Flood risk 1/10 · Minimal
- FEMA flood zone
- X (unshaded)
- Chance of flooding over 30 yrs
- 0.0%
- Est. flood insurance / yr
- $507 – $1,088
Fire risk 4/10 · Minor
- Est. fire insurance / yr
- $1,241 – $2,305
Heat risk 6/10 · Moderate
- Hot days now (above 109°F)
- 7 days/yr
- Hot days in 30 yrs
- 21 days/yr
Wind risk 4/10 · Minor
- Chance of severe wind over 30 yrs
- 19.0%
Air-quality risk 2/10 · Minimal
- Unhealthy air days now
- 2 days/yr
- Unhealthy air days in 30 yrs
- 2 days/yr
Risk factors via First Street. Map © Google.
Why this score? — see what drove the D+ grade
The composite is a weighted blend of 9 inputs, each scored 0–100. Each bar is that input's sub-score; the figure is the points it added to the 100-point composite (weight × sub-score).
- Cash flow +12.9/30.0
- Appreciation +10.0/10.0
- ARV discount +5.1/15.0
- Schools +4.0/10.0
- DSCR +3.8/10.0
- Livability +3.2/5.0
- Rent growth +2.5/5.0
- Condition / age +2.5/5.0
- 1% rule +2.4/10.0
$249,900
🖨 Deal sheet 📄 Offer letter ✓ Due diligence
Listing remarks MLS
Beautifully renovated home with all new vinyl wood flooring and granite countertops. Come check it out today!
Key facts
- Large dining space
- Updated counters
- Two pantries
Tags
Property features AI
Finance
- Other: Lot approximately 0.25 acre
- HOA & community: Has association
Exterior
- Parking: Carport (2 spaces); Total parking for 6 vehicles
- Utilities: Public water; Public sewer; Electricity connected
- Home design: Single family house; One story; Move-in ready; Living area measured by appraiser
- Construction: Vinyl exterior; Slab foundation; Built according to assessor records
- Exterior features: Private yard; Asphalt roof
Interior
- Kitchen: Dishwasher; Oven; Refrigerator; Garbage disposal
- Bedrooms: One-level home (bedroom levels not specified)
- Bathrooms: 2 full bathrooms
- Heating & cooling: Central heating; Central air conditioning
- Interior features: Built-in features; Ceiling fans; Pantry; Fireplace in den and other area
Neighborhood map
What this means for you Summary
Snapshot
- This is a 3-bed/2.0-bath single-family listed at $250k.
Deal economics
- At list price, monthly cash flow is $-20 ($-245/yr) — negative.
- To cash-flow at today's rent, offer at most $246k (1.4% below list).
- To meet the 1% rule (rent ≥ 1% of price), the offer needs to be $185k (25.9% below list).
- Recommended offer: $185k (25.9% below list) — sets the bar for 1% rule.
- Cap rate 6.2% vs local median 3.9% in Lynchburg — top-decile yield for the area; either an underpriced asset or a hidden risk that comps aren't pricing in. Stress-test before assuming the spread holds.
Location & tenants
- Location reads 63/100 on livability (#145 in MS) — a middle-class / working-renter tenant base. Strengths: crime A+, cost of living A+, housing A+; Watch: amenities F, commute F, health & safety F.
- Desoto County School District (suburban): math 48% / reading 42% proficiency, ranked #20 of 130 in MS (top 15%) — families likely to look elsewhere, expect single-tenant / working-renter base with shorter leases.
- Zoned schools: Walls Elementary School (math 24% / reading 26%, grade F, #217 of 375 statewide, top 58%, 718 students, 100% FRL); Lake Cormorant Middle (math 51% / reading 30%, grade F, #60 of 179 statewide, top 37%, 764 students, 100% FRL); Lake Cormorant High (math 29% / reading 42%, grade F, #66 of 197 statewide, top 34%, 969 students, 100% FRL) — zoned schools average 100% FRL vs 43% district-wide (56 pts higher); higher-poverty schools than district average — tighter screening recommended.
- Market conditions: 51 active listings in the ZIP; 11 comparable units currently listed for rent nearby; rentals at typical pace (median 20d on market — plan ~3-4 weeks tenant-placement turnaround); 1,155 units permitted in DeSoto County in 2024 (0 in 5+ unit buildings).
- This rent runs 37% of the median local income ($60k/yr) — at the standard rent-burdened threshold; future hikes will face affordability resistance.
Forward outlook
- In year one you build about $27k of equity ($2k loan paydown + $25k appreciation (10.0% local appreciation)).
- DeSoto County population projected at +33% by 2050 — long-run rental-demand tailwind backs the buy-and-hold thesis.
- At projected returns (10.0% appreciation + 3.0% rent growth), your $70k cash investment doubles in ~3 years — after that, you're playing with house money.
- By year 2, paydown + projected appreciation supports a ~$43k cash-out refi (75% LTV) — recoverable capital for the next deal without selling this one.
Negotiation context
- Only 10 days on market — expect competitive offers; lowballing is unlikely to land.
- 6 sale attempts since 21y ago with the ask held roughly flat each time — persistent listings suggest the price (not the market) is what's stuck; bring a comps-based counter.
Risks & watch-outs
- Climate carrying-cost: extreme-heat days projected 7→21/yr by 2055 (HVAC capex compounding) — expect insurance premiums to compound above CPI over the hold.
Questions for the listing agent
- What do current leases actually rent for vs. the listed asking? Can we see a recent rent roll and the last 12 months of T-12 income?
- Is there a deadline driving the sale (1031 exchange, divorce, estate, relocation)? That informs how much negotiation room exists.
- Schools are F-rated, which usually means shorter tenancies and higher turnover. Who's the typical renter profile here, and what's been the actual vacancy rate?
- The area grade is low — what's the realistic commute time and amenity access for the typical tenant pool here? Any planned neighborhood developments (good or bad) we should know about?
- What's the average days-on-market for RENTAL listings here right now (not sales)? A rising rental-DOM trend means longer vacancies and softer asking-rent achievability than the comps imply.
- What's the recent tenant-quality profile in this submarket — average credit score on applications, eviction rate, late-payment / NSF rate, and stable-employment percentage? A property-management company in the area should have these aggregated.
- How much new for-sale + rental construction is in the pipeline within 1–3 miles? Heavy new supply typically softens prices + rents 12–24 months out; constrained supply supports both.
Investment metrics
- 1% rule
- 0.74% ✗
- Cap rate
- 6.20%
- Cash-on-cash
- -0.35%
- DSCR
- 0.98
- GRM
- 11.2
CMA / ARV
- ARV (on-the-fly)
- $237,440
- Comps found
- 12
Show comp detail 12 sales within ~0.75 mi
| Address | Dist | Beds/Ba | Sqft | Sold | Price | $/sf | Match |
|---|---|---|---|---|---|---|---|
| 6915 Slash Pine Dr | 0.04mi | 3/2.0 | 1,509 (+2%) | 18mo | $259,000 | $172 | 80 |
| 7051 Thornwood Cv | 0.16mi | 3/2.0 | 1,506 (+2%) | 14mo | $259,000 | $172 | 78 |
| 6585 Green Gln | 0.28mi | 3/2.0 | 1,568 (+6%) | 1mo | $250,000 | $159 | 77 |
| 6671 River Birch Rd | 0.28mi | 3/2.0 | 1,530 (+3%) | 7mo | $219,900 | $144 | 76 |
| 6720 Black Thorn Dr | 0.21mi | 3/2.0 | 1,434 (-3%) | 15mo | $229,900 | $160 | 72 |
| 6830 Slash Pine Dr | 0.14mi | 4/2.0 (+1) | 1,634 (+10%) | 1mo | $215,000 | $132 | 71 |
| 6949 Black Oak Dr | 0.30mi | 3/2.5 | 1,422 (-4%) | 10mo | $235,000 | $165 | 69 |
| 6933 Fox Briar Cv | 0.17mi | 3/1.0 | 1,362 (-8%) | 11mo | $225,000 | $165 | 66 |
| 6522 Broken Hickory Cv | 0.44mi | 3/2.0 | 1,555 (+5%) | 14mo | $245,000 | $158 | 60 |
| 6937 Coleman Cv | 0.42mi | 3/2.0 | 1,664 (+12%) | 15mo | $254,900 | $153 | 47 |
| 6627 Lake Forest Dr W | 0.54mi | 3/2.0 | 1,658 (+12%) | 11mo | $284,999 | $172 | 46 |
| 7787 Bailee Ln | 0.65mi | 4/2.0 (+1) | 1,700 (+15%) | 8mo | $230,000 | $135 | 34 |
Match score weights: distance 35% · size 25% · config 20% · recency 20%. Top-matched comps best support the ARV.
Projected returns pro-forma
10.0% appreciation · 3.0% rent growth · sell at horizon
- IRR
- 24.0%
- Equity multiple
- 2.92×
- Total profit
- $134,682
- Equity at exit
- $225,130
- IRR
- 21.3%
- Equity multiple
- 6.68×
- Total profit
- $397,395
- Equity at exit
- $485,501
Cash invested: $69,972 (down + closing). Projections, not guarantees.
Landlord ↔ Tenant lean methodology
- Overall (STATE)
- 90 Strongly Landlord-Friendly
- State Mississippi
- 90 Strongly Landlord-Friendly · R+11
- County
- — inherits STATE
- City
- — inherits STATE
ZIP-level market 38680
- Home prices YoY
- 4.6%
- Active inventory
- 51
- Price-to-rent
- 11.2×
Monthly cashflow live
- Estimated rent
- $1,851 high interval (Pro) →
- Mortgage (P&I)
- −$1,311
- Tax from tax record
- −$68 /mo · $821/yr
- Insurance
- −$104
- HOA
- −$0
- Vacancy / Maint / Mgmt
- −$389
- Net cashflow
- $-20
Break-even live
UW: 25.0% down · 7.5% · 30yr · 1.5% tax · 5.0% vac · 8.0% maint · 8.0% mgmt
Financing live
Cash to close
- Down payment
- $62,475
- Closing costs
- $7,497
- Reserves months
- —
- Total cash needed
- —
Loan-product check · same deal, 3 products live
Conventional
25% down · 7.5% · 30yr
- Down + closing
- —
- Monthly P&I
- —
- Monthly cashflow
- —
- DSCR
- —
- Eligible?
- —
Personal DTI + credit; lowest rate.
DSCR
20% down · 8.5% · 30yr
- Down + closing
- —
- Monthly P&I
- —
- Monthly cashflow
- —
- DSCR
- —
- Eligible?
- —
No personal income docs; deal must DSCR.
Hard money
10% down · 12.0% · 12mo
- Down + closing
- —
- Monthly P&I
- —
- Monthly cashflow
- —
- DSCR
- —
- Eligible?
- —
Short-term bridge; refi at stabilization.
Rent comps 11 comps
| Address | Beds | Baths | Sqft | Rent | $/sqft | DOM | Units | Dist |
|---|---|---|---|---|---|---|---|---|
| 6915 Black Thorn Dr Walls, MS | 4.0 | 2.0 | 1382 | $1,655 | $1.20 | 4d | 1 | 0.08mi |
| 6916 Fox Briar Cv Walls, MS | 3.0 | 2.0 | 1350 | $1,600 | $1.19 | 4d | 1 | 0.17mi |
| 6757 River Birch Rd Walls, MS | 3.0 | 2.0 | 1331 | $1,720 | $1.29 | 11d | 1 | 0.20mi |
| 7051 Lake Forest Dr N Walls, MS | 3.0 | 2.0 | 1551 | $1,595 | $1.03 | 43d | 1 | 0.24mi |
| 7787 Bailee Ln Walls, MS | 4.0 | 2.0 | 1700 | $2,000 | $1.18 | 43d | 1 | 0.62mi |
| 6670 Tangleberry Cv Walls, MS | 3.0 | 2.0 | 1600 | $1,770 | $1.11 | 20d | 1 | 0.72mi |
| 6205 Liberty Estates Dr Walls, MS | 3.0 | 2.0 | 1357 | $1,555 | $1.15 | 4d | 1 | 0.92mi |
| 5968 Shannon Dr Horn Lake, MS | 3.0 | 2.0 | 1374 | $1,650 | $1.20 | 20d | 1 | 0.99mi |
| 5859 Shannon Dr Horn Lake, MS | 3.0 | 2.0 | 1139 | $1,523 | $1.34 | 43d | 1 | 1.09mi |
| 7782 Emeline Dr Horn Lake, MS | 4.0 | 2.5 | 1808 | $2,265 | $1.25 | 43d | 1 | 1.32mi |
| 5565 Chapel Hill Dr Horn Lake, MS | 3.0 | 2.0 | 1114 | $1,543 | $1.39 | 1d | 1 | 1.39mi |
Listing history 7 events
-
2026-06-13statusdays on market $249,900 Pending 10 DOM
-
2026-06-10days on market $249,900 Active 8 DOM
-
2026-06-09days on market $249,900 Active 7 DOM
-
2026-06-08days on market $249,900 Active 6 DOM
-
2026-06-07days on market $249,900 Active 5 DOM
-
2026-06-02remarks 366-char remark
-
2026-06-02$249,900 Active 1 DOM
ⓘ Source: listings_history table (triggers on properties + properties_extension) + one-shot
backfill from property_details.listing_events for pre-trigger history.
Tax reassessment forecast MS · Resets to sale price
- Current annual tax
- $821 · $68/mo
- Projected year-2 tax
- $1,974 · $165/mo
- Expected delta
- +$1,154/yr (+$96/mo · 140.6%)
ⓘ Screening estimate from a state-policy table — verify with the county assessor before closing.
Climate risk First Street
- Flood 1/10 Low FEMA zone X (unshaded) · 0% chance over 30 yrs
- Wildfire 4/10 Moderate
- Heat 6/10 Major 7 d/yr ≥109°F today · 21 d/yr by 30 yrs out
- Wind 4/10 Moderate 19% chance of damaging wind over 30 yrs
- Air quality 2/10 Low 2 unhealthy d/yr today · 2 by 30 yrs out
Nearby sold comps map
Loading sold comps map…
Walkable amenities ~0.75 mi
Loading nearby amenities…
Taxation est. · year 1
- Rental income
- $22,217
- − Mortgage interest
- −$13,998
- − Property taxes
- −$821
- − Insurance
- −$1,250
- − Repairs & maintenance
- −$1,777
- − Management
- −$1,777
- − Depreciation
- −$7,270
- Taxable loss
- −$4,676
- Est. tax savings @ 24.0%
- +$1,122
- After-tax cash flow
- $878/yr
For passive investors: Depreciation is non-cash, so a rental often shows a tax loss while cash-flowing — sheltering income. Rental losses are passive: they offset passive income freely, and up to $25,000/yr can offset ordinary (W-2) income if you actively participate and your MAGI is under $100k (phasing out to $0 by $150k); unused losses carry forward. On sale, claimed depreciation is recaptured at up to 25%, and gains may owe capital-gains tax (a 1031 exchange can defer both). Figures are a year-1 estimate at your 24.0% rate — not tax advice; consult a CPA.
Schools (NCES district)
- District
- Desoto County School District
- NCES district ID
- 2801320
- Math proficiency
- 48% ▼ -13.00%
- Reading proficiency
- 42% ▼ -6.00%
- Median HH income
- $59,272
- Composite
- 39.56/100
- National rank
- #3933
- State rank
- #20 of 130 in MS
Livability — Lynchburg
- Score
- 63/100
- State rank
- #145
- US rank
- #14967
Category grades
Schools grade is shown separately in the Schools card above.
Census & demographics
- Census place
- Lynchburg, MS
- County
- DeSoto County · 176,513 people
- Metro
- Memphis, TN-MS-AR
- Population (ZIP)
- 6,839
- Household income
- $59,503
- Rent vs Own
- Severe rent burden
- 229.0
Population outlook (DeSoto County) Hauer SSP2
- Today (2025)
- 203,338 people
- By 2030
- 217,692 · +7.1%
- By 2040
- 245,320 · +20.6%
- By 2050
- 270,133 · +32.8%
- By 2075
- 323,341 · +59.0%
- By 2100
- 348,742 · +71.5%
Race, ethnicity, and origin ACS 2023
- Neighborhood character
- Diverse neighborhood (Simpson 0.60)
- Race & ethnicity
- Black 46% White 42% Hispanic / Latino 8% Two or more races 3% Native American 1% Asian 1%
- Hispanic origin (detail)
- Mexican 6%
- Common ancestry
- Romanian 1% Serbian 1% British 1%
- Foreign-born
- 4% · Canada
- Languages at home
- 93% English-only · Spanish 6%
Political lean MEDSL · DeSoto
- 2024 margin
- Strong R (+24.1) · D 36.7% · R 60.8% · Other 2.5%
- 2008→2024 swing
- +14.2pp toward D · 2008: -38.2pp · 2024: -24.1pp
- All cycles
- 2024: R+24.1 2020: R+23.9 2016: R+34.8 2012: R+33.5 2008: R+38.2
Not yet ingested
- Civics
- —
Market trends
- HPI YoY
- ▲ 10.29%
- Current HPI
- 232.28
- Rent YoY
- —
- Metro
- Memphis, TN-MS-AR
- State GDP YoY
- —
- F500 in state
- 0
Price history
+93.0% since first listed16 events — show timeline
- 2026-06-02 Listed $249,900 MLSU
- 2022-09-10 Listing Removed — MLSU
- 2022-09-08 Price Changed $229,900 MLSU
- 2022-08-30 Price Changed $239,900 MLSU
- 2022-08-25 Listed $250,000 MLSU
- 2020-04-09 Sold (Public Records) — Public Records
- 2020-04-09 Sold (MLS) — MLSU
- 2020-03-06 Listed $149,900 MLSU
- 2019-10-30 Listing Removed — MLSU
- 2019-10-07 Listed $154,900 MLSU
- 2019-09-30 Listing Removed — MLSU
- 2019-09-25 Listed $154,900 MLSU
- 2005-09-06 Sold (Public Records) — Public Records
- 2005-09-02 Sold (MLS) — MLSU
- 2005-03-14 Listed $129,500 MLSU
- 1991-10-30 Sold (Public Records) — Public Records
Property tax history
+14.9%/yrLatest (2025): $821 · +17.2% YoY. Source: county tax records.
Cash-flow waterfall
monthlySold comps — $/sqft
last 12 mo · ≤1 miLoading sold comps…