13341 Olde Western Ave · Blue Island, IL
Flood risk 3/10 · Minor
- FEMA flood zone
- X (unshaded)
- Chance of flooding over 30 yrs
- 0.13%
- Est. flood insurance / yr
- $473 – $860
Fire risk 1/10 · Minimal
- Est. fire insurance / yr
- $804 – $1,492
Heat risk 3/10 · Minor
- Hot days now (above 101°F)
- 7 days/yr
- Hot days in 30 yrs
- 15 days/yr
Wind risk 2/10 · Minimal
- Chance of severe wind over 30 yrs
- —
Air-quality risk 4/10 · Minor
- Unhealthy air days now
- 4 days/yr
- Unhealthy air days in 30 yrs
- 6 days/yr
Risk factors via First Street. Map © Google.
Why this score? — see what drove the F grade
The composite is a weighted blend of 9 inputs, each scored 0–100. Each bar is that input's sub-score; the figure is the points it added to the 100-point composite (weight × sub-score).
- ARV discount +7.5/15.0
- Livability +3.9/5.0
- Cash flow +2.6/30.0
- Rent growth +2.5/5.0
- Condition / age +2.5/5.0
- Schools +1.6/10.0
- 1% rule +0.0/10.0
- DSCR +0.0/10.0
- Appreciation +0.0/10.0
$375,000
🖨 Deal sheet 📄 Offer letter ✓ Due diligence
Listing remarks MLS
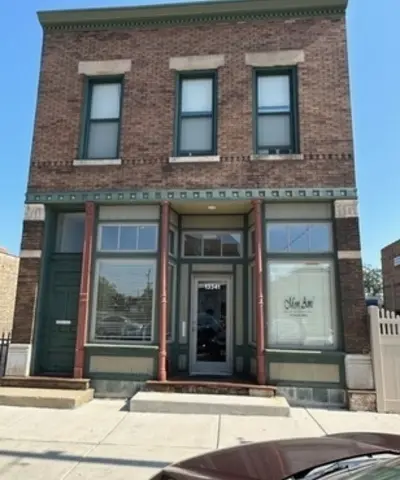
Great Opportunity!!!! EITHER OPEN YOUR OWN BUSINESS HERE OR PURCHASE AS AN INVESTMENT WITH GREAT INCOME!!!! HISTORIC BLUE ISLAND WITH 2 STORY BUILDING! AND EXTRA ADJACENT LOT! 1ST FLOOR CURRENTLY LEASED WITH A HAIR SALON AND SPA. 2ND FLOOR UPDATED 2 BEDROOM APARTMENT W/ PRIVATE DECK, CURRENTLY RENTED. FULL BASEMENT AND 2 CAR GARAGE WITH REAR ENTRY. FULLY FENCED YARD. GREAT LOCATION AND GREAT OPPORTUNITY! CALL TODAY !!!
Key facts
- Private deck
- Full basement
- 2 story building
Tags
Neighborhood map
What this means for you Summary
Snapshot
- This is a 6-bed/2.0-bath condo listed at $375k.
Deal economics
- At list price, monthly cash flow is $-1k ($-15k/yr) — negative.
- To cash-flow at today's rent, offer at most $156k (58.5% below list).
- To meet the 1% rule (rent ≥ 1% of price), the offer needs to be $188k (49.9% below list).
- Recommended offer: $156k (58.5% below list) — sets the bar for cash-flow.
- Cap rate 2.2% vs local median 6.5% in Blue Island — below-typical yield; the buyer is paying a premium for something (appreciation thesis, condition, location) that the cap rate doesn't capture.
Location & tenants
- Location reads 77/100 on livability (#159 in IL, #2,964 nationally) — a middle-class / working-renter tenant base. Strengths: commute A+, cost of living A+, housing A+; Watch: employment C-, schools F, crime F.
- Chsd 218 (suburban): math 14% / reading 20% proficiency, ranked #454 of 620 in IL (top 73%) — low school quality limits family demand, transient renter base, plan for 1-2y turnover.
- Market conditions: 43 active listings in the ZIP; 6,272 units permitted in Cook County in 2024 (4,658 in 5+ unit buildings).
Forward outlook
- Local home prices are declining (-3.0%/yr); year-one equity from $3k of loan paydown is wiped out by about $11k of value loss. Plan a longer hold.
Negotiation context
- It's been on market 254 days — a 12% lower offer ($330k) is reasonable based on typical stale-listing flexibility.
- Current owner paid $130k; list at $375k implies a 188% gain — meaningful room to come down on a strong offer.
Risks & watch-outs
- Watch-outs: built in 1898 — expect roof / HVAC / electrical / plumbing capex.
Questions for the listing agent
- What do current leases actually rent for vs. the listed asking? Can we see a recent rent roll and the last 12 months of T-12 income?
- It's been on market 254 days. Have you received any prior offers? Is the seller open to a 58% concession, seller financing, or rate buy-down credit?
- Built in 1898 — when were the roof, HVAC, electrical panel, plumbing, and water heater last replaced?
- Any open or pending special assessments — roof, HVAC, plumbing, elevator, façade? What's the per-unit balance and payoff schedule, and is the seller paying it off at close or rolling it to the buyer?
- Why hasn't it sold? Are there any deal-killer items the seller is aware of (foundation, flood, title, zoning, code violations)?
- Is there a deadline driving the sale (1031 exchange, divorce, estate, relocation)? That informs how much negotiation room exists.
- Schools are F-rated, which usually means shorter tenancies and higher turnover. Who's the typical renter profile here, and what's been the actual vacancy rate?
- Crime grade is F in this area — have there been break-ins, vandalism, or insurance claims at this property in the last 3 years? What carrier currently insures it and at what premium?
- The area grade is low — what's the realistic commute time and amenity access for the typical tenant pool here? Any planned neighborhood developments (good or bad) we should know about?
- What's the average days-on-market for RENTAL listings here right now (not sales)? A rising rental-DOM trend means longer vacancies and softer asking-rent achievability than the comps imply.
- What's the recent tenant-quality profile in this submarket — average credit score on applications, eviction rate, late-payment / NSF rate, and stable-employment percentage? A property-management company in the area should have these aggregated.
- How much new apartment / multifamily construction is in the pipeline within 1–3 miles? Heavy new supply (>2% of stock underway) typically softens rents 12–24 months out; light construction supports rent growth.
Investment metrics
- 1% rule
- 0.50% ✗
- Cap rate
- 2.17%
- Cash-on-cash
- -14.73%
- DSCR
- 0.34
- GRM
- 16.6
CMA / ARV
- ARV (median comp)
- $197,719
- List price
- $375,000
- Delta
- 89.66%
- Verdict
- OVERPRICED
- Comps
- 1 within 2.0 mi
Projected returns pro-forma
-3.0% appreciation · 3.0% rent growth · sell at horizon
- IRR
- -44.4%
- Equity multiple
- -0.36×
- Total profit
- $-142,708
- Equity at exit
- $55,914
- IRR
- -79.2%
- Equity multiple
- -1.18×
- Total profit
- $-229,394
- Equity at exit
- $32,423
Cash invested: $105,000 (down + closing). Projections, not guarantees.
Landlord ↔ Tenant lean methodology
- Overall (STATE)
- 43 Moderately Tenant-Leaning
- State Illinois
- 43 Moderately Tenant-Leaning · D+7
- County
- — inherits STATE
- City
- — inherits STATE
ZIP-level market 60406
- Home prices YoY
- -26.8%
- Active inventory
- 43
- Price-to-rent
- 16.6×
Monthly cashflow live
- Estimated rent
- $1,877 medium interval (Pro) →
- Mortgage (P&I)
- −$1,967
- Tax from tax record
- −$649 /mo · $7,786/yr
- Insurance
- −$156
- HOA
- −$0
- Vacancy / Maint / Mgmt
- −$394
- Net cashflow
- $-1,289
Break-even live
UW: 25.0% down · 7.5% · 30yr · 1.5% tax · 5.0% vac · 8.0% maint · 8.0% mgmt
Financing live
Cash to close
- Down payment
- $93,750
- Closing costs
- $11,250
- Reserves months
- —
- Total cash needed
- —
Loan-product check · same deal, 3 products live
Conventional
25% down · 7.5% · 30yr
- Down + closing
- —
- Monthly P&I
- —
- Monthly cashflow
- —
- DSCR
- —
- Eligible?
- —
Personal DTI + credit; lowest rate.
DSCR
20% down · 8.5% · 30yr
- Down + closing
- —
- Monthly P&I
- —
- Monthly cashflow
- —
- DSCR
- —
- Eligible?
- —
No personal income docs; deal must DSCR.
Hard money
10% down · 12.0% · 12mo
- Down + closing
- —
- Monthly P&I
- —
- Monthly cashflow
- —
- DSCR
- —
- Eligible?
- —
Short-term bridge; refi at stabilization.
HOA detail condo
- Monthly dues
- $0 · $0/yr
- Assessments
- None detected in remarks — confirm with the listing agent.
Listing history 16 events
-
2026-06-18days on market $375,000 Active 254 DOM
-
2026-06-17days on market $375,000 Active 253 DOM
-
2026-06-16days on market $375,000 Active 252 DOM
-
2026-06-15days on market $375,000 Active 251 DOM
-
2026-06-13days on market $375,000 Active 249 DOM
-
2026-06-09days on market $375,000 Active 245 DOM
-
2026-06-08days on market $375,000 Active 244 DOM
-
2026-06-07days on market $375,000 Active 243 DOM
-
2026-06-04days on market $375,000 Active 240 DOM
-
2026-06-03days on market $375,000 Active 239 DOM
-
2026-06-02days on market $375,000 Active 238 DOM
-
2026-06-01days on market $375,000 Active 237 DOM
-
2026-05-31days on market $375,000 Active 236 DOM
-
2025-10-06$375,000 Active 423-char remark
Show marketing remark (423 chars)
Great Opportunity!!!! EITHER OPEN YOUR OWN BUSINESS HERE OR PURCHASE AS AN INVESTMENT WITH GREAT INCOME!!!! HISTORIC BLUE ISLAND WITH 2 STORY BUILDING! AND EXTRA ADJACENT LOT! 1ST FLOOR CURRENTLY LEASED WITH A HAIR SALON AND SPA. 2ND FLOOR UPDATED 2 BEDROOM APARTMENT W/ PRIVATE DECK, CURRENTLY RENTED. FULL BASEMENT AND 2 CAR GARAGE WITH REAR ENTRY. FULLY FENCED YARD. GREAT LOCATION AND GREAT OPPORTUNITY! CALL TODAY !!!
-
2014-06-12soldstatus $130,000
-
2000-05-17soldstatus $85,000
ⓘ Source: listings_history table (triggers on properties + properties_extension) + one-shot
backfill from property_details.listing_events for pre-trigger history.
Tax reassessment forecast IL · Partial reset (capped growth)
- Current annual tax
- $7,786 · $649/mo
- Projected year-2 tax
- $8,149 · $679/mo
- Expected delta
- +$363/yr (+$30/mo · 4.7%)
ⓘ Screening estimate from a state-policy table — verify with the county assessor before closing.
Climate risk First Street
- Flood 3/10 Moderate FEMA zone X (unshaded) · 13% chance over 30 yrs
- Wildfire 1/10 Low
- Heat 3/10 Moderate 7 d/yr ≥101°F today · 15 d/yr by 30 yrs out
- Wind 2/10 Low
- Air quality 4/10 Moderate 4 unhealthy d/yr today · 6 by 30 yrs out
Nearby sold comps map
Loading sold comps map…
Walkable amenities ~0.75 mi
Loading nearby amenities…
Taxation est. · year 1
- Rental income
- $22,525
- − Mortgage interest
- −$21,006
- − Property taxes
- −$7,786
- − Insurance
- −$1,875
- − Repairs & maintenance
- −$1,802
- − Management
- −$1,802
- − Depreciation
- −$10,909
- Taxable loss
- −$22,655
- Est. tax savings @ 24.0%
- +$5,437
- After-tax cash flow
- $-10,028/yr
For passive investors: Depreciation is non-cash, so a rental often shows a tax loss while cash-flowing — sheltering income. Rental losses are passive: they offset passive income freely, and up to $25,000/yr can offset ordinary (W-2) income if you actively participate and your MAGI is under $100k (phasing out to $0 by $150k); unused losses carry forward. On sale, claimed depreciation is recaptured at up to 25%, and gains may owe capital-gains tax (a 1031 exchange can defer both). Figures are a year-1 estimate at your 24.0% rate — not tax advice; consult a CPA.
Schools (NCES district)
- District
- Chsd 218
- NCES district ID
- 1706540
- Math proficiency
- 14% ▼ -4.00%
- Reading proficiency
- 20% ▼ -1.00%
- Median HH income
- $57,166
- Composite
- 16.09/100
- National rank
- #9235
- State rank
- #454 of 620 in IL
Livability — Blue Island
- Score
- 77/100
- State rank
- #159
- US rank
- #2964
Category grades
Schools grade is shown separately in the Schools card above.
Census & demographics
- Census place
- Blue Island, IL
- City population
- 24,887
- Population (ZIP)
- 24,887
Population outlook (Cook County) Hauer SSP2
- Today (2025)
- 5,347,519 people
- By 2030
- 5,357,703 · +0.2%
- By 2040
- 5,324,924 · -0.4%
- By 2050
- 5,230,762 · -2.2%
- By 2075
- 4,785,735 · -10.5%
- By 2100
- 4,188,836 · -21.7%
Race, ethnicity, and origin ACS 2023
- Neighborhood character
- Diverse neighborhood (Simpson 0.65)
- Race & ethnicity
- Hispanic / Latino 44% Black 34% White 19% Two or more races 8%
- Hispanic origin (detail)
- Mexican 39%
- Common ancestry
- Romanian 2% English 1% Iranian 1%
- Foreign-born
- 19% · Canada
- Languages at home
- 65% English-only · Spanish 33% Other Indo-European 1%
Political lean MEDSL · Cook
- 2024 margin
- Solid D (+42.0) · D 70.4% · R 28.4% · Other 1.2%
- 2008→2024 swing
- -11.4pp toward R · 2008: 53.4pp · 2024: 42.0pp
- All cycles
- 2024: D+42.0 2020: D+50.3 2016: D+53.0 2012: D+49.4 2008: D+53.4
Not yet ingested
- Civics
- —
Market trends
- HPI YoY
- ▼ -94.77%
- Current HPI
- 259.492
- Rent YoY
- —
- Metro
- —
- State GDP YoY
- ▲ 1.59%
- F500 in state
- 60
Industry mix (Fortune 500 HQ in IL)
| Industry | F500 HQs | Revenue |
|---|---|---|
| Insurance | 4 | $201B |
|
||
| Consumer Goods | 4 | $87B |
|
||
| Industrial Machinery | 3 | $64B |
|
||
| Healthcare | 2 | $55B |
|
||
| Retail / Pharmacy | 1 | $148B |
|
||
| Agriculture / Food | 1 | $86B |
|
||
Price history
+341.2% since first listed3 events — show timeline
- 2025-10-06 Listed $375,000 MRED as Distributed by MLS Grid
- 2014-06-12 Sold (Public Records) $130,000 Public Records
- 2000-05-17 Sold (Public Records) $85,000 Public Records
Property tax history
+2.1%/yrLatest (2023): $7,786 · -14.7% YoY. Source: county tax records.
Cash-flow waterfall
monthlySold comps — $/sqft
last 12 mo · ≤1 miLoading sold comps…