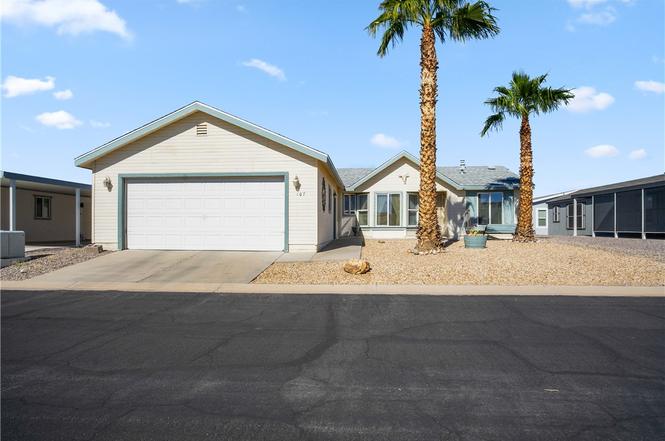
1545 E El Rodeo Rd #107 · Fort Mohave, AZ
Flood risk 1/10 · Minimal
- FEMA flood zone
- X (unshaded)
- Chance of flooding over 30 yrs
- 0.0%
- Est. flood insurance / yr
- $507 – $1,088
Fire risk 4/10 · Minor
- Est. fire insurance / yr
- $610 – $1,132
Heat risk 9/10 · Severe
- Hot days now (above 116°F)
- 7 days/yr
- Hot days in 30 yrs
- 16 days/yr
Wind risk 1/10 · Minimal
- Chance of severe wind over 30 yrs
- —
Air-quality risk 1/10 · Minimal
- Unhealthy air days now
- 0 days/yr
- Unhealthy air days in 30 yrs
- 0 days/yr
Risk factors via First Street. Map © Google.
Why this score? — see what drove the B- grade
The composite is a weighted blend of 9 inputs, each scored 0–100. Each bar is that input's sub-score; the figure is the points it added to the 100-point composite (weight × sub-score).
- Cash flow +27.9/30.0
- ARV discount +11.5/15.0
- DSCR +9.8/10.0
- 1% rule +7.6/10.0
- Livability +3.2/5.0
- Rent growth +2.5/5.0
- Condition / age +2.5/5.0
- Schools +1.3/10.0
- Appreciation +0.0/10.0
$139,000
🖨 Deal sheet 📄 Offer letter ✓ Due diligence
Listing remarks
Charming Home in Arrowhead Ranch Park 55+ Community. .. .Discover comfort and community in this beautifully maintained 3-bedroom, 2-bath home with a 2-car garage, located in the highly desirable Arrowhead Ranch Park 55+ neighborhood, space rent is $575. Thoughtful updates include a newer air conditioner and heating system (2 years old), hot water heater (2 years old), leased water softener, reverse osmosis system under the kitchen sink, and a freshly redone roof in 2025 offering peace of mind and move-in confidence. The spacious main bedroom features a walk-in shower, double sinks, and a walk-in closet, creating a comfortable retreat. Enjoy the inviting Arizona room perfect for morning coff
Key facts
- Freshly redone roof
- Hot water heater
- Heating system
Tags
Property features AI
Finance
- Financial info: Land is leased
- HOA & community: Community clubhouse; Community pool
Exterior
- Parking: Attached 2-car garage
- Utilities: Public water; Public sewer; 220 volt electric service; Natural gas available
- Home design: Manufactured home (double wide); Residential property; Located in a senior community; Zoned RMH (Residential Mobile Homes)
- Construction: Shingle roof
- Exterior features: Covered, enclosed patio; Patio; Community pool; Community spa; Paved road access; Pets allowed
Interior
- Kitchen: Dishwasher; Gas oven; Gas range; Microwave; Laminate counters; Breakfast bar
- Flooring: Carpet; Tile
- Bathrooms: 2 full bathrooms
- Heating & cooling: Central heating (natural gas); Central air; Ceiling fans; Electric cooling
- Interior features: Breakfast bar; Ceiling fans; Laminate counters; Vaulted ceilings; Walk-in closets; Accessible full bathroom
- Laundry & utility: Inside laundry; Water softener; Water heater
Neighborhood map
What this means for you Summary
Snapshot
- This is a 3-bed/2.0-bath manufactured listed at $139k.
Deal economics
- At list price, monthly cash flow is $426 ($5k/yr) — positive.
- The deal already cash-flows at list — no discount required.
- Meets the 1% rule at list price ($2k rent vs $139k).
- Recommended offer: $122k (12.0% below list) — sets the bar for market timing.
- Cap rate 10.0% vs local median 4.2% in Fort Mohave — top-decile yield for the area; either an underpriced asset or a hidden risk that comps aren't pricing in. Stress-test before assuming the spread holds.
Location & tenants
- Location reads 65/100 on livability (#88 in AZ) — a middle-class / working-renter tenant base. Strengths: cost of living A+, housing A+; Watch: employment C-, health & safety C-, crime D+.
- Colorado River Union High School District (4381) (town): math 13% / reading 17% proficiency, ranked #213 of 249 in AZ (top 86%) — low school quality limits family demand, transient renter base, plan for 1-2y turnover.
- Market conditions: 376 active listings in the ZIP; 9 comparable units currently listed for rent nearby; rentals leasing fast (median 14d on market — plan ~1-2 weeks tenant-placement turnaround); 2,543 units permitted in Mohave County in 2024 (33 in 5+ unit buildings).
- This rent runs 33% of the median local income ($65k/yr) — at the standard rent-burdened threshold; future hikes will face affordability resistance.
Forward outlook
- Local home prices are declining (-3.0%/yr); year-one equity from $961 of loan paydown is wiped out by about $4k of value loss. Plan a longer hold.
- Mohave County population projected to shrink 6% by 2050 — rents likely to lag national; underwrite the cash flow, not the appreciation.
- At projected returns (-3.0% appreciation + 3.0% rent growth), your $39k cash investment doubles in ~9 years — after that, you're playing with house money.
Negotiation context
- It's been on market 225 days — a 12% lower offer ($122k) is reasonable based on typical stale-listing flexibility.
Risks & watch-outs
- Climate carrying-cost: extreme-heat days projected 7→16/yr by 2055 (HVAC capex compounding) — expect insurance premiums to compound above CPI over the hold.
Questions for the listing agent
- It's been on market 225 days. Have you received any prior offers? Is the seller open to a 12% concession, seller financing, or rate buy-down credit?
- Why hasn't it sold? Are there any deal-killer items the seller is aware of (foundation, flood, title, zoning, code violations)?
- Is there a deadline driving the sale (1031 exchange, divorce, estate, relocation)? That informs how much negotiation room exists.
- Schools are F-rated, which usually means shorter tenancies and higher turnover. Who's the typical renter profile here, and what's been the actual vacancy rate?
- Crime grade is D in this area — have there been break-ins, vandalism, or insurance claims at this property in the last 3 years? What carrier currently insures it and at what premium?
- What's the average days-on-market for RENTAL listings here right now (not sales)? A rising rental-DOM trend means longer vacancies and softer asking-rent achievability than the comps imply.
- What's the recent tenant-quality profile in this submarket — average credit score on applications, eviction rate, late-payment / NSF rate, and stable-employment percentage? A property-management company in the area should have these aggregated.
- How much new for-sale + rental construction is in the pipeline within 1–3 miles? Heavy new supply typically softens prices + rents 12–24 months out; constrained supply supports both.
Investment metrics
- 1% rule
- 1.26% ✓
- Cap rate
- 9.97%
- Cash-on-cash
- 13.14%
- DSCR
- 1.58
- GRM
- 6.6
CMA / ARV
- ARV (on-the-fly)
- $152,550
- Comps found
- 12
Show comp detail 12 sales within ~0.75 mi
| Address | Dist | Beds/Ba | Sqft | Sold | Price | $/sf | Match |
|---|---|---|---|---|---|---|---|
| 1545 E El Rodeo Rd #106 | 0.05mi | 3/2.0 | 1,344 (-0%) | 12mo | $185,000 | $138 | 87 |
| 1545 E El Rodeo Rd #112 | 0.14mi | 2/2.0 (-1) | 1,352 (+0%) | 5mo | $135,000 | $100 | 84 |
| 1545 E El Rodeo Rd #48 | 0.14mi | 2/2.0 (-1) | 1,326 (-2%) | 4mo | $137,900 | $104 | 82 |
| 1545 E El Rodeo Rd #72 | 0.00mi | 2/2.0 (-1) | 1,248 (-8%) | 5mo | $100,000 | $80 | 78 |
| 1545 El Rodeo Rd #167 | 0.14mi | 3/2.0 | 1,300 (-4%) | 11mo | $129,900 | $100 | 78 |
| 4884 S Baronsgate Way | 0.25mi | 3/2.0 | 1,238 (-8%) | 4mo | $249,900 | $202 | 72 |
| 1545 E El Rodeo Rd #11 | 0.05mi | 3/2.0 | 1,493 (+11%) | 12mo | $168,000 | $113 | 70 |
| 1545 E El Rodeo Rd #23 | 0.05mi | 2/2.0 (-1) | 1,200 (-11%) | 14mo | $84,000 | $70 | 62 |
| 1545 E El Rodeo Rd #113 | 0.05mi | 2/2.0 (-1) | 1,508 (+12%) | 14mo | $130,000 | $86 | 62 |
| 1545 E El Rodeo Rd #60 | 0.14mi | 2/2.0 (-1) | 1,546 (+14%) | 3mo | $175,900 | $114 | 61 |
| 1545 E El Rodeo Rd Lot 18 | 0.14mi | 2/2.0 (-1) | 1,188 (-12%) | 10mo | $156,750 | $132 | 60 |
| 5150 S El Ganadero Dr | 0.73mi | 3/2.0 | 1,224 (-9%) | 13mo | $242,500 | $198 | 39 |
Match score weights: distance 35% · size 25% · config 20% · recency 20%. Top-matched comps best support the ARV.
Projected returns pro-forma
-3.0% appreciation · 3.0% rent growth · sell at horizon
- IRR
- 3.1%
- Equity multiple
- 1.12×
- Total profit
- $4,639
- Equity at exit
- $20,725
- IRR
- 12.7%
- Equity multiple
- 2.00×
- Total profit
- $39,089
- Equity at exit
- $12,018
Cash invested: $38,920 (down + closing). Projections, not guarantees.
Landlord ↔ Tenant lean methodology
- Overall (STATE)
- 87 Strongly Landlord-Friendly
- State Arizona
- 87 Strongly Landlord-Friendly · R+3
- County
- — inherits STATE
- City
- — inherits STATE
ZIP-level market 86426
- Home prices YoY
- -5.2%
- Active inventory
- 376
- Price-to-rent
- 6.6×
Monthly cashflow live
- Estimated rent
- $1,755 high interval (Pro) →
- Mortgage (P&I)
- −$729
- Tax est. 1.5%
- −$174 /mo · $2,085/yr
- Insurance
- −$58
- HOA
- −$0
- Vacancy / Maint / Mgmt
- −$369
- Net cashflow
- $426
Break-even live
Sensitivity live
| Price | -10% $522 | -5% $474 | +0% $426 | +5% $378 | +10% $330 |
|---|---|---|---|---|---|
| Rent | -10% $287 | -5% $357 | +0% $426 | +5% $495 | +10% $565 |
| Rate | -1.0pp $496 | -0.5pp $461 | base $426 | +0.5pp $390 | +1.0pp $353 |
UW: 25.0% down · 7.5% · 30yr · 1.5% tax · 5.0% vac · 8.0% maint · 8.0% mgmt
Financing live
Cash to close
- Down payment
- $34,750
- Closing costs
- $4,170
- Reserves months
- —
- Total cash needed
- —
Loan-product check · same deal, 3 products live
Conventional
25% down · 7.5% · 30yr
- Down + closing
- —
- Monthly P&I
- —
- Monthly cashflow
- —
- DSCR
- —
- Eligible?
- —
Personal DTI + credit; lowest rate.
DSCR
20% down · 8.5% · 30yr
- Down + closing
- —
- Monthly P&I
- —
- Monthly cashflow
- —
- DSCR
- —
- Eligible?
- —
No personal income docs; deal must DSCR.
Hard money
10% down · 12.0% · 12mo
- Down + closing
- —
- Monthly P&I
- —
- Monthly cashflow
- —
- DSCR
- —
- Eligible?
- —
Short-term bridge; refi at stabilization.
Rent comps 9 comps
| Address | Beds | Baths | Sqft | Rent | $/sqft | DOM | Units | Dist |
|---|---|---|---|---|---|---|---|---|
| 1579 E Courtney Pl Fort Mohave, AZ | 2.0 | 2.0 | 948 | $999 | $1.05 | 13d | 1 | 0.24mi |
| 5080 S La Calzada Dr Fort Mohave, AZ | 2.0 | 1.0 | 900 | $1,150 | $1.28 | 13d | 1 | 0.24mi |
| 5085 S Jacaranda Pl Fort Mohave, AZ | 3.0 | 2.0 | 1200 | $1,750 | $1.46 | 13d | 1 | 0.35mi |
| 4783 S Whitegate Pl Fort Mohave, AZ | 3.0 | 2.0 | 1448 | $2,100 | $1.45 | 13d | 1 | 0.49mi |
| 4658 S Reyes Adobe Dr Fort Mohave, AZ | 3.0 | 2.0 | 1600 | $2,400 | $1.50 | 13d | 1 | 0.63mi |
| 1933 E Leisure Ln Fort Mohave, AZ | 2.0 | 2.0 | 1370 | $1,500 | $1.09 | 13d | 1 | 1.33mi |
| 4272 El Toro Dr Fort Mohave, AZ | 3.0 | 2.0 | 1349 | $1,500 | $1.11 | 13d | 1 | 1.37mi |
| 5657 S Pearl St Fort Mohave, AZ | 3.0 | 2.0 | 1000 | $1,500 | $1.50 | 13d | 1 | 1.46mi |
| 5657 S Rocky Rd Fort Mohave, AZ | 3.0 | 2.0 | 1407 | $1,800 | $1.28 | 13d | 1 | 1.46mi |
Listing history 17 events
-
2026-06-18days on market $139,000 Active 225 DOM
-
2026-06-17days on market $139,000 Active 224 DOM
-
2026-06-16days on market $139,000 Active 223 DOM
-
2026-06-15days on market $139,000 Active 222 DOM
-
2026-06-14days on market $139,000 Active 220 DOM
-
2026-06-13days on market $139,000 Active 219 DOM
-
2026-06-10days on market $139,000 Active 217 DOM
-
2026-06-09days on market $139,000 Active 216 DOM
-
2026-06-08days on market $139,000 Active 215 DOM
-
2026-06-07days on market $139,000 Active 214 DOM
-
2026-06-05days on market $139,000 Active 211 DOM
-
2026-06-03days on market $139,000 Active 210 DOM
-
2026-06-02days on market $139,000 Active 209 DOM
-
2026-06-01days on market $139,000 Active 208 DOM
-
2026-05-31days on market $139,000 Active 207 DOM
-
2026-05-30days on market $139,000 Active 206 DOM
-
2025-11-05$139,000 Active
ⓘ Source: listings_history table (triggers on properties + properties_extension) + one-shot
backfill from property_details.listing_events for pre-trigger history.
Climate risk First Street
- Flood 1/10 Low FEMA zone X (unshaded) · 0% chance over 30 yrs
- Wildfire 4/10 Moderate
- Heat 9/10 Extreme 7 d/yr ≥116°F today · 16 d/yr by 30 yrs out
- Wind 1/10 Low
- Air quality 1/10 Low 0 unhealthy d/yr today · 0 by 30 yrs out
Nearby sold comps map
Loading sold comps map…
Walkable amenities ~0.75 mi
Loading nearby amenities…
Taxation est. · year 1
- Rental income
- $21,063
- − Mortgage interest
- −$7,786
- − Property taxes
- −$2,085
- − Insurance
- −$695
- − Repairs & maintenance
- −$1,685
- − Management
- −$1,685
- − Depreciation
- −$4,044
- Taxable income
- $3,083
- Est. tax owed @ 24.0%
- −$740
- After-tax cash flow
- $4,373/yr
For passive investors: Depreciation is non-cash, so a rental often shows a tax loss while cash-flowing — sheltering income. Rental losses are passive: they offset passive income freely, and up to $25,000/yr can offset ordinary (W-2) income if you actively participate and your MAGI is under $100k (phasing out to $0 by $150k); unused losses carry forward. On sale, claimed depreciation is recaptured at up to 25%, and gains may owe capital-gains tax (a 1031 exchange can defer both). Figures are a year-1 estimate at your 24.0% rate — not tax advice; consult a CPA.
Schools (NCES district)
- District
- Colorado River Union High School District (4381)
- NCES district ID
- 0400082
- Math proficiency
- 13% ▼ -17.00%
- Reading proficiency
- 17% ▼ -18.00%
- Median HH income
- $39,132
- Composite
- 12.72/100
- National rank
- #9603
- State rank
- #213 of 249 in AZ
Livability — Fort Mohave
- Score
- 65/100
- State rank
- #88
- US rank
- #13539
Category grades
Schools grade is shown separately in the Schools card above.
Census & demographics
- Census place
- Fort Mohave, AZ
- County
- Mohave County · 181,906 people
- City population
- 15,467
- Metro
- Lake Havasu City-Kingman, AZ
- Population (ZIP)
- 15,467
- Household income
- $64,551
- Rent vs Own
- Severe rent burden
- 207.0
Population outlook (Mohave County) Hauer SSP2
- Today (2025)
- 209,184 people
- By 2030
- 209,674 · +0.2%
- By 2040
- 205,897 · -1.6%
- By 2050
- 196,810 · -5.9%
- By 2075
- 169,454 · -19.0%
- By 2100
- 136,630 · -34.7%
Race, ethnicity, and origin ACS 2023
- Neighborhood character
- Predominantly White (73%)
- Race & ethnicity
- White 73% Hispanic / Latino 18% Two or more races 8% Asian 4%
- Hispanic origin (detail)
- Mexican 14%
- Common ancestry
- Lithuanian 3% Romanian 2% Italian 1%
- Foreign-born
- 7% · Canada
- Languages at home
- 88% English-only · Spanish 7% Tagalog/Filipino 2% Other Asian/Pacific 1%
Political lean MEDSL · Mohave
- 2024 margin
- Solid R (+55.8) · D 21.8% · R 77.6%
- 2008→2024 swing
- -22.9pp toward R · 2008: -32.9pp · 2024: -55.8pp
- All cycles
- 2024: R+55.8 2020: R+51.3 2016: R+51.5 2012: R+42.6 2008: R+32.9
Not yet ingested
- Civics
- —
Market trends
- HPI YoY
- ▼ -15.22%
- Current HPI
- 278.7975
- Rent YoY
- —
- Metro
- Lake Havasu City-Kingman, AZ
- State GDP YoY
- ▲ 4.54%
- F500 in state
- 20
Industry mix (Fortune 500 HQ in AZ)
| Industry | F500 HQs | Revenue |
|---|---|---|
| Technology | 2 | $13B |
|
||
| Mining / Metals | 1 | $23B |
|
||
| Environmental Services | 1 | $16B |
|
||
| Metals / Steel | 1 | $14B |
|
||
| Technology Distribution | 1 | $9B |
|
||
| Homebuilding | 1 | $8B |
|
||
Price history
1 event — show timeline
- 2025-11-05 Listed $139,000 WARDEX
Cash-flow waterfall
monthlySold comps — $/sqft
last 12 mo · ≤1 miLoading sold comps…