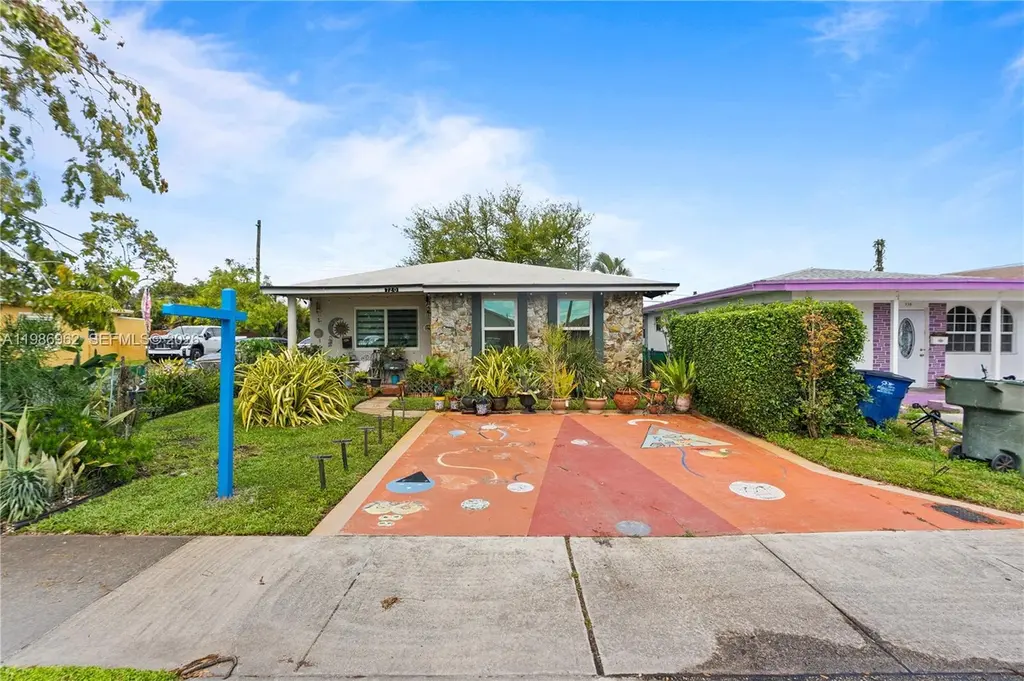
720 NW 4th St · Hallandale Beach, FL
Flood risk 1/10 · Minimal
- FEMA flood zone
- X (unshaded)
- Chance of flooding over 30 yrs
- 0.0%
- Est. flood insurance / yr
- $507 – $1,088
Fire risk 1/10 · Minimal
- Est. fire insurance / yr
- $947 – $1,759
Heat risk 10/10 · Severe
- Hot days now (above 105°F)
- 7 days/yr
- Hot days in 30 yrs
- 26 days/yr
Wind risk 10/10 · Severe
- Chance of severe wind over 30 yrs
- 99.0%
Air-quality risk 2/10 · Minimal
- Unhealthy air days now
- 2 days/yr
- Unhealthy air days in 30 yrs
- 2 days/yr
Risk factors via First Street. Map © Google.
Why this score? — see what drove the D grade
The composite is a weighted blend of 9 inputs, each scored 0–100. Each bar is that input's sub-score; the figure is the points it added to the 100-point composite (weight × sub-score).
- Cash flow +13.5/30.0
- ARV discount +8.0/15.0
- DSCR +4.1/10.0
- Schools +4.1/10.0
- Livability +4.0/5.0
- Rent growth +2.6/5.0
- 1% rule +2.5/10.0
- Condition / age +2.5/5.0
- Appreciation +0.0/10.0
$480,000
🖨 Deal sheet 📄 Offer letter ✓ Due diligence
Listing remarks MLS
BANK WANTS TO SELL THIS ONE QUICKLY!! BANK OWNED 3/2. UPDATED BATHROOMS AND NEWER KITCHEN. BANK MOTIVATED TO GET IT SOLD. IT DOES NOT GET ANY CHEAPER THAN THIS. BRING BUYERS TODAY. HOUSE IN GREAT CONDITION AND EASY ACCESS TO BEACH, SHOPPING, SCHOOL S, AND HIGHWAYS. CENTRALLY LOCATED! AT THIS PRICE THIS ONE WON'T LAST LONG. HOW MUCH CHEAPER CAN YOU GET??!!
Key facts
- Air conditioned shed
- Impact windows
- 4,000 sq ft lot
Tags
Property features AI
Exterior
- Parking: Driveway
- Security: Smoke detector(s)
- Utilities: Public water; Public sewer
- Home design: Single-story; Faces south; Effective year built
- Construction: Block construction; Tar/gravel roof; Less than quarter acre lot
- Exterior features: Fence; Shed; City street frontage (paved)
Interior
- Kitchen: Electric range; Dishwasher; Refrigerator
- Bedrooms: Includes a den; Includes a storage room
- Flooring: Ceramic tile; Hardwood; Wood
- Bathrooms: 2 full bathrooms
- Heating & cooling: Central heating; Central air; Ceiling fan(s)
- Interior features: Bedroom on main level; First floor entry
- Laundry & utility: Washer; Dryer; Electric water heater
Neighborhood map
What this means for you Summary
Snapshot
- This is a 3-bed/2.0-bath single-family listed at $480k.
Deal economics
- At list price, monthly cash flow is $17 ($200/yr) — positive.
- The deal already cash-flows at list — no discount required.
- To meet the 1% rule (rent ≥ 1% of price), the offer needs to be $361k (24.8% below list).
- Recommended offer: $361k (24.8% below list) — sets the bar for 1% rule.
- Cap rate 6.3% vs local median 5.2% in Hallandale Beach — meaningfully above typical; check what's discounted (condition, days-on-market, listing class) to confirm the premium yield is real.
Location & tenants
- Location reads 81/100 on livability (#86 in FL, #1,400 nationally) — a professional / high-income tenant draw. Strengths: commute A+, health & safety A+, crime B+; Watch: schools C-, employment D-.
- Broward (suburban): math 42% / reading 53% proficiency, ranked #46 of 73 in FL (top 63%) — families likely to look elsewhere, expect single-tenant / working-renter base with shorter leases.
- Market conditions: Rents flat; 1373 active listings in the ZIP; 40 comparable units currently listed for rent nearby; rentals at typical pace (median 21d on market — plan ~3-4 weeks tenant-placement turnaround); 2,111 units permitted in Broward County in 2024 (1,265 in 5+ unit buildings).
- At $3,609/mo this rent would consume 83% of the median local household income ($52k/yr) (locally 3293% of renters already pay >50% of income on rent) — very limited rent-growth headroom before tenants either downsize or default.
Forward outlook
- Local home prices are declining (-3.0%/yr); year-one equity from $3k of loan paydown is wiped out by about $14k of value loss. Plan a longer hold.
- Broward County population projected at +34% by 2050 — long-run rental-demand tailwind backs the buy-and-hold thesis.
Negotiation context
- It's been on market 87 days — a 6% lower offer ($451k) is reasonable based on typical stale-listing flexibility.
- 2 sale attempts since 18y ago with the ask held roughly flat each time — persistent listings suggest the price (not the market) is what's stuck; bring a comps-based counter.
- Current owner paid $127k; list at $480k implies a 278% gain — meaningful room to come down on a strong offer.
Risks & watch-outs
- Climate carrying-cost: severe wind risk, 99% chance of damaging wind over 30y; extreme-heat days projected 7→26/yr by 2055 (HVAC capex compounding) — expect insurance premiums to compound above CPI over the hold.
Questions for the listing agent
- It's been on market 87 days. Have you received any prior offers? Is the seller open to a 25% concession, seller financing, or rate buy-down credit?
- Why hasn't it sold? Are there any deal-killer items the seller is aware of (foundation, flood, title, zoning, code violations)?
- Is there a deadline driving the sale (1031 exchange, divorce, estate, relocation)? That informs how much negotiation room exists.
- The area grade is low — what's the realistic commute time and amenity access for the typical tenant pool here? Any planned neighborhood developments (good or bad) we should know about?
- What's the average days-on-market for RENTAL listings here right now (not sales)? A rising rental-DOM trend means longer vacancies and softer asking-rent achievability than the comps imply.
- What's the recent tenant-quality profile in this submarket — average credit score on applications, eviction rate, late-payment / NSF rate, and stable-employment percentage? A property-management company in the area should have these aggregated.
- How much new for-sale + rental construction is in the pipeline within 1–3 miles? Heavy new supply typically softens prices + rents 12–24 months out; constrained supply supports both.
Investment metrics
- 1% rule
- 0.75% ✗
- Cap rate
- 6.33%
- Cash-on-cash
- 0.15%
- DSCR
- 1.01
- GRM
- 11.1
CMA / ARV
- ARV (on-the-fly)
- $485,280
- Comps found
- 4
Show comp detail 4 sales within ~0.75 mi
| Address | Dist | Beds/Ba | Sqft | Sold | Price | $/sf | Match |
|---|---|---|---|---|---|---|---|
| 104 SW 7th Ave | 0.43mi | 3/2.0 | 1,328 (-8%) | 12mo | $440,000 | $331 | 57 |
| 811 NW 5th Ave | 0.34mi | 2/1.0 (-1) | 1,272 (-12%) | 5mo | $310,000 | $244 | 52 |
| 910 NW 4th Ave | 0.45mi | 3/2.5 | 1,560 (+8%) | 18mo | $570,000 | $365 | 48 |
| 617 SW 4th Ct | 0.73mi | 3/2.0 | 1,232 (-14%) | 18mo | $415,000 | $337 | 26 |
Match score weights: distance 35% · size 25% · config 20% · recency 20%. Top-matched comps best support the ARV.
Projected returns pro-forma
-3.0% appreciation · 0.43% rent growth · sell at horizon
- IRR
- -18.6%
- Equity multiple
- 0.36×
- Total profit
- $-86,062
- Equity at exit
- $71,570
- IRR
- -16.3%
- Equity multiple
- 0.18×
- Total profit
- $-110,025
- Equity at exit
- $41,502
Cash invested: $134,400 (down + closing). Projections, not guarantees.
Landlord ↔ Tenant lean methodology
- Overall (STATE)
- 87 Strongly Landlord-Friendly
- State Florida
- 87 Strongly Landlord-Friendly · R+3
- County
- — inherits STATE
- City
- — inherits STATE
ZIP-level market 33009
- Rents YoY
- 0.4%
- Active inventory
- 1373
- Price-to-rent
- 11.1×
Monthly cashflow live
- Estimated rent
- $3,609 high interval (Pro) →
- Mortgage (P&I)
- −$2,517
- Tax from tax record
- −$117 /mo · $1,407/yr
- Insurance
- −$200
- HOA
- −$0
- Vacancy / Maint / Mgmt
- −$758
- Net cashflow
- $17
Break-even live
UW: 25.0% down · 7.5% · 30yr · 1.5% tax · 5.0% vac · 8.0% maint · 8.0% mgmt
Financing live
Cash to close
- Down payment
- $120,000
- Closing costs
- $14,400
- Reserves months
- —
- Total cash needed
- —
Loan-product check · same deal, 3 products live
Conventional
25% down · 7.5% · 30yr
- Down + closing
- —
- Monthly P&I
- —
- Monthly cashflow
- —
- DSCR
- —
- Eligible?
- —
Personal DTI + credit; lowest rate.
DSCR
20% down · 8.5% · 30yr
- Down + closing
- —
- Monthly P&I
- —
- Monthly cashflow
- —
- DSCR
- —
- Eligible?
- —
No personal income docs; deal must DSCR.
Hard money
10% down · 12.0% · 12mo
- Down + closing
- —
- Monthly P&I
- —
- Monthly cashflow
- —
- DSCR
- —
- Eligible?
- —
Short-term bridge; refi at stabilization.
Rent comps 40 comps
| Address | Beds | Baths | Sqft | Rent | $/sqft | DOM | Units | Dist |
|---|---|---|---|---|---|---|---|---|
| 852 NW 8th St #852 Hallandale Beach, FL | 3.0 | 2.0 | 1170 | $2,800 | $2.39 | 22d | 1 | 0.35mi |
| 841 NW 10th St Hallandale Beach, FL | 3.0 | 2.0 | 1485 | $3,100 | $2.09 | 7d | 1 | 0.44mi |
| 841 NW 10th St Unit 841C Hallandale Beach, FL | 3.0 | 2.0 | 1585 | $3,200 | $2.02 | 20d | 1 | 0.44mi |
| 421 W Pembroke Rd Hallandale Beach, FL | 4.0 | 2.0 | 1250 | $3,999 | $3.20 | 24d | 1 | 0.47mi |
| 220 SW 9th Ave #516 Hallandale Beach, FL | 2.0 | 2.0 | 918 | $2,200 | $2.40 | 24d | 1 | 0.53mi |
| 220 SW 9th Ave Hallandale Beach, FL | 1.0–2.0 | 1.0–2.0 | 771 | $2,200 | $2.85 | 20d | 2 | 0.54mi |
| 208 NE 2nd Ave Hallandale Beach, FL | 4.0 | 2.0 | 1542 | $4,650 | $3.02 | 24d | 1 | 0.63mi |
| 220 SW 3rd Ave Hallandale Beach, FL | 4.0 | 2.0 | 1734 | $4,500 | $2.60 | 24d | 1 | 0.63mi |
| 220 SW 3rd Ave Hallandale Beach, FL | 4.0 | 2.0 | 1734 | $4,800 | $2.77 | 7d | 1 | 0.63mi |
| 1056 SW 2nd St Unit 1056 Hallandale Beach, FL | 3.0 | 2.0 | 1000 | $3,300 | $3.30 | 24d | 1 | 0.65mi |
| 1077 SW 2nd St Unit 2 Hallandale Beach, FL | 2.0 | 1.0 | 1829 | $2,500 | $1.37 | 7d | 1 | 0.66mi |
| 1033 SW 3rd St Hallandale Beach, FL | 2.0 | 1.0 | 875 | $2,800 | $3.20 | 24d | 1 | 0.68mi |
| 212 SW 1st Ave Hallandale Beach, FL | 4.0 | 3.0 | 1800 | $10,000 | $5.56 | 24d | 1 | 0.69mi |
| 90 SW 3rd St Unit 2400 Hallandale Beach, FL | 2.0 | 2.0 | 1079 | $3,700 | $3.43 | 24d | 1 | 0.74mi |
| 200 E Pembroke Rd Hallandale Beach, FL | 3.0 | 1.0–2.0 | 1006 | $4,120 | $4.10 | 1d | 62 | 0.76mi |
| 301 SW 5th St Hallandale Beach, FL | 2.0 | 2.0 | 1792 | $4,000 | $2.23 | 20d | 1 | 0.79mi |
| 401 SW 10th Ter Unit A Hallandale Beach, FL | 2.0 | 1.0 | 1200 | $2,400 | $2.00 | 20d | 1 | 0.79mi |
| 322 SW 11th Ave Hallandale Beach, FL | 3.0 | 1.0 | 1200 | $2,699 | $2.25 | 24d | 1 | 0.81mi |
| 1306 S 29th Ave Hollywood, FL | 3.0 | 2.0 | 1500 | $3,300 | $2.20 | 18d | 1 | 0.84mi |
| 401 N Federal Hwy Hallandale Beach, FL | 1.0–3.0 | 1.0–2.0 | 973 | $3,638 | $3.74 | 15d | 48 | 0.85mi |
| 644 SW 7th Ct Hallandale Beach, FL | 3.0 | 2.0 | 1492 | $3,800 | $2.55 | 3d | 1 | 0.85mi |
| 1120 S 28th Ave Hollywood, FL | 4.0 | 2.0 | 1576 | $4,275 | $2.71 | 2d | 1 | 0.86mi |
| 712 SW 7th Ter Hallandale Beach, FL | 4.0 | 3.0 | 1356 | $4,500 | $3.32 | 20d | 1 | 0.88mi |
| 2917 Plunkett St Unit 15C Hollywood, FL | 2.0 | 1.0 | 900 | $1,950 | $2.17 | 7d | 1 | 0.91mi |
| 211 SE 4th St #3 Hallandale Beach, FL | 3.0 | 2.5 | 1290 | $3,950 | $3.06 | 24d | 1 | 0.91mi |
| 2740 Dewey St Hollywood, FL | 3.0 | 1.0 | 1191 | $2,900 | $2.43 | 12d | 1 | 0.92mi |
| 707 SW 3rd Ave Hallandale Beach, FL | 3.0 | 2.0 | 1369 | $5,500 | $4.02 | 5d | 1 | 0.92mi |
| 839 SW 8th St #1 Hallandale Beach, FL | 2.0 | 1.5 | 1300 | $1,500 | $1.15 | 22d | 1 | 0.94mi |
| 110 N Federal Hwy #1401 Hallandale Beach, FL | 2.0 | 2.0 | 1220 | $3,999 | $3.28 | 7d | 1 | 0.95mi |
| 2648 Washington St Hollywood, FL | 2.0 | 1.0 | 1193 | $2,800 | $2.35 | 24d | 1 | 0.95mi |
| 215 SE 5th St Hallandale Beach, FL | 2.0–3.0 | 2.0 | 1133 | $3,675 | $3.24 | 24d | 5 | 0.97mi |
| 2750 Washington St Hollywood, FL | 2.0 | 1.0 | 1053 | $3,300 | $3.13 | 2d | 1 | 0.99mi |
| 2750 Washington St Hollywood, FL | 2.0 | 1.0 | 1053 | $3,500 | $3.32 | 15d | 1 | 0.99mi |
| 2849 Dewey St Unit 2849 Hollywood, FL | 2.0 | 2.0 | 1265 | $2,600 | $2.06 | 11d | 1 | 1.00mi |
| 2849 Dewey St Unit 2849 Hollywood, FL | 2.0 | 2.0 | 1265 | $2,600 | $2.06 | 7d | 1 | 1.00mi |
| 223 SW 10th St Hallandale Beach, FL | 3.0 | 3.0 | 1289 | $3,900 | $3.03 | 24d | 1 | 1.10mi |
| 906 NE 6th St Hallandale Beach, FL | 3.0 | 2.0 | 1080 | $4,250 | $3.94 | 12d | 1 | 1.11mi |
| 906 NE 6th St Hallandale Beach, FL | 3.0 | 2.0 | 1080 | $4,250 | $3.94 | 24d | 1 | 1.11mi |
| 906 NE 6th St Hallandale Beach, FL | 3.0 | 2.0 | 1080 | $4,250 | $3.94 | 5d | 1 | 1.11mi |
| 211 SE 9th St Hallandale Beach, FL | 4.0 | 3.0 | 1540 | $4,250 | $2.76 | 24d | 1 | 1.16mi |
Listing history 16 events
-
2026-06-18days on market $480,000 Active 87 DOM
-
2026-06-17days on market $480,000 Active 86 DOM
-
2026-06-16days on market $480,000 Active 85 DOM
-
2026-06-15days on market $480,000 Active 84 DOM
-
2026-06-13days on market $480,000 Active 82 DOM
-
2026-06-09days on market $480,000 Active 78 DOM
-
2026-06-08days on market $480,000 Active 77 DOM
-
2026-06-07days on market $480,000 Active 76 DOM
-
2026-06-04days on market $480,000 Active 73 DOM
-
2026-06-03days on market $480,000 Active 72 DOM
-
2026-06-02days on market $480,000 Active 71 DOM
-
2026-06-01days on market $480,000 Active 70 DOM
-
2026-05-31days on market $480,000 Active 69 DOM
-
2026-03-20$480,000 Active
-
2008-10-07soldstatus $127,000 360-char remark
Show marketing remark (360 chars)
BANK WANTS TO SELL THIS ONE QUICKLY!! BANK OWNED 3/2. UPDATED BATHROOMS AND NEWER KITCHEN. BANK MOTIVATED TO GET IT SOLD. IT DOES NOT GET ANY CHEAPER THAN THIS. BRING BUYERS TODAY. HOUSE IN GREAT CONDITION AND EASY ACCESS TO BEACH, SHOPPING, SCHOOL S, AND HIGHWAYS. CENTRALLY LOCATED! AT THIS PRICE THIS ONE WON'T LAST LONG. HOW MUCH CHEAPER CAN YOU GET??!!
-
2008-07-05$125,000 360-char remark
Show marketing remark (360 chars)
BANK WANTS TO SELL THIS ONE QUICKLY!! BANK OWNED 3/2. UPDATED BATHROOMS AND NEWER KITCHEN. BANK MOTIVATED TO GET IT SOLD. IT DOES NOT GET ANY CHEAPER THAN THIS. BRING BUYERS TODAY. HOUSE IN GREAT CONDITION AND EASY ACCESS TO BEACH, SHOPPING, SCHOOL S, AND HIGHWAYS. CENTRALLY LOCATED! AT THIS PRICE THIS ONE WON'T LAST LONG. HOW MUCH CHEAPER CAN YOU GET??!!
ⓘ Source: listings_history table (triggers on properties + properties_extension) + one-shot
backfill from property_details.listing_events for pre-trigger history.
Tax reassessment forecast FL · Resets to sale price
- Current annual tax
- $1,407 · $117/mo
- Projected year-2 tax
- $3,984 · $332/mo
- Expected delta
- +$2,577/yr (+$215/mo · 183.1%)
ⓘ Screening estimate from a state-policy table — verify with the county assessor before closing.
Climate risk First Street
- Flood 1/10 Low FEMA zone X (unshaded) · 0% chance over 30 yrs
- Wildfire 1/10 Low
- Heat 10/10 Extreme 7 d/yr ≥105°F today · 26 d/yr by 30 yrs out
- Wind 10/10 Extreme 99% chance of damaging wind over 30 yrs
- Air quality 2/10 Low 2 unhealthy d/yr today · 2 by 30 yrs out
Nearby sold comps map
Loading sold comps map…
Walkable amenities ~0.75 mi
Loading nearby amenities…
Taxation est. · year 1
- Rental income
- $43,308
- − Mortgage interest
- −$26,887
- − Property taxes
- −$1,407
- − Insurance
- −$2,400
- − Repairs & maintenance
- −$3,465
- − Management
- −$3,465
- − Depreciation
- −$13,964
- Taxable loss
- −$8,280
- Est. tax savings @ 24.0%
- +$1,987
- After-tax cash flow
- $2,187/yr
For passive investors: Depreciation is non-cash, so a rental often shows a tax loss while cash-flowing — sheltering income. Rental losses are passive: they offset passive income freely, and up to $25,000/yr can offset ordinary (W-2) income if you actively participate and your MAGI is under $100k (phasing out to $0 by $150k); unused losses carry forward. On sale, claimed depreciation is recaptured at up to 25%, and gains may owe capital-gains tax (a 1031 exchange can defer both). Figures are a year-1 estimate at your 24.0% rate — not tax advice; consult a CPA.
Schools (NCES district)
- District
- Broward
- NCES district ID
- 1200180
- Math proficiency
- 42% ▼ -18.00%
- Reading proficiency
- 53% ▼ -5.00%
- Median HH income
- $52,139
- Composite
- 40.88/100
- National rank
- #3621
- State rank
- #46 of 73 in FL
Livability — Hallandale Beach
- Score
- 81/100
- State rank
- #86
- US rank
- #1400
Category grades
Schools grade is shown separately in the Schools card above.
Census & demographics
- Census place
- Hallandale Beach, FL
- County
- Broward County · 1,963,430 people
- City population
- 44,021
- Metro
- Miami-Fort Lauderdale-Pompano Beach, FL
- Population (ZIP)
- 44,502
- Household income
- $52,079
- Rent vs Own
- Severe rent burden
- 3293.0
Population outlook (Broward County) Hauer SSP2
- Today (2025)
- 2,207,033 people
- By 2030
- 2,360,704 · +7.0%
- By 2040
- 2,661,208 · +20.6%
- By 2050
- 2,946,698 · +33.5%
- By 2075
- 3,602,273 · +63.2%
- By 2100
- 3,970,984 · +79.9%
Race, ethnicity, and origin ACS 2023
- Neighborhood character
- Diverse neighborhood (Simpson 0.67)
- Race & ethnicity
- Hispanic / Latino 39% White 39% Two or more races 24% Black 17% Asian 1%
- Hispanic origin (detail)
- Mexican 2% Puerto Rican 3% Cuban 9% Dominican 3% Salvadoran 2%
- Common ancestry
- Scotch-Irish 5% Hispanic 5% Subsaharan African 3%
- Foreign-born
- 51% · Canada, Jamaica, Dominican Republic
- Languages at home
- 38% English-only · Spanish 36% Russian/Polish/Slavic 12% French/Haitian/Cajun 7%
Political lean MEDSL · Broward
- 2024 margin
- D (+17.0) · D 58.0% · R 41.0%
- 2008→2024 swing
- -17.8pp toward R · 2008: 34.7pp · 2024: 17.0pp
- All cycles
- 2024: D+17.0 2020: D+29.8 2016: D+35.0 2012: D+34.9 2008: D+34.7
Not yet ingested
- Civics
- —
Market trends
- HPI YoY
- ▼ -299.13%
- Current HPI
- 329.9081
- Rent YoY
- ▲ 0.43%
- Metro
- Miami-Fort Lauderdale-Pompano Beach, FL
- State GDP YoY
- ▲ 3.28%
- F500 in state
- 36
Industry mix (Fortune 500 HQ in FL)
| Industry | F500 HQs | Revenue |
|---|---|---|
| Industrial Technology | 2 | $29B |
|
||
| Insurance | 2 | $17B |
|
||
| Retail | 1 | $60B |
|
||
| Technology Distribution | 1 | $58B |
|
||
| Homebuilding | 1 | $35B |
|
||
| Technology Manufacturing | 1 | $35B |
|
||
Price history
+284.0% since first listed3 events — show timeline
- 2026-03-20 Listed $480,000 MARMLS
- 2008-10-07 Sold (MLS) $127,000 MARMLS
- 2008-07-05 Listed $125,000 MARMLS
Property tax history
+0.5%/yrLatest (2025): $1,407 · +2.6% YoY. Source: county tax records.
Cash-flow waterfall
monthlySold comps — $/sqft
last 12 mo · ≤1 miLoading sold comps…