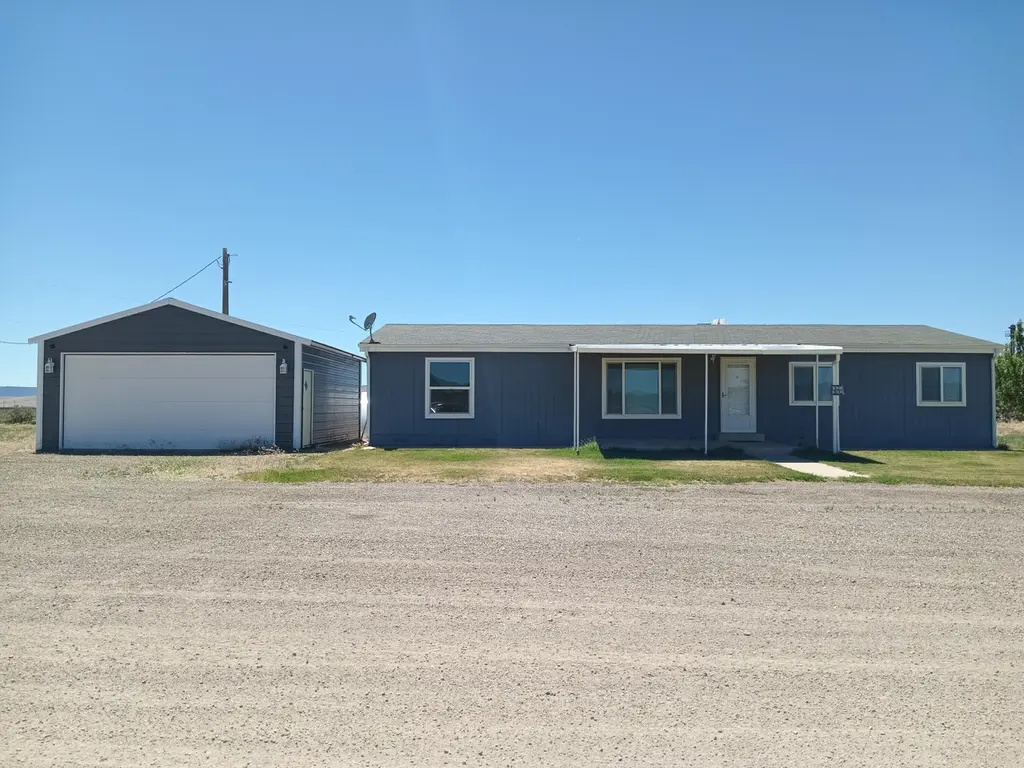
3248 S 1000 E Unit (Home Only) No Land · Beryl Junction, UT
Flood risk 1/10 · Minimal
- FEMA flood zone
- X
- Chance of flooding over 30 yrs
- 0.0%
- Est. flood insurance / yr
- $473 – $860
Fire risk 6/10 · Moderate
- Est. fire insurance / yr
- $453 – $841
Heat risk 4/10 · Minor
- Hot days now (above 91°F)
- 8 days/yr
- Hot days in 30 yrs
- 21 days/yr
Wind risk 1/10 · Minimal
- Chance of severe wind over 30 yrs
- —
Air-quality risk 1/10 · Minimal
- Unhealthy air days now
- 0 days/yr
- Unhealthy air days in 30 yrs
- 0 days/yr
Risk factors via First Street. Map © Google.
Why this score? — see what drove the B+ grade
The composite is a weighted blend of 9 inputs, each scored 0–100. Each bar is that input's sub-score; the figure is the points it added to the 100-point composite (weight × sub-score).
- Cash flow +30.0/30.0
- 1% rule +10.0/10.0
- DSCR +10.0/10.0
- ARV discount +7.5/15.0
- Appreciation +5.0/10.0
- Condition / age +4.8/5.0
- Schools +3.5/10.0
- Livability +2.7/5.0
- Rent growth +2.5/5.0
$75,000
🖨 Deal sheet (PDF) 📄 Offer letter ✓ Due diligence
Listing remarks
4bed/2bath Manufactured Home with Detached 2 Car Garage being sold only. No land included. Buyer responsible to transport home & relocate to their own property & responsible for all fees associated. Home is in Excellent Condition. Updated in 2017. New Windows, cabinets, flooring, etc. Price reflects only the home being sold.
Key facts
- Updated in 2017
- New flooring
- New cabinets
Tags
Property features AI
Exterior
- Parking: 2-car garage
- Utilities: No public water source listed
- Home design: Manufactured home; Single-story; One level
- Construction: Wood siding; Built as a manufactured house
- Exterior features: Porch; No patio
Interior
- Kitchen: Dishwasher; Disposal; Refrigerator; Range; Microwave; Gas water heater
- Bedrooms: Bedrooms not specified
- Flooring: Carpet; Laminate
- Bathrooms: 2 full bathrooms
- Heating & cooling: Central air; Ceiling fans; Electric heating
- Interior features: Insulated, double-pane windows; Porch
- Laundry & utility: Washer; Dryer
Neighborhood map
What this means for you Summary
Snapshot
- This is a 4-bed/2.0-bath single-family listed at $75k. Condition is rated excellent.
Deal economics
- At list price, monthly cash flow is $597 ($7k/yr) — positive.
- The deal already cash-flows at list — no discount required.
- Meets the 1% rule at list price ($1k rent vs $75k).
Location & tenants
- Location reads 54/100 on livability (#285 in UT) — a working-class tenant base; expect higher turnover. Strengths: cost of living A+; Watch: schools F, amenities F, commute F.
- Iron District (town): math 40% / reading 44% proficiency, ranked #42 of 80 in UT (top 52%) — families likely to look elsewhere, expect single-tenant / working-renter base with shorter leases.
- Market conditions: 222 active listings in the ZIP; 655 units permitted in Iron County in 2024 (0 in 5+ unit buildings).
Forward outlook
- In year one you build about $3k of equity ($519 loan paydown + $2k appreciation (3.0% local appreciation)).
- Iron County population projected at +14% by 2050 — modest demand growth; plan on rents tracking national, not racing it.
- At projected returns (3.0% appreciation + 3.0% rent growth), your $21k cash investment doubles in ~3 years — after that, you're playing with house money.
Negotiation context
- Only 11 days on market — expect competitive offers; lowballing is unlikely to land.
Risks & watch-outs
- Climate carrying-cost: major wildfire risk — expect insurance premiums to compound above CPI over the hold.
Questions for the listing agent
- Is there a deadline driving the sale (1031 exchange, divorce, estate, relocation)? That informs how much negotiation room exists.
- Schools are F-rated, which usually means shorter tenancies and higher turnover. Who's the typical renter profile here, and what's been the actual vacancy rate?
- What's the average days-on-market for RENTAL listings here right now (not sales)? A rising rental-DOM trend means longer vacancies and softer asking-rent achievability than the comps imply.
- What's the recent tenant-quality profile in this submarket — average credit score on applications, eviction rate, late-payment / NSF rate, and stable-employment percentage? A property-management company in the area should have these aggregated.
- How much new for-sale + rental construction is in the pipeline within 1–3 miles? Heavy new supply typically softens prices + rents 12–24 months out; constrained supply supports both.
Investment metrics
- 1% rule
- 1.88% ✓
- Cap rate
- 15.85%
- Cash-on-cash
- 34.13%
- DSCR
- 2.52
- GRM
- 4.4
CMA / ARV
No comps found within radius.
Projected returns pro-forma
3.0% appreciation · 3.0% rent growth · sell at horizon
- IRR
- 39.8%
- Equity multiple
- 3.24×
- Total profit
- $47,093
- Equity at exit
- $33,723
- IRR
- 39.8%
- Equity multiple
- 6.45×
- Total profit
- $114,380
- Equity at exit
- $51,972
Cash invested: $21,000 (down + closing). Projections, not guarantees.
Landlord ↔ Tenant lean methodology
- Overall (STATE)
- 86 Strongly Landlord-Friendly
- State Utah
- 86 Strongly Landlord-Friendly · R+15
- County
- — inherits STATE
- City
- — inherits STATE
ZIP-level market 84714
- Active inventory
- 222
- Price-to-rent
- 4.4×
Monthly cashflow live
- Estimated rent
- $1,412 medium interval (Pro) →
- Mortgage (P&I)
- −$393
- Tax est. 1.5%
- −$94 /mo · $1,125/yr
- Insurance
- −$31
- HOA
- −$0
- Vacancy / Maint / Mgmt
- −$297
- Net cashflow
- $597
Break-even live
Sensitivity live
| Price | -10% $649 | -5% $623 | +0% $597 | +5% $571 | +10% $545 |
|---|---|---|---|---|---|
| Rent | -10% $486 | -5% $541 | +0% $597 | +5% $653 | +10% $709 |
| Rate | -1.0pp $635 | -0.5pp $616 | base $597 | +0.5pp $578 | +1.0pp $558 |
UW: 25.0% down · 7.5% · 30yr · 1.5% tax · 5.0% vac · 8.0% maint · 8.0% mgmt
Financing live
Cash to close
- Down payment
- $18,750
- Closing costs
- $2,250
- Reserves months
- —
- Total cash needed
- —
Loan-product check · same deal, 3 products live
Conventional
25% down · 7.5% · 30yr
- Down + closing
- —
- Monthly P&I
- —
- Monthly cashflow
- —
- DSCR
- —
- Eligible?
- —
Personal DTI + credit; lowest rate.
DSCR
20% down · 8.5% · 30yr
- Down + closing
- —
- Monthly P&I
- —
- Monthly cashflow
- —
- DSCR
- —
- Eligible?
- —
No personal income docs; deal must DSCR.
Hard money
10% down · 12.0% · 12mo
- Down + closing
- —
- Monthly P&I
- —
- Monthly cashflow
- —
- DSCR
- —
- Eligible?
- —
Short-term bridge; refi at stabilization.
Listing history 9 events
-
2026-06-21days on market $75,000 Active 11 DOM
-
2026-06-19days on market $75,000 Active 9 DOM
-
2026-06-18days on market $75,000 Active 8 DOM
-
2026-06-17days on market $75,000 Active 7 DOM
-
2026-06-16days on market $75,000 Active 6 DOM
-
2026-06-15days on market $75,000 Active 5 DOM
-
2026-06-14days on market $75,000 Active 3 DOM
-
2026-06-12remarks 330-char remark
-
2026-06-12$75,000 Active 2 DOM
ⓘ Source: listings_history table (triggers on properties + properties_extension) + one-shot
backfill from property_details.listing_events for pre-trigger history.
Climate risk First Street
- Flood 1/10 Low FEMA zone X · 0% chance over 30 yrs
- Wildfire 6/10 Major
- Heat 4/10 Moderate 8 d/yr ≥91°F today · 21 d/yr by 30 yrs out
- Wind 1/10 Low
- Air quality 1/10 Low 0 unhealthy d/yr today · 0 by 30 yrs out
Nearby sold comps map
Loading sold comps map…
Walkable amenities ~0.75 mi
Loading nearby amenities…
Taxation est. · year 1
- Rental income
- $16,945
- − Mortgage interest
- −$4,201
- − Property taxes
- −$1,125
- − Insurance
- −$375
- − Repairs & maintenance
- −$1,356
- − Management
- −$1,356
- − Depreciation
- −$2,182
- Taxable income
- $6,350
- Est. tax owed @ 24.0%
- −$1,524
- After-tax cash flow
- $5,642/yr
For passive investors: Depreciation is non-cash, so a rental often shows a tax loss while cash-flowing — sheltering income. Rental losses are passive: they offset passive income freely, and up to $25,000/yr can offset ordinary (W-2) income if you actively participate and your MAGI is under $100k (phasing out to $0 by $150k); unused losses carry forward. On sale, claimed depreciation is recaptured at up to 25%, and gains may owe capital-gains tax (a 1031 exchange can defer both). Figures are a year-1 estimate at your 24.0% rate — not tax advice; consult a CPA.
Condition & rehab AI · 13 photos
This home is in excellent condition with no major repairs needed. Fresh paint and updated window treatments can further enhance its value.
Value-add opportunities
- Both Paint exterior and interior — Fresh paint can enhance curb appeal and interior aesthetics
- Both Replace window treatments — New window treatments can improve energy efficiency and aesthetics
- Both Install smart home devices — Smart home devices can increase home's value and appeal to tech-savvy buyers
Renovation cost estimate screening
Value-add ROI direction
- Both Paint exterior and interior — Fresh paint can enhance curb appeal and interior aesthetics ↑
- Both Replace window treatments — New window treatments can improve energy efficiency and aesthetics ↑
- Both Install smart home devices — Smart home devices can increase home's value and appeal to tech-savvy buyers ↑
ⓘ Cost ranges are severity-bucket heuristics (US national rule-of-thumb). Get contractor quotes + a written scope before underwriting a rehab budget.
Schools (NCES district)
- District
- Iron District
- NCES district ID
- 4900390
- Math proficiency
- 40% ▼ -9.00%
- Reading proficiency
- 44% ▼ -6.00%
- Median HH income
- $43,150
- Composite
- 35.49/100
- National rank
- #4922
- State rank
- #42 of 80 in UT
Livability — Beryl Junction
- Score
- 54/100
- State rank
- #285
- US rank
- #24070
Category grades
Schools grade is shown separately in the Schools card above.
Census & demographics
- Population (ZIP)
- 1,078
Population outlook (Iron County) Hauer SSP2
- Today (2025)
- 53,029 people
- By 2030
- 55,084 · +3.9%
- By 2040
- 58,269 · +9.9%
- By 2050
- 60,462 · +14.0%
- By 2075
- 61,312 · +15.6%
- By 2100
- 57,973 · +9.3%
Race, ethnicity, and origin ACS 2023
- Neighborhood character
- Predominantly White (75%)
- Race & ethnicity
- White 75% Hispanic / Latino 18% Two or more races 11%
- Hispanic origin (detail)
- Mexican 14% Puerto Rican 4%
- Common ancestry
- Italian 12% Iranian 2% Scotch-Irish 1%
- Foreign-born
- 4% · Canada
- Languages at home
- 97% English-only · Spanish 3%
Political lean MEDSL · Iron
- 2024 margin
- Solid R (+57.0) · D 20.4% · R 77.4% · Other 2.2%
- 2008→2024 swing
- -0.7pp no change · 2008: -56.3pp · 2024: -57.0pp
- All cycles
- 2024: R+57.0 2020: R+56.6 2016: R+51.6 2012: R+71.8 2008: R+56.3
Not yet ingested
- Civics
- —
Market trends
- HPI YoY
- —
- Current HPI
- —
- Rent YoY
- —
- Metro
- —
- State GDP YoY
- ▲ 3.54%
- F500 in state
- 2
Industry mix (Fortune 500 HQ in UT)
| Industry | F500 HQs | Revenue |
|---|---|---|
| Financial Services | 1 | $3B |
|
||
Price history
1 event — show timeline
- 2026-06-10 Listed $75,000 ICBORMLS
Cash-flow waterfall
monthlySold comps — $/sqft
last 12 mo · ≤1 miLoading sold comps…