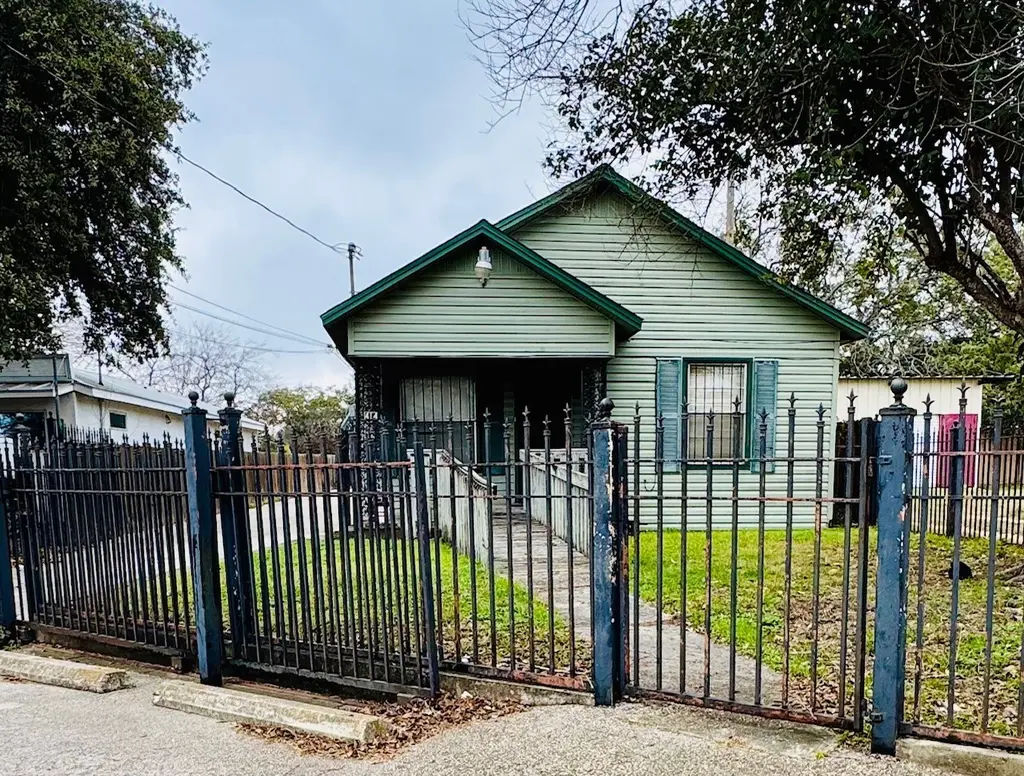
414 Vine St · San Antonio, TX
Flood risk 1/10 · Minimal
- FEMA flood zone
- X (unshaded)
- Chance of flooding over 30 yrs
- 0.0%
- Est. flood insurance / yr
- $507 – $1,088
Fire risk 1/10 · Minimal
- Est. fire insurance / yr
- $1,222 – $2,270
Heat risk 8/10 · Major
- Hot days now (above 108°F)
- 5 days/yr
- Hot days in 30 yrs
- 16 days/yr
Wind risk 8/10 · Major
- Chance of severe wind over 30 yrs
- 80.0%
Air-quality risk 2/10 · Minimal
- Unhealthy air days now
- 1 days/yr
- Unhealthy air days in 30 yrs
- 2 days/yr
Risk factors via First Street. Map © Google.
Why this score? — see what drove the B- grade
The composite is a weighted blend of 9 inputs, each scored 0–100. Each bar is that input's sub-score; the figure is the points it added to the 100-point composite (weight × sub-score).
- Cash flow +30.0/30.0
- 1% rule +10.0/10.0
- DSCR +10.0/10.0
- ARV discount +7.5/15.0
- Livability +4.0/5.0
- Rent growth +2.8/5.0
- Condition / age +2.5/5.0
- Schools +1.4/10.0
- Appreciation +0.0/10.0
$95,000
🖨 Deal sheet (PDF) 📄 Offer letter ✓ Due diligence
Listing remarks MLS
Imagine the possibilities! Whether you’re seeking a comfortable living space or a functional office, this 1,512 sq. ft. property offers incredible potential. Situated on a generous lot, the fully gated 3-bedroom, 2-bath home features a dining and living room combination, a spacious kitchen equipped with a microwave, dishwasher, and gas range, plus an in-home utility room. Additional highlights include a versatile flex room/office and ADA accessibility with a convenient wheelchair ramp.
Key facts
- Spacious kitchen
- In-home utility room
- Ada accessibility
Tags
Neighborhood map
What this means for you Summary
Snapshot
- This is a 2-bed/2.0-bath single-family listed at $95k.
Deal economics
- At list price, monthly cash flow is $540 ($6k/yr) — positive.
- The deal already cash-flows at list — no discount required.
- Meets the 1% rule at list price ($2k rent vs $95k).
- Recommended offer: $84k (12.0% below list) — sets the bar for market timing.
- Cap rate 13.1% vs local median 3.8% in San Antonio — top-decile yield for the area; either an underpriced asset or a hidden risk that comps aren't pricing in. Stress-test before assuming the spread holds.
Location & tenants
- Location reads 80/100 on livability (#31 in TX, #1,616 nationally) — a professional / high-income tenant draw. Strengths: amenities A+, commute A+, cost of living A+; Watch: schools C-, crime F.
- San Antonio ISD (urban): math 12% / reading 22% proficiency, ranked #805 of 826 in TX (top 98%) — low school quality limits family demand, transient renter base, plan for 1-2y turnover; 80% free/reduced lunch — lower-income household profile, screen leases tightly.
- Market conditions: Rents rising (+1.1%/yr); 269 active listings in the ZIP; 40 comparable units currently listed for rent nearby; rentals at typical pace (median 25d on market — plan ~3-4 weeks tenant-placement turnaround); 8,308 units permitted in Bexar County in 2024 (2,506 in 5+ unit buildings).
- This rent runs 33% of the median local income ($55k/yr) — at the standard rent-burdened threshold; future hikes will face affordability resistance.
Forward outlook
- Local home prices are declining (-3.0%/yr); year-one equity from $657 of loan paydown is wiped out by about $3k of value loss. Plan a longer hold.
- Bexar County population projected at +50% by 2050 — long-run rental-demand tailwind backs the buy-and-hold thesis.
- At projected returns (-3.0% appreciation + 1.1% rent growth), your $27k cash investment doubles in ~6 years — after that, you're playing with house money.
Negotiation context
- It's been on market 221 days — a 12% lower offer ($84k) is reasonable based on typical stale-listing flexibility.
- 5 sale attempts since 2y ago; this cycle's ask has dropped $24k (20%) from the opening price — seller is motivated, your offer sets the floor, not the list.
Risks & watch-outs
- Watch-outs: built in 1920 — expect roof / HVAC / electrical / plumbing capex.
- Climate carrying-cost: severe wind risk, 80% chance of damaging wind over 30y; extreme-heat days projected 5→16/yr by 2055 (HVAC capex compounding) — expect insurance premiums to compound above CPI over the hold.
Questions for the listing agent
- It's been on market 221 days. Have you received any prior offers? Is the seller open to a 12% concession, seller financing, or rate buy-down credit?
- Built in 1920 — when were the roof, HVAC, electrical panel, plumbing, and water heater last replaced?
- Why hasn't it sold? Are there any deal-killer items the seller is aware of (foundation, flood, title, zoning, code violations)?
- Is there a deadline driving the sale (1031 exchange, divorce, estate, relocation)? That informs how much negotiation room exists.
- Crime grade is F in this area — have there been break-ins, vandalism, or insurance claims at this property in the last 3 years? What carrier currently insures it and at what premium?
- What's the average days-on-market for RENTAL listings here right now (not sales)? A rising rental-DOM trend means longer vacancies and softer asking-rent achievability than the comps imply.
- What's the recent tenant-quality profile in this submarket — average credit score on applications, eviction rate, late-payment / NSF rate, and stable-employment percentage? A property-management company in the area should have these aggregated.
- How much new for-sale + rental construction is in the pipeline within 1–3 miles? Heavy new supply typically softens prices + rents 12–24 months out; constrained supply supports both.
Investment metrics
- 1% rule
- 1.59% ✓
- Cap rate
- 13.11%
- Cash-on-cash
- 24.36%
- DSCR
- 2.08
- GRM
- 5.2
CMA / ARV
- ARV (median comp)
- $248,286
- List price
- $95,000
- Delta
- -61.74%
- Verdict
- UNDERPRICED
- Comps
- 20 within 1.0 mi
Show comp detail 12 sales within ~0.75 mi
| Address | Dist | Beds/Ba | Sqft | Sold | Price | $/sf | Match |
|---|---|---|---|---|---|---|---|
| 139 Reichert St | 0.24mi | 3/2.0 (+1) | 1,447 (-4%) | 2mo | $260,000 | $180 | 75 |
| 728 Porter St | 0.30mi | 3/2.0 (+1) | 1,522 (+1%) | 15mo | $257,000 | $169 | 68 |
| 2134 Virginia Blvd | 0.16mi | 3/2.0 (+1) | 1,634 (+8%) | 8mo | $203,000 | $124 | 67 |
| 1123 Essex | 0.38mi | 3/2.0 (+1) | 1,536 (+2%) | 11mo | $295,000 | $192 | 65 |
| 147 Vine St | 0.34mi | 3/2.5 (+1) | 1,438 (-5%) | 6mo | $230,000 | $160 | 64 |
| 1611 S Gevers #102 | 0.46mi | 3/2.5 (+1) | 1,490 (-2%) | 7mo | $275,000 | $185 | 63 |
| 307 Harding | 0.52mi | 3/2.0 (+1) | 1,517 (+0%) | 11mo | $129,900 | $86 | 61 |
| 155 Vine St | 0.33mi | 3/2.5 (+1) | 1,438 (-5%) | 10mo | $230,000 | $160 | 61 |
| 1031 S Gevers St | 0.32mi | 3/2.5 (+1) | 1,438 (-5%) | 13mo | $235,000 | $163 | 59 |
| 1027 S Gevers St | 0.32mi | 3/2.5 (+1) | 1,438 (-5%) | 15mo | $249,000 | $173 | 57 |
| 1144 Rigsby | 0.71mi | 3/2.0 (+1) | 1,496 (-1%) | 4mo | $295,000 | $197 | 56 |
| 239 Nelson Ave | 0.61mi | 3/2.0 (+1) | 1,362 (-10%) | 14mo | $275,000 | $202 | 38 |
Match score weights: distance 35% · size 25% · config 20% · recency 20%. Top-matched comps best support the ARV.
Projected returns pro-forma
-3.0% appreciation · 1.07% rent growth · sell at horizon
- IRR
- 15.5%
- Equity multiple
- 1.61×
- Total profit
- $16,130
- Equity at exit
- $14,165
- IRR
- 22.7%
- Equity multiple
- 2.77×
- Total profit
- $47,026
- Equity at exit
- $8,214
Cash invested: $26,600 (down + closing). Projections, not guarantees.
Landlord ↔ Tenant lean methodology
- Overall (STATE)
- 87 Strongly Landlord-Friendly
- State Texas
- 87 Strongly Landlord-Friendly · R+5
- County
- — inherits STATE
- City
- — inherits STATE
ZIP-level market 78210
- Rents YoY
- 1.1%
- Active inventory
- 269
- Price-to-rent
- 5.2×
Monthly cashflow live
- Estimated rent
- $1,514 high interval (Pro) →
- Mortgage (P&I)
- −$498
- Tax est. 1.5%
- −$119 /mo · $1,425/yr
- Insurance
- −$40
- HOA
- −$0
- Vacancy / Maint / Mgmt
- −$318
- Net cashflow
- $540
Break-even live
Sensitivity live
| Price | -10% $606 | -5% $573 | +0% $540 | +5% $507 | +10% $474 |
|---|---|---|---|---|---|
| Rent | -10% $420 | -5% $480 | +0% $540 | +5% $600 | +10% $660 |
| Rate | -1.0pp $588 | -0.5pp $564 | base $540 | +0.5pp $515 | +1.0pp $490 |
UW: 25.0% down · 7.5% · 30yr · 1.5% tax · 5.0% vac · 8.0% maint · 8.0% mgmt
Financing live
Cash to close
- Down payment
- $23,750
- Closing costs
- $2,850
- Reserves months
- —
- Total cash needed
- —
Loan-product check · same deal, 3 products live
Conventional
25% down · 7.5% · 30yr
- Down + closing
- —
- Monthly P&I
- —
- Monthly cashflow
- —
- DSCR
- —
- Eligible?
- —
Personal DTI + credit; lowest rate.
DSCR
20% down · 8.5% · 30yr
- Down + closing
- —
- Monthly P&I
- —
- Monthly cashflow
- —
- DSCR
- —
- Eligible?
- —
No personal income docs; deal must DSCR.
Hard money
10% down · 12.0% · 12mo
- Down + closing
- —
- Monthly P&I
- —
- Monthly cashflow
- —
- DSCR
- —
- Eligible?
- —
Short-term bridge; refi at stabilization.
Rent comps 40 comps
| Address | Beds | Baths | Sqft | Rent | $/sqft | DOM | Units | Dist |
|---|---|---|---|---|---|---|---|---|
| 322 Vine St #102 San Antonio, TX | 3.0 | 2.5 | 1401 | $1,400 | $1.00 | 24d | 1 | 0.10mi |
| 512 Cooper St San Antonio, TX | 2.0 | 1.0 | 1116 | $1,295 | $1.16 | 24d | 1 | 0.11mi |
| 139 San Salvador Ave Unit 103 San Antonio, TX | 2.0 | 2.5 | 1245 | $1,490 | $1.20 | 15d | 1 | 0.13mi |
| 1431 Aransas Ave San Antonio, TX | 3.0 | 1.0 | 1108 | $1,195 | $1.08 | 15d | 1 | 0.16mi |
| 215 San Salvador Ave Unit 101 San Antonio, TX | 3.0 | 2.5 | 1783 | $1,595 | $0.89 | 5d | 1 | 0.19mi |
| 307 San Salvador Ave Unit 101 San Antonio, TX | 3.0 | 2.5 | 1783 | $1,595 | $0.89 | 5d | 1 | 0.26mi |
| 1518 S Walters St Unit 102 San Antonio, TX | 3.0 | 2.5 | 1180 | $1,400 | $1.19 | 5d | 1 | 0.26mi |
| 1303 Essex St #102 San Antonio, TX | 3.0 | 2.5 | 1180 | $1,400 | $1.19 | 24d | 1 | 0.28mi |
| 147 Vine St San Antonio, TX | 3.0 | 3.0 | 1438 | $1,700 | $1.18 | 24d | 1 | 0.33mi |
| 318 Ferguson Ave Unit 1 San Antonio, TX | 3.0 | 2.0 | 1450 | $1,550 | $1.07 | 5d | 1 | 0.33mi |
| 618 Porter St San Antonio, TX | 1.0 | 1.0 | 1360 | $895 | $0.66 | 5d | 1 | 0.40mi |
| 113 Anderson Ave Unit 101 San Antonio, TX | 3.0 | 2.5 | 1539 | $1,700 | $1.10 | 44d | 1 | 0.44mi |
| 212 Cooper St Unit A San Antonio, TX | 3.0 | 3.0 | 1750 | $1,625 | $0.93 | 44d | 1 | 0.52mi |
| 212 Cooper St Unit A San Antonio, TX | 3.0 | 3.0 | 1750 | $1,550 | $0.89 | 24d | 1 | 0.52mi |
| 2346 Dakota St Unit 1101 San Antonio, TX | 2.0 | 1.0 | 1728 | $1,250 | $0.72 | 17d | 1 | 0.54mi |
| 123 Dilworth St San Antonio, TX | 3.0 | 2.0 | 1384 | $1,900 | $1.37 | 44d | 1 | 0.57mi |
| 314 Maryland St Unit 102 San Antonio, TX | 2.0 | 2.5 | 1055 | $1,295 | $1.23 | 44d | 1 | 0.59mi |
| 113 Dilworth St San Antonio, TX | 3.0 | 3.0 | 1383 | $1,850 | $1.34 | 24d | 1 | 0.59mi |
| 521 S Polaris St San Antonio, TX | 3.0 | 1.0 | 1200 | $1,249 | $1.04 | 5d | 1 | 0.66mi |
| 227 S Grimes St Unit 202 San Antonio, TX | 3.0 | 2.5 | 1089 | $1,550 | $1.42 | 44d | 1 | 0.66mi |
| 1618 Dakota St Unit 102 San Antonio, TX | 3.0 | 2.5 | 1768 | $1,925 | $1.09 | 17d | 1 | 0.69mi |
| 343 Porter St #101 San Antonio, TX | 3.0 | 2.5 | 1600 | $2,100 | $1.31 | 5d | 1 | 0.71mi |
| 136 Nelson Ave San Antonio, TX | 3.0 | 1.0 | 1092 | $1,316 | $1.21 | 44d | 1 | 0.72mi |
| 1827 Montana St #101 San Antonio, TX | 3.0 | 2.5 | 1859 | $2,250 | $1.21 | 2d | 1 | 0.74mi |
| 122 S Walters St San Antonio, TX | 3.0 | 3.0 | 2000 | $2,200 | $1.10 | 44d | 1 | 0.76mi |
| 1138 Iowa St San Antonio, TX | 3.0 | 2.0 | 1505 | $1,650 | $1.10 | 24d | 1 | 0.76mi |
| 610 Belmont San Antonio, TX | 2.0 | 1.0 | 1050 | $1,195 | $1.14 | 44d | 1 | 0.85mi |
| 104 Shenandoah San Antonio, TX | 3.0 | 2.5 | 1580 | $1,925 | $1.22 | 18d | 1 | 0.86mi |
| 1007 Avant Ave San Antonio, TX | 3.0 | 2.0 | 1632 | $3,200 | $1.96 | 24d | 1 | 0.87mi |
| 636 Rigsby Ave San Antonio, TX | 3.0 | 1.0 | 1327 | $1,595 | $1.20 | 44d | 1 | 0.89mi |
| 627 Essex St San Antonio, TX | 3.0 | 2.5 | 1402 | $1,850 | $1.32 | 24d | 1 | 0.93mi |
| 154 Ferris Ave San Antonio, TX | 3.0 | 2.0 | 1438 | $1,275 | $0.89 | 22d | 1 | 0.95mi |
| 154 Ferris Ave San Antonio, TX | 3.0 | 2.0 | 1438 | $1,499 | $1.04 | 44d | 1 | 0.95mi |
| 1221 Delaware St San Antonio, TX | 1.0 | 1.0 | 1300 | $1,200 | $0.92 | 44d | 1 | 0.95mi |
| 210 Utah St #101 San Antonio, TX | 3.0 | 2.5 | 1208 | $1,695 | $1.40 | 44d | 1 | 0.97mi |
| 211 Utah St #601 San Antonio, TX | 2.0 | 2.5 | 1208 | $1,650 | $1.37 | 44d | 1 | 0.97mi |
| 534 Rigsby Ave San Antonio, TX | 3.0 | 2.0 | 1438 | $1,950 | $1.36 | 24d | 1 | 0.99mi |
| 807 Dreiss St San Antonio, TX | 3.0 | 2.0 | 1200 | $2,095 | $1.75 | 24d | 1 | 1.02mi |
| 2107 Schley Ave San Antonio, TX | 3.0 | 2.5 | 1568 | $2,200 | $1.40 | 44d | 1 | 1.02mi |
| 316 Toledo St Unit 102 San Antonio, TX | 2.0 | 2.0 | 1168 | $2,200 | $1.88 | 44d | 1 | 1.02mi |
Listing history 35 events
-
2026-06-18days on market $95,000 Active 221 DOM
-
2026-06-17days on market $95,000 Active 220 DOM
-
2026-06-16days on market $95,000 Active 219 DOM
-
2026-06-15days on market $95,000 Active 218 DOM
-
2026-06-13days on market $95,000 Active 216 DOM
-
2026-06-09days on market $95,000 Active 212 DOM
-
2026-06-08days on market $95,000 Active 211 DOM
-
2026-06-07days on market $95,000 Active 210 DOM
-
2026-06-04days on market $95,000 Active 207 DOM
-
2026-06-03days on market $95,000 Active 206 DOM
-
2026-06-02days on market $95,000 Active 205 DOM
-
2026-06-01days on market $95,000 Active 204 DOM
-
2026-05-31days on market $95,000 Active 203 DOM
-
2026-01-11price $95,000 496-char remark
Show marketing remark (496 chars)
Imagine the possibilities! Whether you’re seeking a comfortable living space or a functional office, this 1,512 sq. ft. property offers incredible potential. Situated on a generous lot, the fully gated 3-bedroom, 2-bath home features a dining and living room combination, a spacious kitchen equipped with a microwave, dishwasher, and gas range, plus an in-home utility room. Additional highlights include a versatile flex room/office and ADA accessibility with a convenient wheelchair ramp.
-
2026-01-11status Active 496-char remark
Show marketing remark (496 chars)
Imagine the possibilities! Whether you’re seeking a comfortable living space or a functional office, this 1,512 sq. ft. property offers incredible potential. Situated on a generous lot, the fully gated 3-bedroom, 2-bath home features a dining and living room combination, a spacious kitchen equipped with a microwave, dishwasher, and gas range, plus an in-home utility room. Additional highlights include a versatile flex room/office and ADA accessibility with a convenient wheelchair ramp.
-
2025-11-14status Pending 496-char remark
Show marketing remark (496 chars)
Imagine the possibilities! Whether you’re seeking a comfortable living space or a functional office, this 1,512 sq. ft. property offers incredible potential. Situated on a generous lot, the fully gated 3-bedroom, 2-bath home features a dining and living room combination, a spacious kitchen equipped with a microwave, dishwasher, and gas range, plus an in-home utility room. Additional highlights include a versatile flex room/office and ADA accessibility with a convenient wheelchair ramp.
-
2025-11-06status Pending 496-char remark
Show marketing remark (496 chars)
Imagine the possibilities! Whether you’re seeking a comfortable living space or a functional office, this 1,512 sq. ft. property offers incredible potential. Situated on a generous lot, the fully gated 3-bedroom, 2-bath home features a dining and living room combination, a spacious kitchen equipped with a microwave, dishwasher, and gas range, plus an in-home utility room. Additional highlights include a versatile flex room/office and ADA accessibility with a convenient wheelchair ramp.
-
2025-09-27price $109,000 496-char remark
Show marketing remark (496 chars)
Imagine the possibilities! Whether you’re seeking a comfortable living space or a functional office, this 1,512 sq. ft. property offers incredible potential. Situated on a generous lot, the fully gated 3-bedroom, 2-bath home features a dining and living room combination, a spacious kitchen equipped with a microwave, dishwasher, and gas range, plus an in-home utility room. Additional highlights include a versatile flex room/office and ADA accessibility with a convenient wheelchair ramp.
-
2025-09-11$119,000 Active 496-char remark
Show marketing remark (496 chars)
Imagine the possibilities! Whether you’re seeking a comfortable living space or a functional office, this 1,512 sq. ft. property offers incredible potential. Situated on a generous lot, the fully gated 3-bedroom, 2-bath home features a dining and living room combination, a spacious kitchen equipped with a microwave, dishwasher, and gas range, plus an in-home utility room. Additional highlights include a versatile flex room/office and ADA accessibility with a convenient wheelchair ramp.
-
2025-06-24status Pending
-
2025-06-09status Pending
-
2025-05-22historical
-
2025-05-14price $109,000
-
2025-05-13status Active
-
2025-05-09status Pending
-
2025-05-02status Option Pending
-
2025-03-04price $149,000
-
2025-02-16$199,000 Active
-
2024-09-12status Pending
-
2024-09-02historical Active Option
-
2024-09-01historical
-
2024-07-22price $170,000
-
2024-05-30price $210,000
-
2024-05-05price $240,000
-
2024-04-13$340,000 New
ⓘ Source: listings_history table (triggers on properties + properties_extension) + one-shot
backfill from property_details.listing_events for pre-trigger history.
Climate risk First Street
- Flood 1/10 Low FEMA zone X (unshaded) · 0% chance over 30 yrs
- Wildfire 1/10 Low
- Heat 8/10 Severe 5 d/yr ≥108°F today · 16 d/yr by 30 yrs out
- Wind 8/10 Severe 80% chance of damaging wind over 30 yrs
- Air quality 2/10 Low 1 unhealthy d/yr today · 2 by 30 yrs out
Nearby sold comps map
Loading sold comps map…
Walkable amenities ~0.75 mi
Loading nearby amenities…
Taxation est. · year 1
- Rental income
- $18,174
- − Mortgage interest
- −$5,321
- − Property taxes
- −$1,425
- − Insurance
- −$475
- − Repairs & maintenance
- −$1,454
- − Management
- −$1,454
- − Depreciation
- −$2,764
- Taxable income
- $5,281
- Est. tax owed @ 24.0%
- −$1,267
- After-tax cash flow
- $5,211/yr
For passive investors: Depreciation is non-cash, so a rental often shows a tax loss while cash-flowing — sheltering income. Rental losses are passive: they offset passive income freely, and up to $25,000/yr can offset ordinary (W-2) income if you actively participate and your MAGI is under $100k (phasing out to $0 by $150k); unused losses carry forward. On sale, claimed depreciation is recaptured at up to 25%, and gains may owe capital-gains tax (a 1031 exchange can defer both). Figures are a year-1 estimate at your 24.0% rate — not tax advice; consult a CPA.
Schools (NCES district)
- District
- San Antonio ISD
- NCES district ID
- 4838730
- Math proficiency
- 12% ▼ -21.00%
- Reading proficiency
- 22% ▼ -7.00%
- Median HH income
- $30,952
- Composite
- 13.57/100
- National rank
- #9512
- State rank
- #805 of 826 in TX
Livability — San Antonio
- Score
- 80/100
- State rank
- #31
- US rank
- #1616
Category grades
Schools grade is shown separately in the Schools card above.
Census & demographics
- Census place
- San Antonio, TX
- County
- Bexar County · 1,990,555 people
- City population
- 1,806,925
- Metro
- San Antonio-New Braunfels, TX
- Population (ZIP)
- 34,940
- Household income
- $55,028
- Rent vs Own
- Severe rent burden
- 1708.0
Population outlook (Bexar County) Hauer SSP2
- Today (2025)
- 2,336,851 people
- By 2030
- 2,560,728 · +9.6%
- By 2040
- 3,020,569 · +29.3%
- By 2050
- 3,493,522 · +49.5%
- By 2075
- 4,668,459 · +99.8%
- By 2100
- 5,533,242 · +136.8%
Race, ethnicity, and origin ACS 2023
- Neighborhood character
- Predominantly Hispanic (83%)
- Race & ethnicity
- Hispanic / Latino 83% Two or more races 29% White 11% Black 4% Native American 2%
- Hispanic origin (detail)
- Mexican 72% Puerto Rican 2%
- Common ancestry
- Lithuanian 1%
- Foreign-born
- 12% · Canada
- Languages at home
- 55% English-only · Spanish 44%
Political lean MEDSL · Bexar
- 2024 margin
- Lean D (+9.8) · D 54.3% · R 44.6% · Other 1.1%
- 2008→2024 swing
- +4.2pp toward D · 2008: 5.6pp · 2024: 9.8pp
- All cycles
- 2024: D+9.8 2020: D+18.2 2016: D+13.5 2012: D+4.6 2008: D+5.6
Not yet ingested
- Civics
- —
Market trends
- HPI YoY
- ▼ -163.42%
- Current HPI
- 286.299
- Rent YoY
- ▲ 1.07%
- Metro
- San Antonio-New Braunfels, TX
- State GDP YoY
- ▲ 3.95%
- F500 in state
- 110
Industry mix (Fortune 500 HQ in TX)
| Industry | F500 HQs | Revenue |
|---|---|---|
| Energy | 16 | $1,198B |
|
||
| Technology | 5 | $198B |
|
||
| Engineering / Construction | 4 | $72B |
|
||
| Energy Services | 3 | $60B |
|
||
| Utilities | 3 | $41B |
|
||
| Healthcare | 2 | $330B |
|
||
Price history
-72.1% since first listed22 events — show timeline
- 2026-01-11 Price Changed $95,000 HARMLS
- 2026-01-11 Relisted — HARMLS
- 2025-11-14 Pending — HARMLS
- 2025-11-06 Pending — HARMLS
- 2025-09-27 Price Changed $109,000 HARMLS
- 2025-09-11 Listed $119,000 HARMLS
- 2025-06-24 Pending — HARMLS
- 2025-06-09 Pending — HARMLS
- 2025-05-22 Listing Removed — HARMLS
- 2025-05-14 Price Changed $109,000 HARMLS
- 2025-05-13 Relisted — HARMLS
- 2025-05-09 Pending — HARMLS
- 2025-05-02 Pending — HARMLS
- 2025-03-04 Price Changed $149,000 HARMLS
- 2025-02-16 Listed $199,000 HARMLS
- 2024-09-12 Pending — LERA
- 2024-09-02 Contingent — LERA
- 2024-09-01 Listing Removed — LERA
- 2024-07-22 Price Changed $170,000 LERA
- 2024-05-30 Price Changed $210,000 LERA
- 2024-05-05 Price Changed $240,000 LERA
- 2024-04-13 Listed $340,000 LERA
Property tax history
+12.8%/yrLatest (2025): $4,853 · +56.7% YoY. Source: county tax records.
Cash-flow waterfall
monthlySold comps — $/sqft
last 12 mo · ≤1 miLoading sold comps…