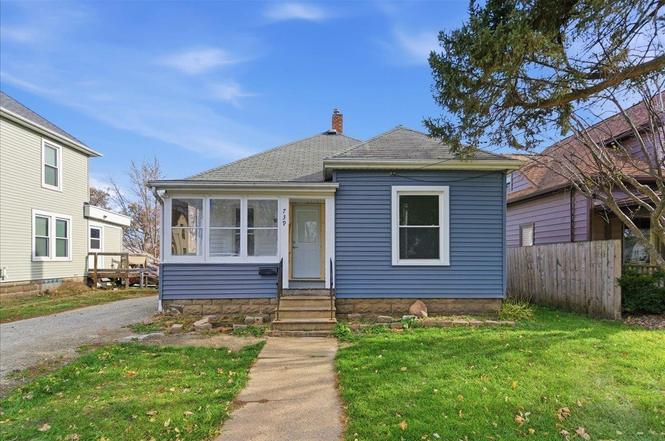
739 W 11th St · Waterloo, IA
Flood risk 1/10 · Minimal
- FEMA flood zone
- X (unshaded)
- Chance of flooding over 30 yrs
- 0.0%
- Est. flood insurance / yr
- $473 – $860
Fire risk 1/10 · Minimal
- Est. fire insurance / yr
- $902 – $1,676
Heat risk 3/10 · Minor
- Hot days now (above 101°F)
- 7 days/yr
- Hot days in 30 yrs
- 16 days/yr
Wind risk 2/10 · Minimal
- Chance of severe wind over 30 yrs
- —
Air-quality risk 1/10 · Minimal
- Unhealthy air days now
- 0 days/yr
- Unhealthy air days in 30 yrs
- 0 days/yr
Risk factors via First Street. Map © Google.
Why this score? — see what drove the C+ grade
The composite is a weighted blend of 9 inputs, each scored 0–100. Each bar is that input's sub-score; the figure is the points it added to the 100-point composite (weight × sub-score).
- Cash flow +19.6/30.0
- ARV discount +15.0/15.0
- DSCR +6.2/10.0
- 1% rule +5.5/10.0
- Schools +4.4/10.0
- Livability +4.0/5.0
- Rent growth +3.2/5.0
- Condition / age +2.5/5.0
- Appreciation +0.0/10.0
$89,900
🖨 Deal sheet 📄 Offer letter ✓ Due diligence
Listing remarks
You don't want to miss this charming 3 bedroom, 1 bathroom home, boasting many new updates. As soon as you walk through the front door into the well-lit living room, you will notice all new paint and flooring throughout. All three bedrooms are conveniently located on the main level along with an updated full bathroom. The large dining room is right off of the updated kitchen offering new appliances. The unfinished basement is perfect for storage and laundry, with potential to finish. In the warmer months you will enjoy your front porch. Situated on a . 3 acre lot, you are sure to love the deep back yard. Schedule your showing today and see all this home has to offer!
Key facts
- Well-lit living room
- Deep back yard
- Unfinished basement
Tags
Neighborhood map
What this means for you Summary
Snapshot
- This is a 3-bed/1.0-bath single-family listed at $90k.
Deal economics
- At list price, monthly cash flow is $103 ($1k/yr) — positive.
- The deal already cash-flows at list — no discount required.
- Meets the 1% rule at list price ($940 rent vs $90k).
- Recommended offer: $79k (12.0% below list) — sets the bar for market timing.
- Cap rate 7.7% vs local median 4.2% in Waterloo — top-decile yield for the area; either an underpriced asset or a hidden risk that comps aren't pricing in. Stress-test before assuming the spread holds.
Location & tenants
- Location reads 81/100 on livability (#74 in IA, #1,589 nationally) — a professional / high-income tenant draw. Strengths: commute A+, cost of living A+, housing A+; Watch: crime F, employment D-.
- Waterloo Community School District (urban): math 50% / reading 54% proficiency, ranked #276 of 289 in IA (top 96%) — acceptable for families but not a draw, mixed tenant base, ~2y average lease.
- Zoned schools: Lowell Elementary School (math 42% / reading 42%, grade F, #563 of 616 statewide, top 93%, 513 students, 74% FRL); West High School (math 55% / reading 63%, grade C+, #273 of 336 statewide, top 81%, 1,652 students, 62% FRL).
- Market conditions: Rents rising (+2.7%/yr); 126 active listings in the ZIP; 40 comparable units currently listed for rent nearby; rentals at typical pace (median 21d on market — plan ~3-4 weeks tenant-placement turnaround); 48% of comp listings sitting > 30 days — soft ceiling on asking rent; 287 units permitted in Black Hawk County in 2024 (67 in 5+ unit buildings).
Forward outlook
- Local home prices are declining (-3.0%/yr); year-one equity from $622 of loan paydown is wiped out by about $3k of value loss. Plan a longer hold.
- Black Hawk County population projected at +10% by 2050 — modest demand growth; plan on rents tracking national, not racing it.
Negotiation context
- It's been on market 133 days — a 12% lower offer ($79k) is reasonable based on typical stale-listing flexibility.
Risks & watch-outs
- Watch-outs: built in 1896 — expect roof / HVAC / electrical / plumbing capex.
Questions for the listing agent
- It's been on market 133 days. Have you received any prior offers? Is the seller open to a 12% concession, seller financing, or rate buy-down credit?
- Built in 1896 — when were the roof, HVAC, electrical panel, plumbing, and water heater last replaced?
- Why hasn't it sold? Are there any deal-killer items the seller is aware of (foundation, flood, title, zoning, code violations)?
- Is there a deadline driving the sale (1031 exchange, divorce, estate, relocation)? That informs how much negotiation room exists.
- Crime grade is F in this area — have there been break-ins, vandalism, or insurance claims at this property in the last 3 years? What carrier currently insures it and at what premium?
- What's the average days-on-market for RENTAL listings here right now (not sales)? A rising rental-DOM trend means longer vacancies and softer asking-rent achievability than the comps imply.
- What's the recent tenant-quality profile in this submarket — average credit score on applications, eviction rate, late-payment / NSF rate, and stable-employment percentage? A property-management company in the area should have these aggregated.
- How much new for-sale + rental construction is in the pipeline within 1–3 miles? Heavy new supply typically softens prices + rents 12–24 months out; constrained supply supports both.
Investment metrics
- 1% rule
- 1.05% ✓
- Cap rate
- 7.67%
- Cash-on-cash
- 4.92%
- DSCR
- 1.22
- GRM
- 8.0
CMA / ARV
- ARV (on-the-fly)
- $118,992
- Comps found
- 12
Show comp detail 12 sales within ~0.75 mi
| Address | Dist | Beds/Ba | Sqft | Sold | Price | $/sf | Match |
|---|---|---|---|---|---|---|---|
| 739 W 11th St | 0.00mi | 3/1.0 | 888 (0%) | 1mo | $85,000 | $96 | 99 |
| 1648 Glenny Ave | 0.42mi | 2/1.0 (-1) | 864 (-3%) | 1mo | $220,000 | $255 | 70 |
| 649 W 11th St | 0.12mi | 3/1.0 | 996 (+12%) | 5mo | $68,000 | $68 | 70 |
| 1017 Forest Ave | 0.46mi | 2/1.0 (-1) | 868 (-2%) | 1mo | $110,000 | $127 | 69 |
| 2003 Randolph St | 0.41mi | 2/1.0 (-1) | 932 (+5%) | 6mo | $125,000 | $134 | 62 |
| 1212 Byron Ave | 0.40mi | 2/1.0 (-1) | 819 (-8%) | 6mo | $116,425 | $142 | 58 |
| 620 W 7th St | 0.48mi | 3/1.0 | 960 (+8%) | 8mo | $58,000 | $60 | 57 |
| 929 Randolph St | 0.40mi | 3/2.0 | 792 (-11%) | 3mo | $130,000 | $164 | 56 |
| 1847 Forest Ave | 0.46mi | 2/1.0 (-1) | 968 (+9%) | 5mo | $145,000 | $150 | 55 |
| 826 Williston Ave | 0.60mi | 3/1.0 | 976 (+10%) | 1mo | $72,000 | $74 | 54 |
| 1201 Lyon Ave | 0.55mi | 2/1.0 (-1) | 768 (-14%) | 6mo | $155,000 | $202 | 42 |
| 2527 Randolph St St | 0.75mi | 2/1.0 (-1) | 786 (-12%) | 3mo | $79,000 | $101 | 39 |
Match score weights: distance 35% · size 25% · config 20% · recency 20%. Top-matched comps best support the ARV.
Projected returns pro-forma
-3.0% appreciation · 2.7% rent growth · sell at horizon
- IRR
- -9.0%
- Equity multiple
- 0.67×
- Total profit
- $-8,257
- Equity at exit
- $13,404
- IRR
- 0.1%
- Equity multiple
- 1.01×
- Total profit
- $216
- Equity at exit
- $7,773
Cash invested: $25,172 (down + closing). Projections, not guarantees.
Landlord ↔ Tenant lean methodology
- Overall (STATE)
- 83 Strongly Landlord-Friendly
- State Iowa
- 83 Strongly Landlord-Friendly · R+6
- County
- — inherits STATE
- City
- — inherits STATE
ZIP-level market 50702
- Rents YoY
- 2.7%
- Active inventory
- 126
- Price-to-rent
- 8.0×
Monthly cashflow live
- Estimated rent
- $940 high interval (Pro) →
- Mortgage (P&I)
- −$471
- Tax from tax record
- −$130 /mo · $1,566/yr
- Insurance
- −$37
- HOA
- −$0
- Vacancy / Maint / Mgmt
- −$197
- Net cashflow
- $103
Break-even live
UW: 25.0% down · 7.5% · 30yr · 1.5% tax · 5.0% vac · 8.0% maint · 8.0% mgmt
Financing live
Cash to close
- Down payment
- $22,475
- Closing costs
- $2,697
- Reserves months
- —
- Total cash needed
- —
Loan-product check · same deal, 3 products live
Conventional
25% down · 7.5% · 30yr
- Down + closing
- —
- Monthly P&I
- —
- Monthly cashflow
- —
- DSCR
- —
- Eligible?
- —
Personal DTI + credit; lowest rate.
DSCR
20% down · 8.5% · 30yr
- Down + closing
- —
- Monthly P&I
- —
- Monthly cashflow
- —
- DSCR
- —
- Eligible?
- —
No personal income docs; deal must DSCR.
Hard money
10% down · 12.0% · 12mo
- Down + closing
- —
- Monthly P&I
- —
- Monthly cashflow
- —
- DSCR
- —
- Eligible?
- —
Short-term bridge; refi at stabilization.
Rent comps 40 comps
| Address | Beds | Baths | Sqft | Rent | $/sqft | DOM | Units | Dist |
|---|---|---|---|---|---|---|---|---|
| 1014 Leavitt St Waterloo, IA | 2.0 | 1.0 | 700 | $1,060 | $1.51 | 21d | 2 | 0.41mi |
| 1008 Leavitt St Waterloo, IA | 2.0 | 1.0 | 700 | $920 | $1.31 | 21d | 1 | 0.43mi |
| 611 Johnson St Unit 8 Waterloo, IA | 2.0 | 1.0 | 800 | $825 | $1.03 | 43d | 1 | 0.44mi |
| 611 Johnson St Unit 11 Waterloo, IA | 2.0 | 1.0 | 800 | $895 | $1.12 | 43d | 1 | 0.44mi |
| 1112 Byron Ave Unit 1114 Waterloo, IA | 2.0 | 1.0 | 896 | $930 | $1.04 | 21d | 1 | 0.45mi |
| 706 South St Unit B Waterloo, IA | 2.0 | 1.0 | 750 | $635 | $0.85 | 21d | 1 | 0.61mi |
| 706 South St Waterloo, IA | 2.0 | 1.0 | 750 | $675 | $0.90 | 43d | 1 | 0.61mi |
| 924 Sycamore St #1 Waterloo, IA | 2.0 | 2.0 | 1054 | $1,250 | $1.19 | 43d | 1 | 0.77mi |
| 920-928 Sycamore St Unit 920-07 Waterloo, IA | 2.0 | 2.0 | 1054 | $1,250 | $1.19 | 43d | 1 | 0.80mi |
| 824 Sycamore St Unit 824-09 Waterloo, IA | 2.0 | 2.0 | 1054 | $1,250 | $1.19 | 43d | 1 | 0.81mi |
| 820 W 2nd St Apt 2 Waterloo, IA | 2.0 | 1.5 | 1100 | $695 | $0.63 | 43d | 1 | 0.93mi |
| 1524 1/2 W 5th St Unit 1524 1/2 Waterloo, IA | 2.0 | 1.0 | 981 | $850 | $0.87 | 21d | 1 | 0.94mi |
| 910 Mulberry St Apt 3 Waterloo, IA | 2.0 | 1.0 | 1064 | $695 | $0.65 | 21d | 1 | 0.95mi |
| 408 E 8th St Waterloo, IA | 3.0 | 1.0 | 600 | $850 | $1.42 | 43d | 1 | 0.95mi |
| 237 Miriam Dr Apt B Waterloo, IA | 2.0 | 1.0 | 750 | $725 | $0.97 | 43d | 1 | 1.01mi |
| 226 Palmer Dr Unit 226-B Waterloo, IA | 2.0 | 1.0 | 800 | $780 | $0.97 | 21d | 1 | 1.02mi |
| 313 Denver St Unit Downstairs Waterloo, IA | 2.0 | 1.5 | 950 | $695 | $0.73 | 21d | 1 | 1.02mi |
| 200 Parkview Blvd Waterloo, IA | 2.0 | 1.0 | 744 | $725 | $0.97 | 21d | 1 | 1.02mi |
| 254 Parkview Blvd Unit 254 Waterloo, IA | 2.0 | 1.0 | 744 | $795 | $1.07 | 43d | 1 | 1.03mi |
| 225 Miriam Dr Unit A Waterloo, IA | 2.0 | 1.0 | 700 | $650 | $0.93 | 43d | 1 | 1.03mi |
| 520 Lafayette St Unit A Waterloo, IA | 2.0 | 1.0 | 800 | $750 | $0.94 | 43d | 1 | 1.05mi |
| W Mullan Ave Waterloo, IA | 2.0 | 1.0 | 918 | $710 | $0.77 | 43d | 2 | 1.07mi |
| 2006 Lafayette St Waterloo, IA | 2.0 | 1.0 | 576 | $650 | $1.13 | 21d | 1 | 1.08mi |
| 1047 Langley Rd Waterloo, IA | 2.0 | 1.0 | 951 | $795 | $0.84 | 21d | 1 | 1.16mi |
| 1211 Langley Rd Waterloo, IA | 2.0 | 1.0 | 951 | $825 | $0.87 | 21d | 1 | 1.17mi |
| 45 W Jefferson St Waterloo, IA | 1.0–2.0 | 1.0–2.0 | 1062 | $1,750 | $1.65 | 21d | 9 | 1.17mi |
| 1225 Langley Rd Waterloo, IA | 2.0 | 1.0 | 989 | $795 | $0.80 | 21d | 1 | 1.18mi |
| 1154-1206 Langley Rd Waterloo, IA | 2.0 | 1.0 | 813 | $750 | $0.92 | 21d | 1 | 1.20mi |
| 1254 W Mullan Ave Unit 1254 Waterloo, IA | 2.0 | 1.0 | 864 | $775 | $0.90 | 21d | 1 | 1.26mi |
| 1272 W Mullan Ave Unit 1272 Waterloo, IA | 2.0 | 1.0 | 864 | $825 | $0.95 | 21d | 1 | 1.26mi |
| 2304 Lafayette St Waterloo, IA | 2.0 | 1.0 | 971 | $825 | $0.85 | 43d | 1 | 1.27mi |
| 425 Glenwood St Waterloo, IA | 2.0 | 1.0 | 846 | $825 | $0.98 | 21d | 1 | 1.27mi |
| 333 Lamont St Waterloo, IA | 2.0 | 1.0 | 720 | $975 | $1.35 | 43d | 1 | 1.29mi |
| 303 Franklin St Apt 2 Waterloo, IA | 2.0 | 1.0 | 600 | $650 | $1.08 | 43d | 1 | 1.30mi |
| 154 Acadia St Unit 2 Waterloo, IA | 2.0 | 1.0 | 995 | $1,200 | $1.21 | 43d | 1 | 1.39mi |
| 823 Glenwood St Waterloo, IA | 2.0 | 1.0 | 999 | $895 | $0.90 | 43d | 1 | 1.45mi |
| 1319 Ravenwood Rd #3 Waterloo, IA | 2.0 | 1.0 | 857 | $825 | $0.96 | 21d | 1 | 1.45mi |
| 105 Bellaire Rd Waterloo, IA | 2.0 | 2.0 | 1088 | $1,100 | $1.01 | 21d | 1 | 1.46mi |
| 1229 Ravenwood Rd Unit 1237-1 Waterloo, IA | 2.0 | 1.0 | 960 | $900 | $0.94 | 43d | 1 | 1.47mi |
| 230 Polk St Waterloo, IA | 3.0 | 1.0 | 992 | $850 | $0.86 | 21d | 1 | 1.48mi |
Listing history 6 events
-
2026-04-01status Pending
-
2026-03-20price $89,900
-
2026-02-02price $95,000
-
2026-01-02price $99,000
-
2025-11-24price $109,000
-
2025-11-19$119,000 Active
ⓘ Source: listings_history table (triggers on properties + properties_extension) + one-shot
backfill from property_details.listing_events for pre-trigger history.
Tax reassessment forecast IA · Partial reset (capped growth)
- Current annual tax
- $1,566 · $130/mo
- Projected year-2 tax
- $1,566 · $130/mo
- Expected delta
- $0/yr ($0/mo · 0.0%)
ⓘ Screening estimate from a state-policy table — verify with the county assessor before closing.
Climate risk First Street
- Flood 1/10 Low FEMA zone X (unshaded) · 0% chance over 30 yrs
- Wildfire 1/10 Low
- Heat 3/10 Moderate 7 d/yr ≥101°F today · 16 d/yr by 30 yrs out
- Wind 2/10 Low
- Air quality 1/10 Low 0 unhealthy d/yr today · 0 by 30 yrs out
Nearby sold comps map
Loading sold comps map…
Walkable amenities ~0.75 mi
Loading nearby amenities…
Taxation est. · year 1
- Rental income
- $11,279
- − Mortgage interest
- −$5,036
- − Property taxes
- −$1,566
- − Insurance
- −$450
- − Repairs & maintenance
- −$902
- − Management
- −$902
- − Depreciation
- −$2,615
- Taxable loss
- −$192
- Est. tax savings @ 24.0%
- +$46
- After-tax cash flow
- $1,284/yr
For passive investors: Depreciation is non-cash, so a rental often shows a tax loss while cash-flowing — sheltering income. Rental losses are passive: they offset passive income freely, and up to $25,000/yr can offset ordinary (W-2) income if you actively participate and your MAGI is under $100k (phasing out to $0 by $150k); unused losses carry forward. On sale, claimed depreciation is recaptured at up to 25%, and gains may owe capital-gains tax (a 1031 exchange can defer both). Figures are a year-1 estimate at your 24.0% rate — not tax advice; consult a CPA.
Schools (NCES district)
- District
- Waterloo Community School District
- NCES district ID
- 1930480
- Math proficiency
- 50% ▼ -4.00%
- Reading proficiency
- 54% ▲ 1.00%
- Median HH income
- $42,545
- Composite
- 43.72/100
- National rank
- #2950
- State rank
- #276 of 289 in IA
Livability — Waterloo
- Score
- 81/100
- State rank
- #74
- US rank
- #1589
Category grades
Schools grade is shown separately in the Schools card above.
Census & demographics
- Census place
- Waterloo, IA
- County
- Black Hawk County · 112,933 people
- City population
- 69,066
- Metro
- Waterloo-Cedar Falls, IA
- Population (ZIP)
- 20,882
- Household income
- $62,021
- Rent vs Own
- Severe rent burden
- 479.0
Population outlook (Black Hawk County) Hauer SSP2
- Today (2025)
- 139,716 people
- By 2030
- 142,853 · +2.2%
- By 2040
- 147,843 · +5.8%
- By 2050
- 153,247 · +9.7%
- By 2075
- 167,977 · +20.2%
- By 2100
- 177,320 · +26.9%
Race, ethnicity, and origin ACS 2023
- Neighborhood character
- Predominantly White (68%)
- Race & ethnicity
- White 68% Black 14% Hispanic / Latino 9% Two or more races 5% Asian 3% Pacific Islander 3% Native American 1%
- Hispanic origin (detail)
- Mexican 6% Puerto Rican 1%
- Common ancestry
- American 5% Portuguese 3% Lithuanian 2%
- Foreign-born
- 15% · Canada, Philippines
- Languages at home
- 79% English-only · Spanish 7% Russian/Polish/Slavic 6% Other Asian/Pacific 4%
Political lean MEDSL · Black Hawk
- 2024 margin
- Toss-up / Even · D 50.0% · R 48.8% · Other 1.2%
- 2008→2024 swing
- -21.3pp toward R · 2008: 22.4pp · 2024: 1.2pp
- All cycles
- 2024: D+1.2 2020: D+9.0 2016: D+7.3 2012: D+20.0 2008: D+22.4
Not yet ingested
- Civics
- —
Market trends
- HPI YoY
- ▼ -110.86%
- Current HPI
- 155.4447
- Rent YoY
- ▲ 2.70%
- Metro
- Waterloo-Cedar Falls, IA
- State GDP YoY
- ▲ 2.48%
- F500 in state
- 4
Industry mix (Fortune 500 HQ in IA)
| Industry | F500 HQs | Revenue |
|---|---|---|
| Financial Services | 1 | $16B |
|
||
| Retail / Convenience | 1 | $15B |
|
||
Price history
-24.5% since first listed6 events — show timeline
- 2026-04-01 Pending — NEIRBR as distributed by MLS GRID
- 2026-03-20 Price Changed $89,900 NEIRBR as distributed by MLS GRID
- 2026-02-02 Price Changed $95,000 NEIRBR as distributed by MLS GRID
- 2026-01-02 Price Changed $99,000 NEIRBR as distributed by MLS GRID
- 2025-11-24 Price Changed $109,000 NEIRBR as distributed by MLS GRID
- 2025-11-19 Listed $119,000 NEIRBR as distributed by MLS GRID
Property tax history
+3.8%/yrLatest (2025): $1,566 · +8.6% YoY. Source: county tax records.
Cash-flow waterfall
monthlySold comps — $/sqft
last 12 mo · ≤1 miLoading sold comps…