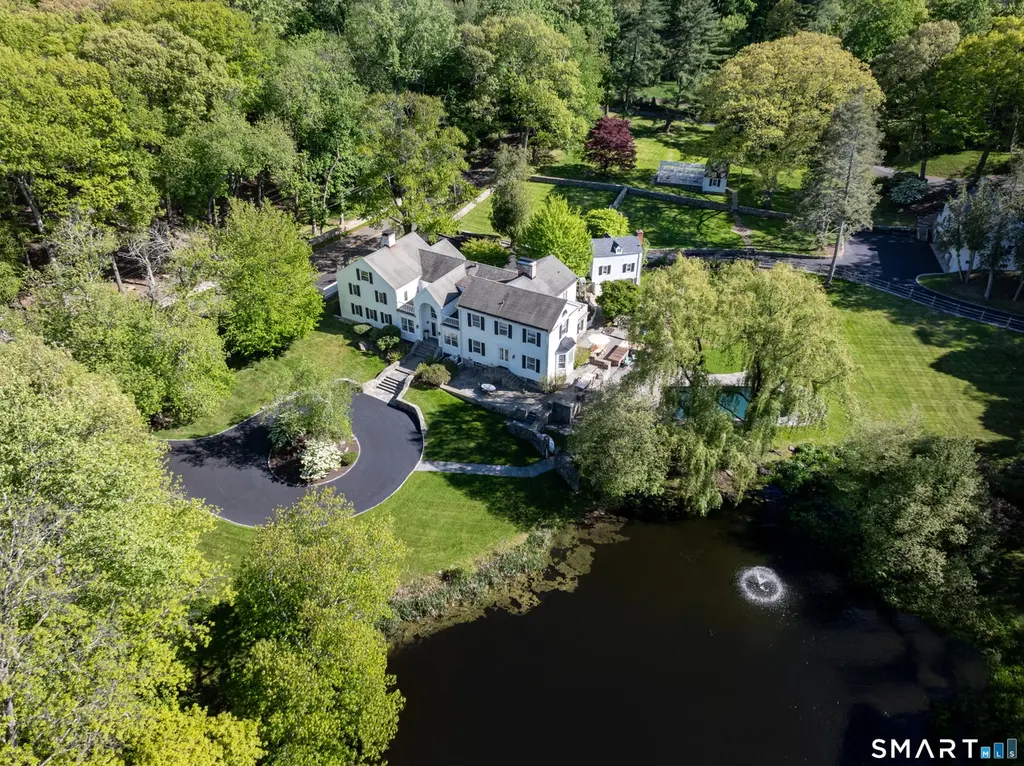
351 Erskine Rd · Stamford, CT
Flood risk 6/10 · Moderate
- FEMA flood zone
- X (unshaded)
- Chance of flooding over 30 yrs
- 0.74%
- Est. flood insurance / yr
- $507 – $1,088
Fire risk 4/10 · Minor
- Est. fire insurance / yr
- $829 – $1,539
Heat risk 5/10 · Moderate
- Hot days now (above 99°F)
- 7 days/yr
- Hot days in 30 yrs
- 16 days/yr
Wind risk 6/10 · Moderate
- Chance of severe wind over 30 yrs
- 27.0%
Air-quality risk 4/10 · Minor
- Unhealthy air days now
- 5 days/yr
- Unhealthy air days in 30 yrs
- 7 days/yr
Risk factors via First Street. Map © Google.
Why this score? — see what drove the C- grade
The composite is a weighted blend of 9 inputs, each scored 0–100. Each bar is that input's sub-score; the figure is the points it added to the 100-point composite (weight × sub-score).
- Cash flow +22.5/30.0
- ARV discount +7.5/15.0
- DSCR +7.2/10.0
- 1% rule +5.1/10.0
- Schools +3.5/10.0
- Livability +3.5/5.0
- Rent growth +2.5/5.0
- Condition / age +2.5/5.0
- Appreciation +0.0/10.0
$3,400,000
🖨 Deal sheet (PDF) 📄 Offer letter ✓ Due diligence
Listing remarks MLS
Light Airy Classic Estate With Beautiful Stone Walls And Gardens Completely Refurbished On 2.7 Exquisite Acres In Estate Area Of North Stamford. Charming Guest Cottage Plus Bedroom Carriage House With 4 Car Garage, Greenhouse & Pool.
Key facts
- 2.7 acre lot
- 4 garage spots
- Pool
Property features AI
Exterior
- Parking: Detached garage; Four-car garage; Circular driveway
- Utilities: Private well; Septic system; Oil-fired hot water (domestic); Hydro air, radiant and zoned heat (oil fuel); fuel tank in basement
- Home design: Single-family home; Direct waterfront access; White exterior
- Construction: Frame, stone and concrete construction; Clapboard and wood siding; Asphalt shingle roof; Concrete and stone foundation
- Exterior features: Balcony; Deck; Garden area; Guest house; Stone wall; French doors; Patio; Heated in-ground swimming pool; Lightly wooded, level lot with water view and pond access
Interior
- Kitchen: Gas range; Range hood; Sub-Zero refrigerator; Dishwasher
- Bedrooms: Six bedrooms
- Bathrooms: Six full bathrooms; Three half bathrooms
- Interior features: Auto garage door opener; Security system; Six fireplaces; Full heated basement with storage, interior access, partially finished areas and walk-out; Attic with walk-up storage
- Laundry & utility: Washer; Dryer; Laundry room on lower level
Neighborhood map
What this means for you Summary
Snapshot
- This is a 6-bed/7.5-bath other listed at $3.40M.
Deal economics
- At list price, monthly cash flow is $6k ($68k/yr) — positive.
- The deal already cash-flows at list — no discount required.
- Meets the 1% rule at list price ($34k rent vs $3.40M).
- Cap rate 8.3% vs local median 3.0% in Stamford — top-decile yield for the area; either an underpriced asset or a hidden risk that comps aren't pricing in. Stress-test before assuming the spread holds.
Location & tenants
- Location reads 70/100 on livability (#98 in CT) — a middle-class / working-renter tenant base. Strengths: employment A+, health & safety A+, crime A-; Watch: amenities F, commute F, cost of living F.
- Stamford School District (urban): math 32% / reading 43% proficiency, ranked #103 of 153 in CT (top 67%) — families likely to look elsewhere, expect single-tenant / working-renter base with shorter leases.
- Zoned schools: Roxbury School (math 33% / reading 33%, grade F, #354 of 553 statewide, top 64%, 562 students, 53% FRL); Westhill High School (math 33% / reading 50%, grade F, #102 of 194 statewide, top 53%, 2,265 students, 50% FRL).
- Market conditions: 73 active listings in the ZIP; 2 comparable units currently listed for rent nearby; 1,151 units permitted in Western Connecticut Planning Region in 2024 (714 in 5+ unit buildings).
Forward outlook
- Local home prices are declining (-3.0%/yr); year-one equity from $24k of loan paydown is wiped out by about $102k of value loss. Plan a longer hold.
Negotiation context
- Only 14 days on market — expect competitive offers; lowballing is unlikely to land.
- 11 sale attempts since 32y ago; this cycle's ask is 74% above the opening price — seller raised mid-cycle; expect resistance to lowballs.
- Current owner paid $1.98M; list at $3.40M implies a 72% gain — meaningful room to come down on a strong offer.
Risks & watch-outs
- Watch-outs: built in 1780 — expect roof / HVAC / electrical / plumbing capex.
- Climate carrying-cost: major flood risk; major wind risk, 27% chance of damaging wind over 30y; extreme-heat days projected 7→16/yr by 2055 (HVAC capex compounding) — expect insurance premiums to compound above CPI over the hold.
Questions for the listing agent
- Built in 1780 — when were the roof, HVAC, electrical panel, plumbing, and water heater last replaced?
- Is there a deadline driving the sale (1031 exchange, divorce, estate, relocation)? That informs how much negotiation room exists.
- Schools are B-rated — typically a magnet for longer-tenancy family renters. What's the average tenant stay here, and is there a school-zone premium baked into asking?
- What's the average days-on-market for RENTAL listings here right now (not sales)? A rising rental-DOM trend means longer vacancies and softer asking-rent achievability than the comps imply.
- What's the recent tenant-quality profile in this submarket — average credit score on applications, eviction rate, late-payment / NSF rate, and stable-employment percentage? A property-management company in the area should have these aggregated.
- How much new for-sale + rental construction is in the pipeline within 1–3 miles? Heavy new supply typically softens prices + rents 12–24 months out; constrained supply supports both.
Investment metrics
- 1% rule
- 1.01% ✓
- Cap rate
- 8.30%
- Cash-on-cash
- 7.18%
- DSCR
- 1.32
- GRM
- 8.2
CMA / ARV
No comps found within radius.
Projected returns pro-forma
-3.0% appreciation · 3.0% rent growth · sell at horizon
- IRR
- -5.3%
- Equity multiple
- 0.80×
- Total profit
- $-188,751
- Equity at exit
- $506,951
- IRR
- 4.3%
- Equity multiple
- 1.32×
- Total profit
- $300,008
- Equity at exit
- $293,970
Cash invested: $952,000 (down + closing). Projections, not guarantees.
Landlord ↔ Tenant lean methodology
- Overall (STATE)
- 27 Tenant-Leaning
- State Connecticut
- 27 Tenant-Leaning · D+7
- County
- — inherits STATE
- City
- — inherits STATE
ZIP-level market 06903
- Active inventory
- 73
- Price-to-rent
- 8.2×
Monthly cashflow live
- Estimated rent
- $34,391 medium interval (Pro) →
- Mortgage (P&I)
- −$17,830
- Tax from tax record
- −$2,224 /mo · $26,692/yr
- Insurance
- −$1,417
- HOA
- −$0
- Vacancy / Maint / Mgmt
- −$7,222
- Net cashflow
- $5,698
Break-even live
Sensitivity live
| Price | -10% $7,623 | -5% $6,661 | +0% $5,698 | +5% $4,736 | +10% $3,774 |
|---|---|---|---|---|---|
| Rent | -10% $2,981 | -5% $4,340 | +0% $5,698 | +5% $7,057 | +10% $8,415 |
| Rate | -1.0pp $7,410 | -0.5pp $6,563 | base $5,698 | +0.5pp $4,817 | +1.0pp $3,921 |
UW: 25.0% down · 7.5% · 30yr · 1.5% tax · 5.0% vac · 8.0% maint · 8.0% mgmt
Financing live
Cash to close
- Down payment
- $850,000
- Closing costs
- $102,000
- Reserves months
- —
- Total cash needed
- —
Loan-product check · same deal, 3 products live
Conventional
25% down · 7.5% · 30yr
- Down + closing
- —
- Monthly P&I
- —
- Monthly cashflow
- —
- DSCR
- —
- Eligible?
- —
Personal DTI + credit; lowest rate.
DSCR
20% down · 8.5% · 30yr
- Down + closing
- —
- Monthly P&I
- —
- Monthly cashflow
- —
- DSCR
- —
- Eligible?
- —
No personal income docs; deal must DSCR.
Hard money
10% down · 12.0% · 12mo
- Down + closing
- —
- Monthly P&I
- —
- Monthly cashflow
- —
- DSCR
- —
- Eligible?
- —
Short-term bridge; refi at stabilization.
Rent comps 2 comps
| Address | Beds | Baths | Sqft | Rent | $/sqft | DOM | Units | Dist |
|---|---|---|---|---|---|---|---|---|
| 1300 Rock Rimmon Rd Stamford, CT | 7.0 | 8.5 | 8456 | $23,000 | $2.72 | 10d | 1 | 1.16mi |
| 378 Taconic Rd Greenwich, CT | 5.0 | 6.5 | 9124 | $49,500 | $5.43 | 3d | 1 | 1.42mi |
Listing history 14 events
-
2026-06-18days on market $3,400,000 Active 14 DOM
-
2026-06-17days on market $3,400,000 Active 13 DOM
-
2026-06-16days on market $3,400,000 Active 12 DOM
-
2026-06-15days on market $3,400,000 Active 11 DOM
-
2026-06-13days on market $3,400,000 Active 9 DOM
-
2026-06-13days on market $3,400,000 Active 8 DOM
-
2026-06-10days on market $3,400,000 Active 6 DOM
-
2026-06-09days on market $3,400,000 Active 5 DOM
-
2026-06-08days on market $3,400,000 Active 4 DOM
-
2026-06-07days on market $3,400,000 Active 3 DOM
-
2026-06-05statusdays on market $3,400,000 Active 1 DOM
-
2026-06-03days on market $3,400,000 Coming Soon 2 DOM
-
2026-06-02remarks 699-char remark
-
2026-06-02$3,400,000 Coming Soon 1 DOM
ⓘ Source: listings_history table (triggers on properties + properties_extension) + one-shot
backfill from property_details.listing_events for pre-trigger history.
Tax reassessment forecast CT · Partial reset (capped growth)
- Current annual tax
- $26,692 · $2,224/mo
- Projected year-2 tax
- $49,726 · $4,144/mo
- Expected delta
- +$23,034/yr (+$1,920/mo · 86.3%)
ⓘ Screening estimate from a state-policy table — verify with the county assessor before closing.
Climate risk First Street
- Flood 6/10 Major FEMA zone X (unshaded) · 74% chance over 30 yrs
- Wildfire 4/10 Moderate
- Heat 5/10 Major 7 d/yr ≥99°F today · 16 d/yr by 30 yrs out
- Wind 6/10 Major 27% chance of damaging wind over 30 yrs
- Air quality 4/10 Moderate 5 unhealthy d/yr today · 7 by 30 yrs out
Nearby sold comps map
Loading sold comps map…
Walkable amenities ~0.75 mi
Loading nearby amenities…
Taxation est. · year 1
- Rental income
- $412,696
- − Mortgage interest
- −$190,453
- − Property taxes
- −$26,692
- − Insurance
- −$17,000
- − Repairs & maintenance
- −$33,016
- − Management
- −$33,016
- − Depreciation
- −$98,909
- Taxable income
- $13,611
- Est. tax owed @ 24.0%
- −$3,267
- After-tax cash flow
- $65,112/yr
For passive investors: Depreciation is non-cash, so a rental often shows a tax loss while cash-flowing — sheltering income. Rental losses are passive: they offset passive income freely, and up to $25,000/yr can offset ordinary (W-2) income if you actively participate and your MAGI is under $100k (phasing out to $0 by $150k); unused losses carry forward. On sale, claimed depreciation is recaptured at up to 25%, and gains may owe capital-gains tax (a 1031 exchange can defer both). Figures are a year-1 estimate at your 24.0% rate — not tax advice; consult a CPA.
Schools (NCES district)
- District
- Stamford School District
- NCES district ID
- 0904320
- Math proficiency
- 32% ▼ -10.00%
- Reading proficiency
- 43% ▼ -7.00%
- Median HH income
- $78,843
- Composite
- 35.14/100
- National rank
- #5010
- State rank
- #103 of 153 in CT
Livability — Stamford
- Score
- 70/100
- State rank
- #98
- US rank
- #7716
Category grades
Schools grade is shown separately in the Schools card above.
Census & demographics
- Census place
- Stamford, CT
- City population
- 123,058
- Population (ZIP)
- 13,630
Population outlook (Western Connecticut County) Hauer SSP2
- By 2040
- 685,031
Race, ethnicity, and origin ACS 2023
- Neighborhood character
- Predominantly White (74%)
- Race & ethnicity
- White 74% Two or more races 11% Hispanic / Latino 9% Black 6% Asian 6%
- Hispanic origin (detail)
- Cuban 1%
- Common ancestry
- Romanian 6% Scotch-Irish 4% Italian 2%
- Foreign-born
- 18% · Canada, China, Dominican Republic
- Languages at home
- 78% English-only · Other Indo-European 6% Spanish 5% Russian/Polish/Slavic 4%
Political lean MEDSL · Western Connecticut
- 2024 margin
- D (+19.1) · D 58.8% · R 39.7% · Other 1.6%
- All cycles
- 2024: D+19.1
Not yet ingested
- Civics
- —
Market trends
- HPI YoY
- ▼ -247.05%
- Current HPI
- 163.3073
- Rent YoY
- —
- Metro
- —
- State GDP YoY
- ▲ 1.06%
- F500 in state
- 38
Industry mix (Fortune 500 HQ in CT)
| Industry | F500 HQs | Revenue |
|---|---|---|
| Industrial Machinery | 4 | $38B |
|
||
| Insurance | 3 | $71B |
|
||
| Financial Services | 2 | $25B |
|
||
| Transportation / Logistics | 2 | $18B |
|
||
| Healthcare | 1 | $247B |
|
||
| Telecommunications | 1 | $55B |
|
||
Price history
+1411.1% since first listed24 events — show timeline
- 2026-06-01 Coming Soon $3,400,000 Smart MLS
- 2003-07-01 Sold (Public Records) $1,975,000 Public Records
- 2003-06-27 Sold (MLS) $1,975,000 Smart MLS
- 2003-04-07 Listed $1,950,000 GMLS
- 2003-04-04 Listed $1,950,000 Smart MLS
- 2002-10-19 Listing Removed — Smart MLS
- 2002-04-23 Listed $2,150,000 Smart MLS
- 2001-06-30 Listing Removed — Smart MLS
- 2001-04-17 Sold (Public Records) $1,750,000 Public Records
- 2001-04-16 Sold (MLS) $1,750,000 Smart MLS
- 2001-01-09 Listed $1,895,000 Smart MLS
- 2000-08-31 Listed $1,975,000 Smart MLS
- 2000-05-02 Sold (MLS) $800,000 Smart MLS
- 2000-01-27 Listed $800,000 Smart MLS
- 1999-10-18 Listing Removed — Smart MLS
- 1999-08-16 Listed $250,000 Smart MLS
- 1997-03-01 Listing Removed — Smart MLS
- 1995-06-27 Listed $1,190,000 Smart MLS
- 1994-10-08 Listing Removed — Smart MLS
- 1994-10-08 Listing Removed — Smart MLS
- 1994-10-08 Listing Removed — Smart MLS
- 1994-04-08 Listed $225,000 Smart MLS
- 1994-04-07 Listed $225,000 Smart MLS
- 1994-04-07 Listed $225,000 Smart MLS
Property tax history
+2.2%/yrLatest (2022): $26,692 · +1.4% YoY. Source: county tax records.
Cash-flow waterfall
monthlySold comps — $/sqft
last 12 mo · ≤1 miLoading sold comps…