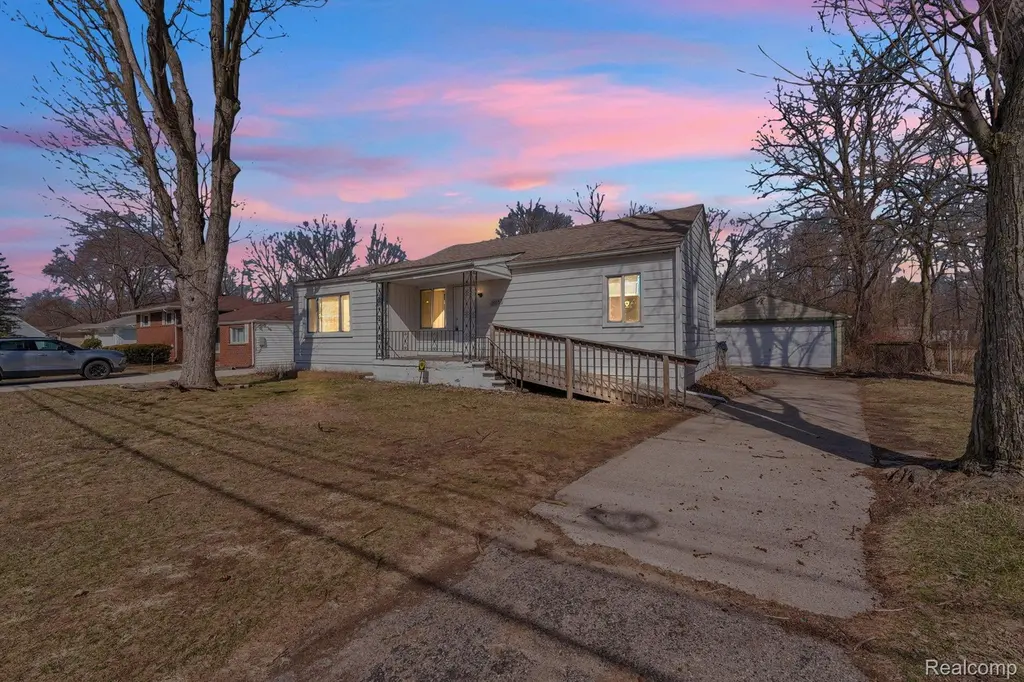
19050 Melrose Ave · Southfield, MI
Flood risk 1/10 · Minimal
- FEMA flood zone
- X (unshaded)
- Chance of flooding over 30 yrs
- 0.0%
- Est. flood insurance / yr
- $507 – $1,088
Fire risk 1/10 · Minimal
- Est. fire insurance / yr
- $784 – $1,456
Heat risk 2/10 · Minimal
- Hot days now (above 97°F)
- 7 days/yr
- Hot days in 30 yrs
- 14 days/yr
Wind risk 2/10 · Minimal
- Chance of severe wind over 30 yrs
- —
Air-quality risk 3/10 · Minor
- Unhealthy air days now
- 2 days/yr
- Unhealthy air days in 30 yrs
- 5 days/yr
Risk factors via First Street. Map © Google.
Why this score? — see what drove the D grade
The composite is a weighted blend of 9 inputs, each scored 0–100. Each bar is that input's sub-score; the figure is the points it added to the 100-point composite (weight × sub-score).
- ARV discount +15.0/15.0
- Cash flow +8.6/30.0
- Rent growth +4.5/5.0
- Livability +3.6/5.0
- 1% rule +3.5/10.0
- Condition / age +2.5/5.0
- DSCR +2.4/10.0
- Schools +2.4/10.0
- Appreciation +0.0/10.0
$175,000
🖨 Deal sheet 📄 Offer letter ✓ Due diligence
Listing remarks MLS
This 3 bedroom, 1 bath home sits on a spacious 0.51-acre lot and offers a great opportunity for someone looking to invest in a new home. Featuring an open floor plan and generously sized rooms, the layout provides plenty of potential to make it your own. The property also includes a 2.5 car garage, offering ample space for parking, storage, or a workshop. With its large lot and solid layout, this home is full of possibilities for the right buyer. Schedule a showing today! BTVAI
Key facts
- 0.52 acre lot
- 2 garage spots
- Built 1945
Neighborhood map
What this means for you Summary
Snapshot
- This is a 3-bed/1.0-bath single-family listed at $175k.
Deal economics
- At list price, monthly cash flow is $-149 ($-2k/yr) — negative.
- To cash-flow at today's rent, offer at most $149k (15.1% below list).
- To meet the 1% rule (rent ≥ 1% of price), the offer needs to be $149k (14.7% below list).
- Recommended offer: $149k (15.1% below list) — sets the bar for cash-flow.
Location & tenants
- Location reads 72/100 on livability (#248 in MI) — a middle-class / working-renter tenant base. Strengths: commute A+, cost of living A+, housing A+; Watch: schools D, health & safety D, crime F.
- Southfield Public School District (urban): math 17% / reading 37% proficiency, ranked #392 of 540 in MI (top 73%) — low school quality limits family demand, transient renter base, plan for 1-2y turnover.
- Market conditions: Rents rising fast (+8.1%/yr); 95 active listings in the ZIP; 31 comparable units currently listed for rent nearby; rentals at typical pace (median 17d on market — plan ~3-4 weeks tenant-placement turnaround); 2,614 units permitted in Oakland County in 2024 (721 in 5+ unit buildings).
Forward outlook
- Local home prices are declining (-3.0%/yr); year-one equity from $1k of loan paydown is wiped out by about $5k of value loss. Plan a longer hold.
- Oakland County population projected at +10% by 2050 — modest demand growth; plan on rents tracking national, not racing it.
Negotiation context
- Only 1 days on market — expect competitive offers; lowballing is unlikely to land.
- 25 sale attempts since 28y ago; this cycle's ask has dropped $25k (12%) from the opening price — seller is motivated, your offer sets the floor, not the list.
Risks & watch-outs
- Watch-outs: built in 1945 — expect roof / HVAC / electrical / plumbing capex.
Questions for the listing agent
- What do current leases actually rent for vs. the listed asking? Can we see a recent rent roll and the last 12 months of T-12 income?
- Built in 1945 — when were the roof, HVAC, electrical panel, plumbing, and water heater last replaced?
- Is there a deadline driving the sale (1031 exchange, divorce, estate, relocation)? That informs how much negotiation room exists.
- Schools are D-rated, which usually means shorter tenancies and higher turnover. Who's the typical renter profile here, and what's been the actual vacancy rate?
- Crime grade is F in this area — have there been break-ins, vandalism, or insurance claims at this property in the last 3 years? What carrier currently insures it and at what premium?
- The area grade is low — what's the realistic commute time and amenity access for the typical tenant pool here? Any planned neighborhood developments (good or bad) we should know about?
- What's the average days-on-market for RENTAL listings here right now (not sales)? A rising rental-DOM trend means longer vacancies and softer asking-rent achievability than the comps imply.
- What's the recent tenant-quality profile in this submarket — average credit score on applications, eviction rate, late-payment / NSF rate, and stable-employment percentage? A property-management company in the area should have these aggregated.
- How much new for-sale + rental construction is in the pipeline within 1–3 miles? Heavy new supply typically softens prices + rents 12–24 months out; constrained supply supports both.
Investment metrics
- 1% rule
- 0.85% ✗
- Cap rate
- 5.27%
- Cash-on-cash
- -3.65%
- DSCR
- 0.84
- GRM
- 9.8
CMA / ARV
- ARV (median comp)
- $217,135
- List price
- $175,000
- Delta
- -17.56%
- Verdict
- UNDERPRICED
- Comps
- 20 within 1.0 mi
Show comp detail 12 sales within ~0.75 mi
| Address | Dist | Beds/Ba | Sqft | Sold | Price | $/sf | Match |
|---|---|---|---|---|---|---|---|
| 20534 Grandville Ave | 0.44mi | 3/1.5 | 1,155 (+6%) | 3mo | $213,500 | $185 | 65 |
| 20575 Annchester Rd | 0.49mi | 3/1.0 | 1,018 (-6%) | 10mo | $94,000 | $92 | 59 |
| 20285 Rosemont Ave | 0.62mi | 3/1.0 | 1,050 (-3%) | 12mo | $100,500 | $96 | 56 |
| 20560 Rosemont Ave | 0.56mi | 3/2.0 | 1,117 (+3%) | 11mo | $159,000 | $142 | 56 |
| 20500 Glastonbury Rd | 0.56mi | 3/1.5 | 1,040 (-4%) | 12mo | $150,000 | $144 | 56 |
| 20211 Rosemont Avenue Ave | 0.67mi | 3/1.0 | 1,054 (-3%) | 11mo | $63,000 | $60 | 55 |
| 19368 Midway Rd N | 0.31mi | 2/1.5 (-1) | 1,212 (+12%) | 7mo | $223,000 | $184 | 53 |
| 21220 Evergreen Rd | 0.46mi | 3/1.0 | 1,212 (+12%) | 10mo | $105,000 | $87 | 50 |
| 20511 Plainview Ave | 0.61mi | 3/1.5 | 1,192 (+10%) | 5mo | $108,000 | $91 | 49 |
| 20510 Rosemont Ave | 0.59mi | 3/1.0 | 974 (-10%) | 8mo | $112,000 | $115 | 49 |
| 20510 Fenmore St | 0.74mi | 3/1.0 | 1,194 (+10%) | 5mo | $64,500 | $54 | 44 |
| 20527 Rosemont Ave | 0.56mi | 4/1.5 (+1) | 975 (-10%) | 13mo | $55,000 | $56 | 39 |
Match score weights: distance 35% · size 25% · config 20% · recency 20%. Top-matched comps best support the ARV.
Projected returns pro-forma
-3.0% appreciation · 8.0% rent growth · sell at horizon
- IRR
- -16.4%
- Equity multiple
- 0.39×
- Total profit
- $-29,879
- Equity at exit
- $26,093
- IRR
- -0.5%
- Equity multiple
- 0.96×
- Total profit
- $-1,973
- Equity at exit
- $15,131
Cash invested: $49,000 (down + closing). Projections, not guarantees.
Landlord ↔ Tenant lean methodology
- Overall (STATE)
- 62 Landlord-Friendly
- State Michigan
- 62 Landlord-Friendly · EVEN
- County
- — inherits STATE
- City
- — inherits STATE
ZIP-level market 48075
- Rents YoY
- 8.1%
- Active inventory
- 95
- Price-to-rent
- 9.8×
Monthly cashflow live
- Estimated rent
- $1,492 high interval (Pro) →
- Mortgage (P&I)
- −$918
- Tax from tax record
- −$337 /mo · $4,049/yr
- Insurance
- −$73
- HOA
- −$0
- Vacancy / Maint / Mgmt
- −$313
- Net cashflow
- $-149
Break-even live
UW: 25.0% down · 7.5% · 30yr · 1.5% tax · 5.0% vac · 8.0% maint · 8.0% mgmt
Financing live
Cash to close
- Down payment
- $43,750
- Closing costs
- $5,250
- Reserves months
- —
- Total cash needed
- —
Loan-product check · same deal, 3 products live
Conventional
25% down · 7.5% · 30yr
- Down + closing
- —
- Monthly P&I
- —
- Monthly cashflow
- —
- DSCR
- —
- Eligible?
- —
Personal DTI + credit; lowest rate.
DSCR
20% down · 8.5% · 30yr
- Down + closing
- —
- Monthly P&I
- —
- Monthly cashflow
- —
- DSCR
- —
- Eligible?
- —
No personal income docs; deal must DSCR.
Hard money
10% down · 12.0% · 12mo
- Down + closing
- —
- Monthly P&I
- —
- Monthly cashflow
- —
- DSCR
- —
- Eligible?
- —
Short-term bridge; refi at stabilization.
Rent comps 31 comps
| Address | Beds | Baths | Sqft | Rent | $/sqft | DOM | Units | Dist |
|---|---|---|---|---|---|---|---|---|
| 20271 Grandville Ave Detroit, MI | 3.0 | 1.0 | 1010 | $1,550 | $1.53 | 23d | 1 | 0.55mi |
| 20527 Rosemont Ave Detroit, MI | 2.0 | 2.0 | 975 | $1,528 | $1.57 | 43d | 1 | 0.56mi |
| 20284 Melrose St Southfield, MI | 3.0 | 1.0 | 1200 | $1,550 | $1.29 | 43d | 1 | 0.63mi |
| 20068 Faust Ave Detroit, MI | 2.0 | 1.0 | 750 | $1,100 | $1.47 | 24d | 1 | 0.69mi |
| 20011 Avon Ave Detroit, MI | 3.0 | 1.0 | 1000 | $1,200 | $1.20 | 4d | 1 | 0.70mi |
| 20200 Ashton Ave Detroit, MI | 3.0 | 1.0 | 1200 | $1,200 | $1.00 | 16d | 1 | 0.73mi |
| 20510 Fenmore St Detroit, MI | 3.0 | 1.0 | 1194 | $1,300 | $1.09 | 1d | 1 | 0.74mi |
| 19970 Ashton Ave Detroit, MI | 3.0 | 1.0 | 1000 | $1,000 | $1.00 | 43d | 1 | 0.84mi |
| 20259 Oakfield St Detroit, MI | 3.0 | 1.0 | 1056 | $1,250 | $1.18 | 16d | 1 | 0.86mi |
| 20043 Fenmore St Detroit, MI | 3.0 | 1.0 | 1030 | $1,453 | $1.41 | 43d | 1 | 0.87mi |
| 20314 Gilchrist St Detroit, MI | 3.0 | 1.0 | 1042 | $1,500 | $1.44 | 4d | 1 | 0.95mi |
| 19918 Southfield Fwy Detroit, MI | 3.0 | 1.0 | 915 | $1,375 | $1.50 | 14d | 1 | 0.95mi |
| 16500 N Park Dr Southfield, MI | 1.0–3.0 | 1.0–2.5 | 1500 | $2,289 | $1.53 | 1d | 1 | 0.96mi |
| 20203 Gilchrist St Detroit, MI | 3.0 | 1.0 | 1031 | $1,250 | $1.21 | 4d | 1 | 0.99mi |
| 19818 Fenmore St Detroit, MI | 3.0 | 1.0 | 902 | $1,275 | $1.41 | 43d | 1 | 1.02mi |
| 19445 Avon Ave Detroit, MI | 3.0 | 1.0 | 1023 | $1,550 | $1.52 | 43d | 1 | 1.03mi |
| 20079 Patton St Detroit, MI | 3.0 | 1.0 | 1150 | $1,550 | $1.35 | 4d | 1 | 1.03mi |
| 20210 Biltmore St Detroit, MI | 3.0 | 1.0 | 1033 | $1,350 | $1.31 | 24d | 1 | 1.06mi |
| 19372 Grandville Ave Detroit, MI | 2.0 | 1.5 | 733 | $1,050 | $1.43 | 14d | 1 | 1.10mi |
| 19457 Evergreen Rd Detroit, MI | 2.0 | 1.0 | 1100 | $1,200 | $1.09 | 43d | 1 | 1.14mi |
| 19329 Stahelin Ave Unit 1 Detroit, MI | 3.0 | 1.5 | 833 | $1,250 | $1.50 | 43d | 1 | 1.15mi |
| 19781 Fielding St Detroit, MI | 3.0 | 1.0 | 1000 | $1,294 | $1.29 | 4d | 1 | 1.16mi |
| 19176 Grandville Ave Detroit, MI | 3.0 | 1.0 | 941 | $1,300 | $1.38 | 4d | 1 | 1.25mi |
| 19400 Harlow St Detroit, MI | 4.0 | 1.0 | 1298 | $1,275 | $0.98 | 16d | 1 | 1.27mi |
| 16300 W 9 Mile Rd Southfield, MI | 1.0–2.0 | 1.0–2.0 | 950 | $1,350 | $1.42 | 43d | 1 | 1.28mi |
| 16200 W 9 Mile Rd Southfield, MI | 1.0–2.0 | 1.0–2.0 | 971 | $1,700 | $1.75 | 4d | 2 | 1.31mi |
| 19810 Blackstone St Detroit, MI | 3.0 | 1.0 | 1216 | $1,395 | $1.15 | 43d | 1 | 1.38mi |
| 20555 Motor Dr Detroit, MI | 1.0–2.0 | 1.0 | 750 | $1,222 | $1.63 | 14d | 5 | 1.40mi |
| 16176 Cumberland Rd Southfield, MI | 2.0–3.0 | 2.0 | 1450 | $1,675 | $1.16 | 43d | 1 | 1.42mi |
| 18699 Shaftsbury Ave Detroit, MI | 2.0 | 1.0 | 800 | $1,000 | $1.25 | 43d | 1 | 1.44mi |
| 18659 Shaftsbury Ave Detroit, MI | 3.0 | 1.0 | 763 | $1,373 | $1.80 | 12d | 1 | 1.48mi |
Listing history 50 events
-
2026-06-19remarks 483-char remark
-
2026-06-19pricedays on market $175,000 Active 1 DOM
-
2026-05-31days on market $179,000 Active 81 DOM
-
2026-05-19price $179,000 482-char remark
Show marketing remark (482 chars)
This 3 bedroom, 1 bath home sits on a spacious 0.51-acre lot and offers a great opportunity for someone looking to invest in a new home. Featuring an open floor plan and generously sized rooms, the layout provides plenty of potential to make it your own. The property also includes a 2.5 car garage, offering ample space for parking, storage, or a workshop. With its large lot and solid layout, this home is full of possibilities for the right buyer. Schedule a showing today! BTVAI
-
2026-05-18price $179,000 482-char remark
Show marketing remark (482 chars)
This 3 bedroom, 1 bath home sits on a spacious 0.51-acre lot and offers a great opportunity for someone looking to invest in a new home. Featuring an open floor plan and generously sized rooms, the layout provides plenty of potential to make it your own. The property also includes a 2.5 car garage, offering ample space for parking, storage, or a workshop. With its large lot and solid layout, this home is full of possibilities for the right buyer. Schedule a showing today! BTVAI
-
2026-03-11$200,000 Active 482-char remark
Show marketing remark (482 chars)
This 3 bedroom, 1 bath home sits on a spacious 0.51-acre lot and offers a great opportunity for someone looking to invest in a new home. Featuring an open floor plan and generously sized rooms, the layout provides plenty of potential to make it your own. The property also includes a 2.5 car garage, offering ample space for parking, storage, or a workshop. With its large lot and solid layout, this home is full of possibilities for the right buyer. Schedule a showing today! BTVAI
-
2023-05-30soldstatus $169,000 Sold
-
2023-05-30soldstatus $169,000 Closed
-
2023-05-25status Pending
-
2023-05-25status Pending
-
2023-04-13$169,000 Active
-
2023-04-13$169,000 Active
-
2023-04-12historical $169,000
-
2023-04-12historical $169,000
-
2021-08-10historical
-
2021-08-10historical
-
2021-06-24$139,900 Active
-
2021-06-24$139,900 Active
-
2021-06-22historical
-
2021-06-22historical
-
2014-06-12historical
-
2014-06-12historical
-
2014-06-12historical
-
2014-01-31$89,000
-
2014-01-31$1,000
-
2014-01-31$89,000
-
2013-10-30historical
-
2013-10-30historical
-
2013-10-30historical
-
2013-09-16$89,000
-
2013-09-16$89,000
-
2013-09-16$1,000
-
2013-06-25historical
-
2013-02-25$950
-
2011-11-30historical
-
2011-07-06historical
-
2011-07-06historical
-
2011-01-06$69,000
-
2011-01-06$69,000
-
2011-01-06$69,000
-
2008-05-16soldstatus $10,000
-
2008-05-16soldstatus $10,000
-
2008-04-29historical
-
2008-03-17$21,250
-
2008-03-15historical
-
2007-10-05$45,000
-
2007-10-04historical
-
2007-06-01$59,900
-
2007-05-31historical
ⓘ Source: listings_history table (triggers on properties + properties_extension) + one-shot
backfill from property_details.listing_events for pre-trigger history.
Tax reassessment forecast MI · Partial reset (capped growth)
- Current annual tax
- $4,049 · $337/mo
- Projected year-2 tax
- $4,049 · $337/mo
- Expected delta
- $0/yr ($0/mo · 0.0%)
ⓘ Screening estimate from a state-policy table — verify with the county assessor before closing.
Climate risk First Street
- Flood 1/10 Low FEMA zone X (unshaded) · 0% chance over 30 yrs
- Wildfire 1/10 Low
- Heat 2/10 Low 7 d/yr ≥97°F today · 14 d/yr by 30 yrs out
- Wind 2/10 Low
- Air quality 3/10 Moderate 2 unhealthy d/yr today · 5 by 30 yrs out
Nearby sold comps map
Loading sold comps map…
Walkable amenities ~0.75 mi
Loading nearby amenities…
Taxation est. · year 1
- Rental income
- $17,907
- − Mortgage interest
- −$9,803
- − Property taxes
- −$4,049
- − Insurance
- −$875
- − Repairs & maintenance
- −$1,433
- − Management
- −$1,433
- − Depreciation
- −$5,091
- Taxable loss
- −$4,776
- Est. tax savings @ 24.0%
- +$1,146
- After-tax cash flow
- $-644/yr
For passive investors: Depreciation is non-cash, so a rental often shows a tax loss while cash-flowing — sheltering income. Rental losses are passive: they offset passive income freely, and up to $25,000/yr can offset ordinary (W-2) income if you actively participate and your MAGI is under $100k (phasing out to $0 by $150k); unused losses carry forward. On sale, claimed depreciation is recaptured at up to 25%, and gains may owe capital-gains tax (a 1031 exchange can defer both). Figures are a year-1 estimate at your 24.0% rate — not tax advice; consult a CPA.
Schools (NCES district)
- District
- Southfield Public School District
- NCES district ID
- 2632310
- Math proficiency
- 17% ▼ -3.00%
- Reading proficiency
- 37% ▲ 1.00%
- Median HH income
- $51,400
- Composite
- 23.77/100
- National rank
- #7814
- State rank
- #392 of 540 in MI
Livability — Southfield
- Score
- 72/100
- State rank
- #248
- US rank
- #6175
Category grades
Schools grade is shown separately in the Schools card above.
Census & demographics
- Census place
- Southfield, MI
- County
- Oakland County · 1,009,092 people
- City population
- 54,914
- Metro
- Detroit-Warren-Dearborn, MI
- Population (ZIP)
- 22,841
- Household income
- $65,384
- Rent vs Own
- Severe rent burden
- 1336.0
Population outlook (Oakland County) Hauer SSP2
- Today (2025)
- 1,335,747 people
- By 2030
- 1,375,100 · +2.9%
- By 2040
- 1,435,385 · +7.5%
- By 2050
- 1,469,250 · +10.0%
- By 2075
- 1,531,946 · +14.7%
- By 2100
- 1,450,485 · +8.6%
Race, ethnicity, and origin ACS 2023
- Neighborhood character
- Majority Black (65%)
- Race & ethnicity
- Black 65% White 26% Two or more races 7% Hispanic / Latino 1%
- Common ancestry
- Romanian 2% Scotch-Irish 2% Subsaharan African 1%
- Foreign-born
- 4% · Canada
- Languages at home
- 94% English-only · Russian/Polish/Slavic 1% Spanish 1% German/W. Germanic 1%
Political lean MEDSL · Oakland
- 2024 margin
- D (+10.6) · D 54.4% · R 43.8% · Other 1.9%
- 2008→2024 swing
- -3.9pp toward R · 2008: 14.5pp · 2024: 10.6pp
- All cycles
- 2024: D+10.6 2020: D+14.1 2016: D+8.1 2012: D+8.1 2008: D+14.5
Not yet ingested
- Civics
- —
Market trends
- HPI YoY
- ▼ -209.20%
- Current HPI
- 190.3275
- Rent YoY
- ▲ 8.06%
- Metro
- Detroit-Warren-Dearborn, MI
- State GDP YoY
- ▲ 1.37%
- F500 in state
- 28
Industry mix (Fortune 500 HQ in MI)
| Industry | F500 HQs | Revenue |
|---|---|---|
| Automotive Parts | 3 | $48B |
|
||
| Automotive | 2 | $372B |
|
||
| Chemicals | 1 | $45B |
|
||
| Automotive Retail | 1 | $29B |
|
||
| Healthcare / Medical Devices | 1 | $23B |
|
||
| Automotive Technology | 1 | $20B |
|
||
Price history
+364.9% since first listed64 events — show timeline
- 2026-05-19 Price Changed $179,000 MiRealSource-MiMLS
- 2026-05-18 Price Changed $179,000 REALCOMP
- 2026-03-11 Listed $200,000 REALCOMP
- 2026-03-11 Listed $200,000 MiRealSource-MiMLS
- 2023-05-30 Sold (MLS) $169,000 MiRealSource-MiMLS
- 2023-05-30 Sold (MLS) $169,000 REALCOMP
- 2023-05-25 Pending — MiRealSource-MiMLS
- 2023-05-25 Pending — REALCOMP
- 2023-04-13 Listed $169,000 MiRealSource-MiMLS
- 2023-04-13 Listed $169,000 REALCOMP
- 2023-04-12 Coming Soon $169,000 MiRealSource-MiMLS
- 2023-04-12 Coming Soon $169,000 REALCOMP
- 2021-08-10 Listing Removed — REALCOMP
- 2021-08-10 Listing Removed — MiRealSource-MiMLS
- 2021-06-24 Listed $139,900 MiRealSource-MiMLS
- 2021-06-24 Listed $139,900 REALCOMP
- 2021-06-22 Coming Soon — MiRealSource-MiMLS
- 2021-06-22 Coming Soon — REALCOMP
- 2014-06-12 Listing Removed — MiRealSource-MiMLS
- 2014-06-12 Listing Removed — MiRealSource-MiMLS
- 2014-06-12 Listing Removed — REALCOMP
- 2014-01-31 Listed $89,000 MiRealSource-MiMLS
- 2014-01-31 Listed $1,000 MiRealSource-MiMLS
- 2014-01-31 Listed $89,000 REALCOMP
- 2013-10-30 Listing Removed — MiRealSource-MiMLS
- 2013-10-30 Listing Removed — MiRealSource-MiMLS
- 2013-10-30 Listing Removed — REALCOMP
- 2013-09-16 Listed $1,000 MiRealSource-MiMLS
- 2013-09-16 Listed $89,000 MiRealSource-MiMLS
- 2013-09-16 Listed $89,000 REALCOMP
- 2013-06-25 Listing Removed — MiRealSource-MiMLS
- 2013-02-25 Listed $950 MiRealSource-MiMLS
- 2011-11-30 Listing Removed — MiRealSource-MiMLS
- 2011-07-06 Listing Removed — REALCOMP
- 2011-07-06 Listing Removed — MiRealSource-MiMLS
- 2011-01-06 Listed $69,000 REALCOMP
- 2011-01-06 Listed $69,000 MiRealSource-MiMLS
- 2011-01-06 Listed $69,000 MiRealSource-MiMLS
- 2008-05-16 Sold (MLS) $10,000 REALCOMP
- 2008-05-16 Sold (MLS) $10,000 MiRealSource-MiMLS
- 2008-04-29 Listing Removed — MiRealSource-MiMLS
- 2008-03-17 Listed $21,250 REALCOMP
- 2008-03-15 Listing Removed — REALCOMP
- 2007-10-05 Listed $45,000 REALCOMP
- 2007-10-04 Listing Removed — REALCOMP
- 2007-06-01 Listed $59,900 REALCOMP
- 2007-05-31 Listing Removed — REALCOMP
- 2007-04-27 Listed $70,000 REALCOMP
- 2007-04-26 Listing Removed — REALCOMP
- 2007-01-26 Listing Removed — REALCOMP
- 2007-01-26 Listed $70,000 REALCOMP
- 2007-01-26 Listed $21,250 MiRealSource-MiMLS
- 2007-01-02 Listed $78,900 REALCOMP
- 2006-12-30 Listing Removed — REALCOMP
- 2006-07-24 Listed $78,900 REALCOMP
- 2004-09-23 Sold (Public Records) $130,000 Public Records
- 2003-06-19 Sold (Public Records) $110,000 Public Records
- 2003-01-06 Sold (Public Records) $69,586 Public Records
- 1999-09-03 Sold (Public Records) $67,500 Public Records
- 1998-08-20 Sold (Public Records) $61,500 Public Records
- 1998-06-02 Sold (MLS) $61,500 REALCOMP
- 1998-01-30 Listed $69,900 REALCOMP
- 1997-06-10 Sold (Public Records) $36,000 Public Records
- 1992-06-30 Sold (Public Records) $38,500 Public Records
Property tax history
+8.3%/yrLatest (2025): $4,049 · -17.4% YoY. Source: county tax records.
Cash-flow waterfall
monthlySold comps — $/sqft
last 12 mo · ≤1 miLoading sold comps…