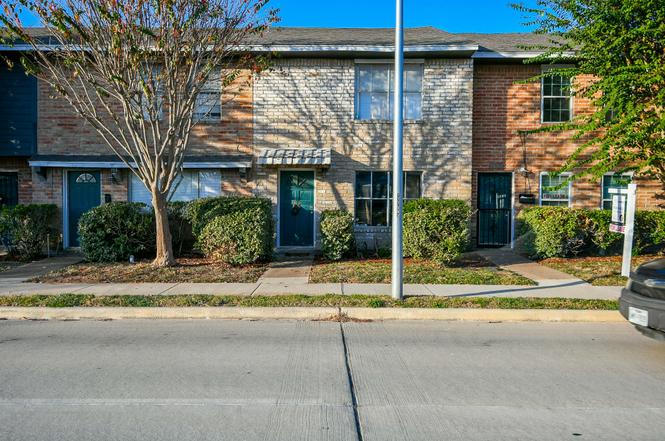
7851 Fuqua St · Houston, TX
Flood risk 6/10 · Moderate
- FEMA flood zone
- X (shaded)
- Chance of flooding over 30 yrs
- 0.74%
- Est. flood insurance / yr
- $507 – $1,088
Fire risk 3/10 · Minor
- Est. fire insurance / yr
- $1,222 – $2,270
Heat risk 9/10 · Severe
- Hot days now (above 109°F)
- 7 days/yr
- Hot days in 30 yrs
- 24 days/yr
Wind risk 9/10 · Severe
- Chance of severe wind over 30 yrs
- 99.0%
Air-quality risk 2/10 · Minimal
- Unhealthy air days now
- 1 days/yr
- Unhealthy air days in 30 yrs
- 2 days/yr
Risk factors via First Street. Map © Google.
Why this score? — see what drove the B- grade
The composite is a weighted blend of 9 inputs, each scored 0–100. Each bar is that input's sub-score; the figure is the points it added to the 100-point composite (weight × sub-score).
- Cash flow +30.0/30.0
- 1% rule +10.0/10.0
- DSCR +10.0/10.0
- ARV discount +7.5/15.0
- Livability +3.7/5.0
- Rent growth +3.0/5.0
- Schools +2.7/10.0
- Condition / age +2.5/5.0
- Appreciation +0.0/10.0
$70,000
🖨 Deal sheet 📄 Offer letter ✓ Due diligence
Key facts
- $122 HOA
- Parking
- Built 1979
Neighborhood map
What this means for you Summary
Snapshot
- This is a 2-bed/2.5-bath condo listed at $70k.
Deal economics
- At list price, monthly cash flow is $649 ($8k/yr) — positive.
- The deal already cash-flows at list — no discount required.
- Meets the 1% rule at list price ($2k rent vs $70k).
- Recommended offer: $62k (12.0% below list) — sets the bar for market timing.
- Cap rate 17.4% vs local median 3.2% in Houston — top-decile yield for the area; either an underpriced asset or a hidden risk that comps aren't pricing in. Stress-test before assuming the spread holds.
Location & tenants
- Location reads 74/100 on livability (#184 in TX, #4,771 nationally) — a middle-class / working-renter tenant base. Strengths: amenities A+, cost of living A+, housing A+; Watch: crime F.
- Houston ISD (urban): math 27% / reading 35% proficiency, ranked #593 of 826 in TX (top 72%) — families likely to look elsewhere, expect single-tenant / working-renter base with shorter leases; 71% free/reduced lunch — lower-income household profile, screen leases tightly.
- Zoned schools: Thomas Middle (math 3% / reading 13%, grade F, #1,654 of 1,662 statewide, top 100%, 526 students, 98% FRL); Sterling H S (math 16% / reading 27%, grade F, #1,377 of 1,632 statewide, top 85%, 1,421 students, 92% FRL) — zoned schools average 95% FRL vs 71% district-wide (24 pts higher); higher-poverty schools than district average — tighter screening recommended.
- Zoned-school proficiency averages 15% at this address vs 31% district-wide (-16 pts) — the specific schools serving this property underperform the Houston ISD average; the district grade overstates school quality for this exact location.
- Market conditions: Rents rising (+2.2%/yr); 146 active listings in the ZIP; 15 comparable units currently listed for rent nearby; rentals leasing fast (median 12d on market — plan ~1-2 weeks tenant-placement turnaround); 29,883 units permitted in Harris County in 2024 (8,621 in 5+ unit buildings).
Forward outlook
- Local home prices are declining (-3.0%/yr); year-one equity from $484 of loan paydown is wiped out by about $2k of value loss. Plan a longer hold.
- Harris County population projected at +47% by 2050 — long-run rental-demand tailwind backs the buy-and-hold thesis.
- At projected returns (-3.0% appreciation + 2.2% rent growth), your $20k cash investment doubles in ~4 years — after that, you're playing with house money.
Negotiation context
- It's been on market 132 days — a 12% lower offer ($62k) is reasonable based on typical stale-listing flexibility.
- 2 sale attempts; this cycle's ask has dropped $40k (36%) from the opening price — seller is motivated, your offer sets the floor, not the list.
Risks & watch-outs
- Watch-outs: property tax is 2.8% of price.
- Climate carrying-cost: major flood risk; severe wind risk, 99% chance of damaging wind over 30y; extreme-heat days projected 7→24/yr by 2055 (HVAC capex compounding) — expect insurance premiums to compound above CPI over the hold.
Questions for the listing agent
- It's been on market 132 days. Have you received any prior offers? Is the seller open to a 12% concession, seller financing, or rate buy-down credit?
- Built in 1979 — when were the roof, HVAC, electrical panel, plumbing, and water heater last replaced?
- Property tax is high relative to price — has the assessment been appealed recently, and will the sale trigger a re-assessment?
- What does the HOA fee cover, when was the last increase, and are there any pending special assessments or reserve-fund shortfalls?
- Any open or pending special assessments — roof, HVAC, plumbing, elevator, façade? What's the per-unit balance and payoff schedule, and is the seller paying it off at close or rolling it to the buyer?
- Why hasn't it sold? Are there any deal-killer items the seller is aware of (foundation, flood, title, zoning, code violations)?
- Is there a deadline driving the sale (1031 exchange, divorce, estate, relocation)? That informs how much negotiation room exists.
- Schools are D-rated, which usually means shorter tenancies and higher turnover. Who's the typical renter profile here, and what's been the actual vacancy rate?
- Crime grade is F in this area — have there been break-ins, vandalism, or insurance claims at this property in the last 3 years? What carrier currently insures it and at what premium?
- What's the average days-on-market for RENTAL listings here right now (not sales)? A rising rental-DOM trend means longer vacancies and softer asking-rent achievability than the comps imply.
- What's the recent tenant-quality profile in this submarket — average credit score on applications, eviction rate, late-payment / NSF rate, and stable-employment percentage? A property-management company in the area should have these aggregated.
- How much new apartment / multifamily construction is in the pipeline within 1–3 miles? Heavy new supply (>2% of stock underway) typically softens rents 12–24 months out; light construction supports rent growth.
Investment metrics
- 1% rule
- 2.41% ✓
- Cap rate
- 17.42%
- Cash-on-cash
- 39.72%
- DSCR
- 2.77
- GRM
- 3.5
CMA / ARV
No comps found within radius.
Projected returns pro-forma
-3.0% appreciation · 2.17% rent growth · sell at horizon
- IRR
- 35.0%
- Equity multiple
- 2.47×
- Total profit
- $28,734
- Equity at exit
- $10,437
- IRR
- 41.4%
- Equity multiple
- 4.73×
- Total profit
- $73,202
- Equity at exit
- $6,052
Cash invested: $19,600 (down + closing). Projections, not guarantees.
Landlord ↔ Tenant lean methodology
- Overall (STATE)
- 87 Strongly Landlord-Friendly
- State Texas
- 87 Strongly Landlord-Friendly · R+5
- County
- — inherits STATE
- City
- — inherits STATE
ZIP-level market 77075
- Home prices YoY
- -25.3%
- Rents YoY
- 2.2%
- Active inventory
- 146
- Price-to-rent
- 3.5×
Monthly cashflow live
- Estimated rent
- $1,684 high interval (Pro) →
- Mortgage (P&I)
- −$367
- Tax from tax record
- −$163 /mo · $1,956/yr
- Insurance
- −$29
- HOA
- −$122
- Vacancy / Maint / Mgmt
- −$354
- Net cashflow
- $649
Break-even live
UW: 25.0% down · 7.5% · 30yr · 1.5% tax · 5.0% vac · 8.0% maint · 8.0% mgmt
Financing live
Cash to close
- Down payment
- $17,500
- Closing costs
- $2,100
- Reserves months
- —
- Total cash needed
- —
Loan-product check · same deal, 3 products live
Conventional
25% down · 7.5% · 30yr
- Down + closing
- —
- Monthly P&I
- —
- Monthly cashflow
- —
- DSCR
- —
- Eligible?
- —
Personal DTI + credit; lowest rate.
DSCR
20% down · 8.5% · 30yr
- Down + closing
- —
- Monthly P&I
- —
- Monthly cashflow
- —
- DSCR
- —
- Eligible?
- —
No personal income docs; deal must DSCR.
Hard money
10% down · 12.0% · 12mo
- Down + closing
- —
- Monthly P&I
- —
- Monthly cashflow
- —
- DSCR
- —
- Eligible?
- —
Short-term bridge; refi at stabilization.
Rent comps 15 comps
| Address | Beds | Baths | Sqft | Rent | $/sqft | DOM | Units | Dist |
|---|---|---|---|---|---|---|---|---|
| 7821 Fuqua St Houston, TX | 3.0 | 2.0 | 1408 | $1,700 | $1.21 | 43d | 1 | 0.08mi |
| 8012 Folkstone Ln Houston, TX | 3.0 | 2.0 | 1589 | $1,900 | $1.20 | 43d | 1 | 0.30mi |
| 8238 Fuqua Gardens Dr Houston, TX | 3.0 | 2.5 | 1787 | $1,995 | $1.12 | 5d | 1 | 0.45mi |
| 7909 S Sam Houston Pkwy E Houston, TX | 2.0 | 2.0 | 943 | $1,072 | $1.14 | 43d | 1 | 0.73mi |
| 7915 S Sam Houston Pkwy E Houston, TX | 3.0 | 2.0 | 1154 | $1,104 | $0.96 | 43d | 1 | 0.85mi |
| 8911 Durham Manor Ln Houston, TX | 3.0 | 3.0 | 1848 | $2,201 | $1.19 | 5d | 1 | 1.17mi |
| 11576 Pearland Pkwy Unit 2162 Houston, TX | 2.0 | 2.0 | 1079 | $1,812 | $1.68 | 5d | 1 | 1.19mi |
| 11576 Pearland Pkwy Unit 2165 Houston, TX | 2.0 | 2.0 | 1079 | $1,804 | $1.67 | 2d | 1 | 1.19mi |
| 9943 Pearland Pkwy Houston, TX | 2.0 | 2.0 | 1079 | $1,839 | $1.70 | 24d | 1 | 1.22mi |
| 11576 Pearland Pkwy Unit 422 Houston, TX | 2.0 | 2.0 | 1079 | $1,812 | $1.68 | 7d | 1 | 1.23mi |
| 11576 Pearland Pkwy Unit 11613 Houston, TX | 2.0 | 2.0 | 1079 | $1,847 | $1.71 | 11d | 1 | 1.23mi |
| 11576 Pearland Pkwy Unit 2174 Houston, TX | 2.0 | 2.0 | 1079 | $1,836 | $1.70 | 10d | 1 | 1.26mi |
| 8020 Botany Ln Unit 1546255P Houston, TX | 3.0 | 2.0 | 1388 | $3,226 | $2.32 | 16d | 1 | 1.29mi |
| 6543 Castle Loch Ct Houston, TX | 3.0 | 2.5 | 1709 | $1,995 | $1.17 | 14d | 1 | 1.40mi |
| 11575 Pearland Pkwy Houston, TX | 1.0–3.0 | 1.0–2.0 | 1070 | $1,589 | $1.48 | 1d | 22 | 1.48mi |
HOA detail condo
- Monthly dues
- $122 · $1,464/yr
- Assessments
- None detected in remarks — confirm with the listing agent.
Listing history 14 events
-
2026-06-18days on market $70,000 Active 132 DOM
-
2026-06-17days on market $70,000 Active 131 DOM
-
2026-06-16days on market $70,000 Active 130 DOM
-
2026-06-15statusdays on market $70,000 Active 129 DOM
-
2026-04-18status Pending
-
2026-04-13status Pending
-
2026-04-09historical
-
2026-03-19status Active
-
2026-03-05status Pending
-
2026-01-07historical Active Under Contract
-
2026-01-05price $70,000
-
2025-11-23$110,000 Active
-
2003-10-07soldstatus $420,000
-
1997-10-16soldstatus
ⓘ Source: listings_history table (triggers on properties + properties_extension) + one-shot
backfill from property_details.listing_events for pre-trigger history.
Tax reassessment forecast TX · Resets to sale price
- Current annual tax
- $1,956 · $163/mo
- Projected year-2 tax
- $1,956 · $163/mo
- Expected delta
- $0/yr ($0/mo · 0.0%)
ⓘ Screening estimate from a state-policy table — verify with the county assessor before closing.
Climate risk First Street
- Flood 6/10 Major FEMA zone X (shaded) · 74% chance over 30 yrs
- Wildfire 3/10 Moderate
- Heat 9/10 Extreme 7 d/yr ≥109°F today · 24 d/yr by 30 yrs out
- Wind 9/10 Extreme 99% chance of damaging wind over 30 yrs
- Air quality 2/10 Low 1 unhealthy d/yr today · 2 by 30 yrs out
Nearby sold comps map
Loading sold comps map…
Walkable amenities ~0.75 mi
Loading nearby amenities…
Taxation est. · year 1
- Rental income
- $20,204
- − Mortgage interest
- −$3,921
- − Property taxes
- −$1,956
- − Insurance
- −$350
- − Repairs & maintenance
- −$1,616
- − Management
- −$1,616
- − HOA
- −$1,464
- − Depreciation
- −$2,036
- Taxable income
- $7,244
- Est. tax owed @ 24.0%
- −$1,739
- After-tax cash flow
- $6,048/yr
For passive investors: Depreciation is non-cash, so a rental often shows a tax loss while cash-flowing — sheltering income. Rental losses are passive: they offset passive income freely, and up to $25,000/yr can offset ordinary (W-2) income if you actively participate and your MAGI is under $100k (phasing out to $0 by $150k); unused losses carry forward. On sale, claimed depreciation is recaptured at up to 25%, and gains may owe capital-gains tax (a 1031 exchange can defer both). Figures are a year-1 estimate at your 24.0% rate — not tax advice; consult a CPA.
Schools (NCES district)
- District
- Houston ISD
- NCES district ID
- 4823640
- Math proficiency
- 27% ▼ -18.00%
- Reading proficiency
- 35% ▼ -6.00%
- Median HH income
- $46,054
- Composite
- 26.63/100
- National rank
- #7173
- State rank
- #593 of 826 in TX
Livability — Houston
- Score
- 74/100
- State rank
- #184
- US rank
- #4771
Category grades
Schools grade is shown separately in the Schools card above.
Census & demographics
- Census place
- Houston, TX
- County
- Harris County · 4,702,590 people
- City population
- 3,226,434
- Metro
- Houston-The Woodlands-Sugar Land, TX
- Population (ZIP)
- 40,626
- Household income
- $69,191
- Rent vs Own
- Severe rent burden
- 1573.0
Population outlook (Harris County) Hauer SSP2
- Today (2025)
- 5,571,493 people
- By 2030
- 6,089,821 · +9.3%
- By 2040
- 7,142,806 · +28.2%
- By 2050
- 8,185,864 · +46.9%
- By 2075
- 10,574,329 · +89.8%
- By 2100
- 12,109,958 · +117.4%
Race, ethnicity, and origin ACS 2023
- Neighborhood character
- Predominantly Hispanic (71%)
- Race & ethnicity
- Hispanic / Latino 71% Two or more races 34% Black 14% White 7% Asian 6% Native American 1%
- Hispanic origin (detail)
- Mexican 53%
- Common ancestry
- Lithuanian 1%
- Foreign-born
- 30% · Canada, Vietnam, Jamaica
- Languages at home
- 34% English-only · Spanish 60% Vietnamese 6%
Political lean MEDSL · Harris
- 2024 margin
- Lean D (+5.5) · D 52.0% · R 46.4% · Other 1.6%
- 2008→2024 swing
- +3.9pp toward D · 2008: 1.6pp · 2024: 5.5pp
- All cycles
- 2024: D+5.5 2020: D+13.3 2016: D+12.4 2012: D+0.1 2008: D+1.6
Not yet ingested
- Civics
- —
Market trends
- HPI YoY
- ▼ -88.33%
- Current HPI
- 260.3733
- Rent YoY
- ▲ 2.17%
- Metro
- Houston-The Woodlands-Sugar Land, TX
- State GDP YoY
- ▲ 3.95%
- F500 in state
- 110
Industry mix (Fortune 500 HQ in TX)
| Industry | F500 HQs | Revenue |
|---|---|---|
| Energy | 16 | $1,198B |
|
||
| Technology | 5 | $198B |
|
||
| Engineering / Construction | 4 | $72B |
|
||
| Energy Services | 3 | $60B |
|
||
| Utilities | 3 | $41B |
|
||
| Healthcare | 2 | $330B |
|
||
Price history
-83.3% since first listed10 events — show timeline
- 2026-04-18 Pending — HARMLS
- 2026-04-13 Pending — HARMLS
- 2026-04-09 Listing Removed — HARMLS
- 2026-03-19 Relisted — HARMLS
- 2026-03-05 Pending — HARMLS
- 2026-01-07 Contingent — HARMLS
- 2026-01-05 Price Changed $70,000 HARMLS
- 2025-11-23 Listed $110,000 HARMLS
- 2003-10-07 Sold (Public Records) $420,000 Public Records
- 1997-10-16 Sold (Public Records) — Public Records
Property tax history
+0.5%/yrLatest (2025): $1,956 · +11.7% YoY. Source: county tax records.
Cash-flow waterfall
monthlySold comps — $/sqft
last 12 mo · ≤1 miLoading sold comps…