 🏗️ New Construction
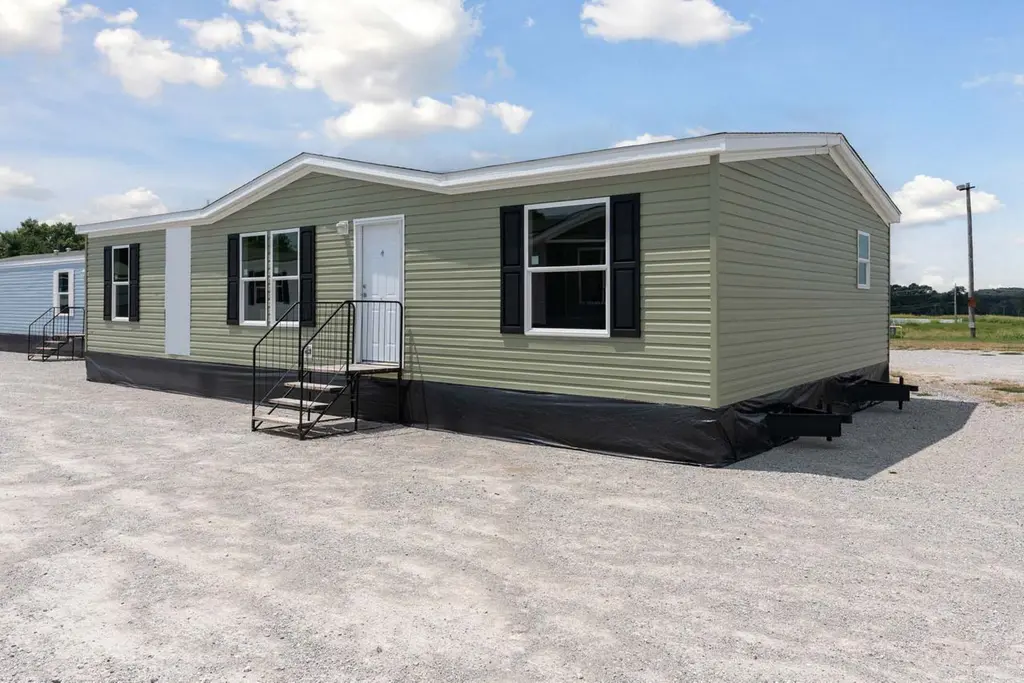
Churchill (Sawyier Oak) Plan · Lexington-Fayette, KY
Flood risk 1/10 · Minimal
- FEMA flood zone
- X (unshaded)
- Chance of flooding over 30 yrs
- 0.0%
- Est. flood insurance / yr
- $507 – $1,088
Fire risk 3/10 · Minor
- Est. fire insurance / yr
- $839 – $1,559
Heat risk 4/10 · Minor
- Hot days now (above 102°F)
- 7 days/yr
- Hot days in 30 yrs
- 19 days/yr
Wind risk 2/10 · Minimal
- Chance of severe wind over 30 yrs
- 2.0%
Air-quality risk 2/10 · Minimal
- Unhealthy air days now
- 0 days/yr
- Unhealthy air days in 30 yrs
- 1 days/yr
Risk factors via First Street. Map © Google.
Why this score? — see what drove the B grade
The composite is a weighted blend of 9 inputs, each scored 0–100. Each bar is that input's sub-score; the figure is the points it added to the 100-point composite (weight × sub-score).
- Cash flow +30.0/30.0
- 1% rule +10.0/10.0
- DSCR +10.0/10.0
- ARV discount +7.5/15.0
- Condition / age +4.0/5.0
- Schools +3.4/10.0
- Rent growth +3.2/5.0
- Livability +2.5/5.0
- Appreciation +0.0/10.0
$85,995
🖨 Deal sheet 📄 Offer letter ✓ Due diligence
Listing remarks MLS
Sawyier Pointe is a quiet, friendly community of attractive and affordable manufactured homes located in Georgetown, Kentucky. The community has a brand new playground, clubhouse and more! Located just near I-75 and I-64 in Central Kentucky near Lexington, the community is one exit from the famous Kentucky Horse Park along with many major employers. Our community property lies within the borders of both Fayette and Scott Counties. Please check with our office for your location school districts. Both Fayette and Scott Counties have highly rated public schools. Community Amenities Basketball Court, Clubhouse, and Playground
Key facts
- Near i-75
- Near i-64
- Clubhouse
Tags
Neighborhood map
What this means for you Summary
Snapshot
- This is a 3-bed/2.0-bath single-family listed at $86k. Condition is rated good.
Deal economics
- At list price, monthly cash flow is $326 ($4k/yr) — positive.
- The deal already cash-flows at list — no discount required.
- Meets the 1% rule at list price ($2k rent vs $86k).
- Recommended offer: $76k (12.0% below list) — sets the bar for market timing.
- Cap rate 10.8% vs local median 3.8% in Lexington-Fayette — top-decile yield for the area; either an underpriced asset or a hidden risk that comps aren't pricing in. Stress-test before assuming the spread holds.
Location & tenants
- Location reads: area grade B — affects rentability + tenant quality, not the cash-flow math above.
- Scott County (town): math 32% / reading 44% proficiency, ranked #31 of 165 in KY (top 19%) — families likely to look elsewhere, expect single-tenant / working-renter base with shorter leases.
- Market conditions: Rents rising (+3.0%/yr); 441 active listings in the ZIP; solid renter incomes; 546 units permitted in Scott County in 2024 (98 in 5+ unit buildings).
Forward outlook
- Local home prices are declining (-3.0%/yr); year-one equity from $594 of loan paydown is wiped out by about $3k of value loss. Plan a longer hold.
- Scott County population projected at +45% by 2050 — long-run rental-demand tailwind backs the buy-and-hold thesis.
- At projected returns (-3.0% appreciation + 3.0% rent growth), your $24k cash investment doubles in ~8 years — after that, you're playing with house money.
Negotiation context
- It's been on market 320 days — a 12% lower offer ($76k) is reasonable based on typical stale-listing flexibility.
Risks & watch-outs
- Watch-outs: HOA is 28% of rent.
Questions for the listing agent
- It's been on market 320 days. Have you received any prior offers? Is the seller open to a 12% concession, seller financing, or rate buy-down credit?
- What does the HOA fee cover, when was the last increase, and are there any pending special assessments or reserve-fund shortfalls?
- Why hasn't it sold? Are there any deal-killer items the seller is aware of (foundation, flood, title, zoning, code violations)?
- Is there a deadline driving the sale (1031 exchange, divorce, estate, relocation)? That informs how much negotiation room exists.
- What's the average days-on-market for RENTAL listings here right now (not sales)? A rising rental-DOM trend means longer vacancies and softer asking-rent achievability than the comps imply.
- What's the recent tenant-quality profile in this submarket — average credit score on applications, eviction rate, late-payment / NSF rate, and stable-employment percentage? A property-management company in the area should have these aggregated.
- How much new for-sale + rental construction is in the pipeline within 1–3 miles? Heavy new supply typically softens prices + rents 12–24 months out; constrained supply supports both.
Investment metrics
- 1% rule
- 2.09% ✓
- Cap rate
- 10.84%
- Cash-on-cash
- 16.24%
- DSCR
- 1.72
- GRM
- 4.0
CMA / ARV
No comps found within radius.
Projected returns pro-forma
-3.0% appreciation · 3.0% rent growth · sell at horizon
- IRR
- 7.6%
- Equity multiple
- 1.30×
- Total profit
- $7,158
- Equity at exit
- $12,822
- IRR
- 17.1%
- Equity multiple
- 2.43×
- Total profit
- $34,321
- Equity at exit
- $7,435
Cash invested: $24,079 (down + closing). Projections, not guarantees.
Landlord ↔ Tenant lean methodology
- Overall (STATE)
- 83 Strongly Landlord-Friendly
- State Kentucky
- 83 Strongly Landlord-Friendly · R+16
- County
- — inherits STATE
- City
- — inherits STATE
ZIP-level market 40324
- Rents YoY
- 3.0%
- Active inventory
- 441
- Price-to-rent
- 4.0×
Monthly cashflow live
- Estimated rent
- $1,798 medium interval (Pro) →
- Mortgage (P&I)
- −$451
- Tax est. 1.5%
- −$107 /mo · $1,290/yr
- Insurance
- −$36
- HOA
- −$500
- Vacancy / Maint / Mgmt
- −$378
- Net cashflow
- $326
Break-even live
UW: 25.0% down · 7.5% · 30yr · 1.5% tax · 5.0% vac · 8.0% maint · 8.0% mgmt
Financing live
Cash to close
- Down payment
- $21,499
- Closing costs
- $2,580
- Reserves months
- —
- Total cash needed
- —
Loan-product check · same deal, 3 products live
Conventional
25% down · 7.5% · 30yr
- Down + closing
- —
- Monthly P&I
- —
- Monthly cashflow
- —
- DSCR
- —
- Eligible?
- —
Personal DTI + credit; lowest rate.
DSCR
20% down · 8.5% · 30yr
- Down + closing
- —
- Monthly P&I
- —
- Monthly cashflow
- —
- DSCR
- —
- Eligible?
- —
No personal income docs; deal must DSCR.
Hard money
10% down · 12.0% · 12mo
- Down + closing
- —
- Monthly P&I
- —
- Monthly cashflow
- —
- DSCR
- —
- Eligible?
- —
Short-term bridge; refi at stabilization.
HOA detail
- Monthly dues
- $500 · $6,000/yr
Listing history 16 events
-
2026-06-18days on market $85,995 Active 320 DOM
-
2026-06-17days on market $85,995 Active 319 DOM
-
2026-06-16days on market $85,995 Active 318 DOM
-
2026-06-15days on market $85,995 Active 317 DOM
-
2026-06-14days on market $85,995 Active 315 DOM
-
2026-06-10days on market $85,995 Active 312 DOM
-
2026-06-09days on market $85,995 Active 311 DOM
-
2026-06-08days on market $85,995 Active 310 DOM
-
2026-06-07days on market $85,995 Active 309 DOM
-
2026-06-05days on market $85,995 Active 306 DOM
-
2026-06-03days on market $85,995 Active 305 DOM
-
2026-06-02days on market $85,995 Active 304 DOM
-
2026-06-01days on market $85,995 Active 303 DOM
-
2026-05-31days on market $85,995 Active 302 DOM
-
2026-05-31days on market $85,995 Active 301 DOM
-
2025-08-02$85,995 Active 630-char remark
Show marketing remark (630 chars)
Sawyier Pointe is a quiet, friendly community of attractive and affordable manufactured homes located in Georgetown, Kentucky. The community has a brand new playground, clubhouse and more! Located just near I-75 and I-64 in Central Kentucky near Lexington, the community is one exit from the famous Kentucky Horse Park along with many major employers. Our community property lies within the borders of both Fayette and Scott Counties. Please check with our office for your location school districts. Both Fayette and Scott Counties have highly rated public schools. Community Amenities Basketball Court, Clubhouse, and Playground
ⓘ Source: listings_history table (triggers on properties + properties_extension) + one-shot
backfill from property_details.listing_events for pre-trigger history.
Climate risk First Street
- Flood 1/10 Low FEMA zone X (unshaded) · 0% chance over 30 yrs
- Wildfire 3/10 Moderate
- Heat 4/10 Moderate 7 d/yr ≥102°F today · 19 d/yr by 30 yrs out
- Wind 2/10 Low 2% chance of damaging wind over 30 yrs
- Air quality 2/10 Low 0 unhealthy d/yr today · 1 by 30 yrs out
Nearby sold comps map
Loading sold comps map…
Walkable amenities ~0.75 mi
Loading nearby amenities…
Taxation est. · year 1
- Rental income
- $21,573
- − Mortgage interest
- −$4,817
- − Property taxes
- −$1,290
- − Insurance
- −$430
- − Repairs & maintenance
- −$1,726
- − Management
- −$1,726
- − HOA
- −$6,000
- − Depreciation
- −$2,502
- Taxable income
- $3,083
- Est. tax owed @ 24.0%
- −$740
- After-tax cash flow
- $3,171/yr
For passive investors: Depreciation is non-cash, so a rental often shows a tax loss while cash-flowing — sheltering income. Rental losses are passive: they offset passive income freely, and up to $25,000/yr can offset ordinary (W-2) income if you actively participate and your MAGI is under $100k (phasing out to $0 by $150k); unused losses carry forward. On sale, claimed depreciation is recaptured at up to 25%, and gains may owe capital-gains tax (a 1031 exchange can defer both). Figures are a year-1 estimate at your 24.0% rate — not tax advice; consult a CPA.
Condition & rehab AI · 6 photos
This manufactured home is in excellent condition with no visible repairs needed. It offers a good balance of curb appeal and interior features, making it a solid investment for both resale and rental markets.
Value-add opportunities
- Both Painting the exterior siding — Enhances curb appeal and can increase both resale and rental value.
- Both Landscaping improvements — Enhances curb appeal and can increase both resale and rental value.
- Both Adding a small front porch — Can increase both resale and rental value by adding a welcoming feature and increasing square footage.
- Resale Upgrading the kitchen appliances — Modernizes the kitchen and can increase resale value.
- Both Upgrading the HVAC system — Improves comfort and energy efficiency, increasing both resale and rental value.
Renovation cost estimate screening
Value-add ROI direction
- Both Painting the exterior siding — Enhances curb appeal and can increase both resale and rental value. ↑
- Both Landscaping improvements — Enhances curb appeal and can increase both resale and rental value. ↑
- Both Adding a small front porch — Can increase both resale and rental value by adding a welcoming feature and increasing square footage. ↑
- Resale Upgrading the kitchen appliances — Modernizes the kitchen and can increase resale value. ↑
- Both Upgrading the HVAC system — Improves comfort and energy efficiency, increasing both resale and rental value. ↑
ⓘ Cost ranges are severity-bucket heuristics (US national rule-of-thumb). Get contractor quotes + a written scope before underwriting a rehab budget.
Schools (NCES district)
- District
- Scott County
- NCES district ID
- 2105260
- Math proficiency
- 32% ▼ -14.00%
- Reading proficiency
- 44% ▼ -16.00%
- Median HH income
- $61,324
- Composite
- 33.87/100
- National rank
- #5348
- State rank
- #31 of 165 in KY
Livability — Lexington-Fayette
No livability data for this city. (Only ~50 U.S. cities are tracked.)
Census & demographics
- County
- Scott County · 53,406 people
- City population
- 321,882
- Metro
- Lexington-Fayette, KY
- Population (ZIP)
- 53,406
- Household income
- $85,110
- Rent vs Own
- Severe rent burden
- 993.0
Population outlook (Scott County) Hauer SSP2
- Today (2025)
- 63,814 people
- By 2030
- 69,637 · +9.1%
- By 2040
- 81,315 · +27.4%
- By 2050
- 92,677 · +45.2%
- By 2075
- 118,956 · +86.4%
- By 2100
- 136,792 · +114.4%
Race, ethnicity, and origin ACS 2023
- Neighborhood character
- Predominantly White (83%)
- Race & ethnicity
- White 83% Hispanic / Latino 6% Two or more races 6% Black 5%
- Hispanic origin (detail)
- Mexican 4%
- Common ancestry
- Italian 2% Serbian 2% Slovak 2%
- Foreign-born
- 3% · Canada
- Languages at home
- 94% English-only · Spanish 4%
Political lean MEDSL · Scott
- 2024 margin
- Strong R (+27.7) · D 35.3% · R 63.0% · Other 1.7%
- 2008→2024 swing
- -7.1pp toward R · 2008: -20.6pp · 2024: -27.7pp
- All cycles
- 2024: R+27.7 2020: R+24.9 2016: R+30.4 2012: R+25.0 2008: R+20.6
Not yet ingested
- Civics
- —
Market trends
- HPI YoY
- ▼ -105.49%
- Current HPI
- 187.89
- Rent YoY
- ▲ 3.00%
- Metro
- Lexington-Fayette, KY
- State GDP YoY
- ▲ 1.81%
- F500 in state
- 4
Industry mix (Fortune 500 HQ in KY)
| Industry | F500 HQs | Revenue |
|---|---|---|
| Healthcare | 1 | $118B |
|
||
| Food / Beverage | 1 | $7B |
|
||
Price history
1 event — show timeline
- 2025-08-02 Listed $85,995 Zillow
Cash-flow waterfall
monthlySold comps — $/sqft
last 12 mo · ≤1 miLoading sold comps…