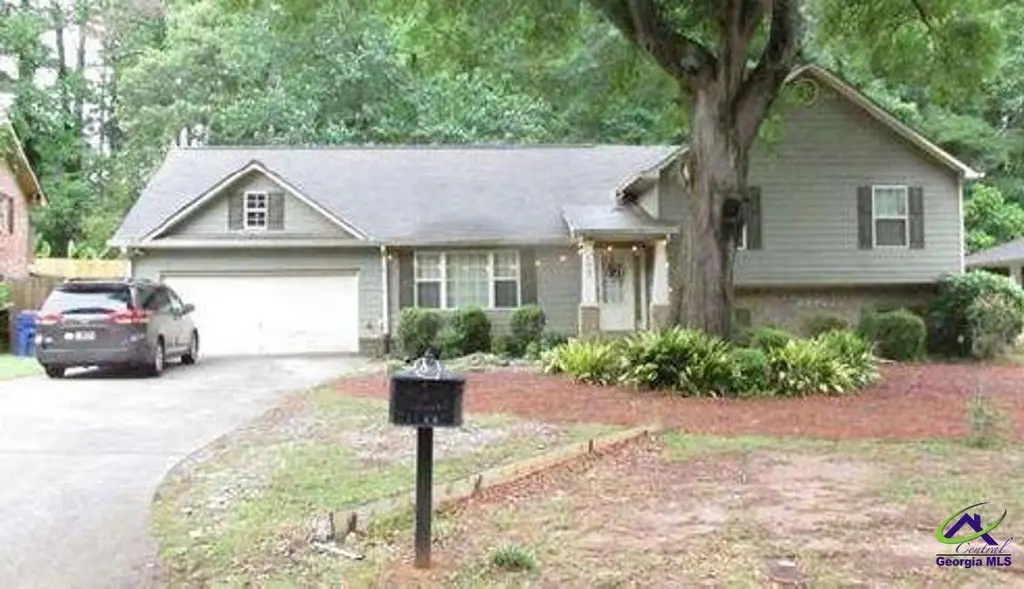
1060 Hilburn Dr · Atlanta, GA
Flood risk 6/10 · Moderate
- FEMA flood zone
- X (shaded)
- Chance of flooding over 30 yrs
- 0.75%
- Est. flood insurance / yr
- $507 – $1,088
Fire risk 1/10 · Minimal
- Est. fire insurance / yr
- $963 – $1,789
Heat risk 5/10 · Moderate
- Hot days now (above 104°F)
- 7 days/yr
- Hot days in 30 yrs
- 17 days/yr
Wind risk 4/10 · Minor
- Chance of severe wind over 30 yrs
- 22.0%
Air-quality risk 5/10 · Moderate
- Unhealthy air days now
- 6 days/yr
- Unhealthy air days in 30 yrs
- 8 days/yr
Risk factors via First Street. Map © Google.
Why this score? — see what drove the D+ grade
The composite is a weighted blend of 9 inputs, each scored 0–100. Each bar is that input's sub-score; the figure is the points it added to the 100-point composite (weight × sub-score).
- ARV discount +15.0/15.0
- Cash flow +14.3/30.0
- DSCR +4.3/10.0
- Livability +4.2/5.0
- 1% rule +3.2/10.0
- Rent growth +3.1/5.0
- Schools +2.7/10.0
- Condition / age +2.5/5.0
- Appreciation +0.0/10.0
$340,628
🖨 Deal sheet (PDF) 📄 Offer letter ✓ Due diligence
Listing remarks MLS
BRAND NEW CONSTRUCTION W/CRAFTSMAN ELEMENTS. HARDWOOD IN LIVING ROOM, KITCHEN AND DINING, HALLWAYS. BEAUTIFUL GRANITE COUNTERS & ISLAND,TUMBLE STONE BCKSPLASH.ENERGY SAVING NEW CONSTRUCTION.FENCED BCKYRD.HUGE OAK IN FRONT. 8 MIN. TO DWNTWN. PROFESS LANDSCPE. NEW CAR WITH FULL PRICE SALE!!
Key facts
- 0.27 acre lot
- 2 garage spots
- Built 2007
Property features AI
Exterior
- Parking: Detached garage with 2 covered parking spaces (2 total parking spaces)
- Utilities: Sewer: Unknown
- Home design: Single-family residence; One and one-half stories
- Construction: Slab foundation
- Exterior features: Lot approximately 0.27 acres
Interior
- Bathrooms: Three full bathrooms
- Heating & cooling: Has heating (details in remarks)
- Interior features: Crawl space basement
Neighborhood map
What this means for you Summary
Snapshot
- This is a 5-bed/3.0-bath single-family listed at $341k.
Deal economics
- At list price, monthly cash flow is $62 ($742/yr) — positive.
- The deal already cash-flows at list — no discount required.
- To meet the 1% rule (rent ≥ 1% of price), the offer needs to be $279k (18.2% below list).
- Recommended offer: $279k (18.2% below list) — sets the bar for 1% rule.
- Cap rate 6.5% vs local median 3.1% in Atlanta — top-decile yield for the area; either an underpriced asset or a hidden risk that comps aren't pricing in. Stress-test before assuming the spread holds.
Location & tenants
- Location reads 83/100 on livability (#6 in GA, #919 nationally) — a professional / high-income tenant draw. Strengths: amenities A+, commute A+, housing A+; Watch: cost of living C-.
- Atlanta Public Schools (urban): math 28% / reading 35% proficiency, ranked #80 of 174 in GA (top 46%) — families likely to look elsewhere, expect single-tenant / working-renter base with shorter leases; 71% free/reduced lunch — lower-income household profile, screen leases tightly.
- Zoned schools: Burgess-Peterson Elementary School (math 34% / reading 54%, grade F, #336 of 1,228 statewide, top 29%, 504 students, 31% FRL); Martin L. King Jr. Middle School (math 16% / reading 23%, grade F, #356 of 470 statewide, top 78%, 818 students, 100% FRL); Maynard Jackson High School (math 30% / reading 24%, grade F, #160 of 424 statewide, top 38%, 1,474 students, 44% FRL).
- Market conditions: Rents rising (+2.3%/yr); 470 active listings in the ZIP; 9 comparable units currently listed for rent nearby; rentals at typical pace (median 26d on market — plan ~3-4 weeks tenant-placement turnaround); solid renter incomes; 1,240 units permitted in DeKalb County in 2024 (385 in 5+ unit buildings).
- This rent runs 33% of the median local income ($103k/yr) — at the standard rent-burdened threshold; future hikes will face affordability resistance.
Forward outlook
- Local home prices are declining (-3.0%/yr); year-one equity from $2k of loan paydown is wiped out by about $10k of value loss. Plan a longer hold.
- DeKalb County population projected at +28% by 2050 — long-run rental-demand tailwind backs the buy-and-hold thesis.
Negotiation context
- Only 11 days on market — expect competitive offers; lowballing is unlikely to land.
- 2 sale attempts since 19y ago with the ask held roughly flat each time — persistent listings suggest the price (not the market) is what's stuck; bring a comps-based counter.
- Current owner paid $245k; 39% above their basis — modest negotiation headroom, anchor on the comps not their cost.
Risks & watch-outs
- Climate carrying-cost: major flood risk; extreme-heat days projected 7→17/yr by 2055 (HVAC capex compounding) — expect insurance premiums to compound above CPI over the hold.
Questions for the listing agent
- Is there a deadline driving the sale (1031 exchange, divorce, estate, relocation)? That informs how much negotiation room exists.
- The area grade is low — what's the realistic commute time and amenity access for the typical tenant pool here? Any planned neighborhood developments (good or bad) we should know about?
- What's the average days-on-market for RENTAL listings here right now (not sales)? A rising rental-DOM trend means longer vacancies and softer asking-rent achievability than the comps imply.
- What's the recent tenant-quality profile in this submarket — average credit score on applications, eviction rate, late-payment / NSF rate, and stable-employment percentage? A property-management company in the area should have these aggregated.
- How much new for-sale + rental construction is in the pipeline within 1–3 miles? Heavy new supply typically softens prices + rents 12–24 months out; constrained supply supports both.
Investment metrics
- 1% rule
- 0.82% ✗
- Cap rate
- 6.51%
- Cash-on-cash
- 0.78%
- DSCR
- 1.03
- GRM
- 10.2
CMA / ARV
- ARV (on-the-fly)
- $481,620
- Comps found
- 12
Show comp detail 12 sales within ~0.75 mi
| Address | Dist | Beds/Ba | Sqft | Sold | Price | $/sf | Match |
|---|---|---|---|---|---|---|---|
| 2078 Marshalls Ln SE | 0.29mi | 4/3.5 (-1) | 2,102 (+0%) | 11mo | $597,000 | $284 | 69 |
| 2209 Charleston Pointe SE | 0.13mi | 4/3.0 (-1) | 1,848 (-12%) | 2mo | $425,000 | $230 | 68 |
| 1025 Hilburn Dr SE | 0.08mi | 4/2.5 (-1) | 2,218 (+6%) | 19mo | $470,000 | $212 | 64 |
| 2437 Charleston Pointe Ct SE | 0.33mi | 4/3.0 (-1) | 1,850 (-12%) | 1mo | $310,500 | $168 | 59 |
| 1776 Valencia Rd | 0.45mi | 4/2.0 (-1) | 2,238 (+7%) | 4mo | $335,000 | $150 | 55 |
| 1977 Nash Ave SE | 0.56mi | 4/3.5 (-1) | 2,016 (-4%) | 12mo | $537,700 | $267 | 50 |
| 1684 Braeburn Dr SE | 0.75mi | 4/3.0 (-1) | 2,238 (+7%) | 9mo | $507,500 | $227 | 41 |
| 1705 Braeburn Dr SE | 0.70mi | 4/3.0 (-1) | 1,831 (-13%) | 2mo | $694,000 | $379 | 40 |
| 1378 Lochland Rd SE | 0.50mi | 4/3.0 (-1) | 2,371 (+13%) | 12mo | $625,000 | $264 | 39 |
| 1256 Fayetteville Rd SE | 0.49mi | 4/3.0 (-1) | 2,392 (+14%) | 14mo | $420,000 | $176 | 37 |
| 1721 Streamview Dr SE | 0.66mi | 5/3.5 | 2,376 (+14%) | 14mo | $565,000 | $238 | 33 |
| 1754 Streamview Dr SE | 0.65mi | 4/2.5 (-1) | 2,404 (+15%) | 19mo | $495,000 | $206 | 22 |
Match score weights: distance 35% · size 25% · config 20% · recency 20%. Top-matched comps best support the ARV.
Projected returns pro-forma
-3.0% appreciation · 2.33% rent growth · sell at horizon
- IRR
- -15.8%
- Equity multiple
- 0.44×
- Total profit
- $-53,215
- Equity at exit
- $50,789
- IRR
- -8.5%
- Equity multiple
- 0.48×
- Total profit
- $-49,189
- Equity at exit
- $29,451
Cash invested: $95,376 (down + closing). Projections, not guarantees.
Landlord ↔ Tenant lean methodology
- Overall (STATE)
- 90 Strongly Landlord-Friendly
- State Georgia
- 90 Strongly Landlord-Friendly · R+3
- County
- — inherits STATE
- City
- — inherits STATE
ZIP-level market 30316
- Rents YoY
- 2.3%
- Active inventory
- 470
- Price-to-rent
- 10.2×
Monthly cashflow live
- Estimated rent
- $2,787 high interval (Pro) →
- Mortgage (P&I)
- −$1,786
- Tax from tax record
- −$212 /mo · $2,540/yr
- Insurance
- −$142
- HOA
- −$0
- Vacancy / Maint / Mgmt
- −$585
- Net cashflow
- $62
Break-even live
Sensitivity live
| Price | -10% $255 | -5% $158 | +0% $62 | +5% $-35 | +10% $-131 |
|---|---|---|---|---|---|
| Rent | -10% $-158 | -5% $-48 | +0% $62 | +5% $172 | +10% $282 |
| Rate | -1.0pp $233 | -0.5pp $148 | base $62 | +0.5pp $-26 | +1.0pp $-116 |
UW: 25.0% down · 7.5% · 30yr · 1.5% tax · 5.0% vac · 8.0% maint · 8.0% mgmt
Financing live
Cash to close
- Down payment
- $85,157
- Closing costs
- $10,219
- Reserves months
- —
- Total cash needed
- —
Loan-product check · same deal, 3 products live
Conventional
25% down · 7.5% · 30yr
- Down + closing
- —
- Monthly P&I
- —
- Monthly cashflow
- —
- DSCR
- —
- Eligible?
- —
Personal DTI + credit; lowest rate.
DSCR
20% down · 8.5% · 30yr
- Down + closing
- —
- Monthly P&I
- —
- Monthly cashflow
- —
- DSCR
- —
- Eligible?
- —
No personal income docs; deal must DSCR.
Hard money
10% down · 12.0% · 12mo
- Down + closing
- —
- Monthly P&I
- —
- Monthly cashflow
- —
- DSCR
- —
- Eligible?
- —
Short-term bridge; refi at stabilization.
Rent comps 9 comps
| Address | Beds | Baths | Sqft | Rent | $/sqft | DOM | Units | Dist |
|---|---|---|---|---|---|---|---|---|
| 1932 Camellia Dr Decatur, GA | 4.0 | 3.0 | 2200 | $1,800 | $0.82 | 23d | 1 | 0.82mi |
| 1892 Terry Mill Rd SE Atlanta, GA | 4.0 | 2.0 | 1925 | $2,975 | $1.55 | 45d | 1 | 0.94mi |
| 2177 Wiggins Walk Atlanta, GA | 4.0 | 3.5 | 2489 | $3,000 | $1.21 | 45d | 1 | 1.07mi |
| 2181 Juanita St Decatur, GA | 4.0 | 3.0 | 1595 | $3,500 | $2.19 | 26d | 1 | 1.15mi |
| 2561 Lewfield Cir SE Atlanta, GA | 4.0 | 2.0 | 1528 | $1,950 | $1.28 | 14d | 1 | 1.23mi |
| 2657 Crestdale Cir SE Atlanta, GA | 4.0 | 1.5 | 1593 | $2,600 | $1.63 | 45d | 1 | 1.27mi |
| 1035 Moreland Ave SE Atlanta, GA | 4.0 | 3.0 | 2707 | $2,399 | $0.89 | 0d | 1 | 1.42mi |
| 1035 Moreland Ave SE Atlanta, GA | 4.0 | 3.0 | 2707 | $2,399 | $0.89 | 26d | 1 | 1.42mi |
| 2017 Memorial Dr SE Atlanta, GA | 5.0 | 2.5 | 2100 | $6,500 | $3.10 | 0d | 1 | 1.44mi |
Listing history 8 events
-
2026-06-21days on market $340,628 Active 11 DOM
-
2026-06-18days on market $340,628 Active 8 DOM
-
2026-06-17days on market $340,628 Active 7 DOM
-
2026-06-16days on market $340,628 Active 6 DOM
-
2026-06-15days on market $340,628 Active 5 DOM
-
2026-06-13days on market $340,628 Active 3 DOM
-
2026-06-13remarks 246-char remark
-
2026-06-13$340,628 Active 2 DOM
ⓘ Source: listings_history table (triggers on properties + properties_extension) + one-shot
backfill from property_details.listing_events for pre-trigger history.
Tax reassessment forecast GA · Resets to sale price
- Current annual tax
- $2,540 · $212/mo
- Projected year-2 tax
- $3,134 · $261/mo
- Expected delta
- +$594/yr (+$49/mo · 23.4%)
ⓘ Screening estimate from a state-policy table — verify with the county assessor before closing.
Climate risk First Street
- Flood 6/10 Major FEMA zone X (shaded) · 75% chance over 30 yrs
- Wildfire 1/10 Low
- Heat 5/10 Major 7 d/yr ≥104°F today · 17 d/yr by 30 yrs out
- Wind 4/10 Moderate 22% chance of damaging wind over 30 yrs
- Air quality 5/10 Major 6 unhealthy d/yr today · 8 by 30 yrs out
Nearby sold comps map
Loading sold comps map…
Walkable amenities ~0.75 mi
Loading nearby amenities…
Taxation est. · year 1
- Rental income
- $33,443
- − Mortgage interest
- −$19,080
- − Property taxes
- −$2,540
- − Insurance
- −$1,703
- − Repairs & maintenance
- −$2,675
- − Management
- −$2,675
- − Depreciation
- −$9,909
- Taxable loss
- −$5,140
- Est. tax savings @ 24.0%
- +$1,234
- After-tax cash flow
- $1,975/yr
For passive investors: Depreciation is non-cash, so a rental often shows a tax loss while cash-flowing — sheltering income. Rental losses are passive: they offset passive income freely, and up to $25,000/yr can offset ordinary (W-2) income if you actively participate and your MAGI is under $100k (phasing out to $0 by $150k); unused losses carry forward. On sale, claimed depreciation is recaptured at up to 25%, and gains may owe capital-gains tax (a 1031 exchange can defer both). Figures are a year-1 estimate at your 24.0% rate — not tax advice; consult a CPA.
Schools (NCES district)
- District
- Atlanta Public Schools
- NCES district ID
- 1300120
- Math proficiency
- 28% ▼ -6.00%
- Reading proficiency
- 35% ▼ -2.00%
- Median HH income
- $48,306
- Composite
- 27.27/100
- National rank
- #7006
- State rank
- #80 of 174 in GA
Livability — Atlanta
- Score
- 83/100
- State rank
- #6
- US rank
- #919
Category grades
Schools grade is shown separately in the Schools card above.
Census & demographics
- Census place
- Atlanta, GA
- County
- Dekalb County · 782,738 people
- City population
- 629,525
- Metro
- Atlanta-Sandy Springs-Alpharetta, GA
- Population (ZIP)
- 35,107
- Household income
- $102,891
- Rent vs Own
- Severe rent burden
- 1897.0
Population outlook (DeKalb County) Hauer SSP2
- Today (2025)
- 839,977 people
- By 2030
- 891,768 · +6.2%
- By 2040
- 988,894 · +17.7%
- By 2050
- 1,074,583 · +27.9%
- By 2075
- 1,245,026 · +48.2%
- By 2100
- 1,303,135 · +55.1%
Race, ethnicity, and origin ACS 2023
- Neighborhood character
- Diverse neighborhood (Simpson 0.64)
- Race & ethnicity
- Black 47% White 36% Hispanic / Latino 8% Two or more races 7% Asian 4%
- Hispanic origin (detail)
- Mexican 4%
- Common ancestry
- Lithuanian 2% Romanian 2% Slovak 1%
- Foreign-born
- 6% · Canada
- Languages at home
- 93% English-only · Spanish 4% French/Haitian/Cajun 1% Other Indo-European 1%
Political lean MEDSL · DeKalb
- 2024 margin
- Solid D (+64.8) · D 81.9% · R 17.1% · Other 1.0%
- 2008→2024 swing
- +6.1pp toward D · 2008: 58.6pp · 2024: 64.8pp
- All cycles
- 2024: D+64.8 2020: D+67.4 2016: D+64.8 2012: D+56.8 2008: D+58.6
Not yet ingested
- Civics
- —
Market trends
- HPI YoY
- ▼ -415.92%
- Current HPI
- 318.454
- Rent YoY
- ▲ 2.33%
- Metro
- Atlanta-Sandy Springs-Alpharetta, GA
- State GDP YoY
- ▲ 2.66%
- F500 in state
- 28
Industry mix (Fortune 500 HQ in GA)
| Industry | F500 HQs | Revenue |
|---|---|---|
| Paper / Packaging | 2 | $29B |
|
||
| Retail | 1 | $160B |
|
||
| Transportation / Logistics | 1 | $91B |
|
||
| Airlines | 1 | $62B |
|
||
| Consumer Goods | 1 | $47B |
|
||
| Utilities | 1 | $25B |
|
||
Price history
+325.8% since first listed6 events — show timeline
- 2026-06-11 Listed $340,628 CGMLS
- 2008-05-15 Sold (MLS) $244,900 FMLS
- 2007-11-13 Listed $259,900 FMLS
- 2007-09-06 Sold (Public Records) $35,000 Public Records
- 2002-03-20 Sold (Public Records) $151,500 Public Records
- 1995-06-05 Sold (Public Records) $80,000 Public Records
Property tax history
-3.3%/yrLatest (2025): $2,540 · +6.1% YoY. Source: county tax records.
Cash-flow waterfall
monthlySold comps — $/sqft
last 12 mo · ≤1 miLoading sold comps…