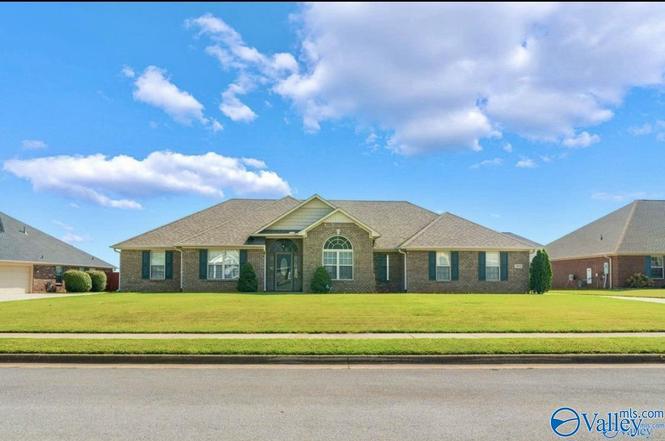
13196 Summerfield Dr · Athens, AL
Flood risk 1/10 · Minimal
- FEMA flood zone
- X (unshaded)
- Chance of flooding over 30 yrs
- 0.0%
- Est. flood insurance / yr
- $507 – $1,088
Fire risk 1/10 · Minimal
- Est. fire insurance / yr
- $916 – $1,700
Heat risk 6/10 · Moderate
- Hot days now (above 105°F)
- 7 days/yr
- Hot days in 30 yrs
- 20 days/yr
Wind risk 4/10 · Minor
- Chance of severe wind over 30 yrs
- 19.0%
Air-quality risk 2/10 · Minimal
- Unhealthy air days now
- 1 days/yr
- Unhealthy air days in 30 yrs
- 1 days/yr
Risk factors via First Street. Map © Google.
Why this score? — see what drove the D- grade
The composite is a weighted blend of 9 inputs, each scored 0–100. Each bar is that input's sub-score; the figure is the points it added to the 100-point composite (weight × sub-score).
- ARV discount +15.0/15.0
- Cash flow +8.8/30.0
- Livability +3.8/5.0
- Schools +2.8/10.0
- Rent growth +2.5/5.0
- Condition / age +2.5/5.0
- DSCR +2.4/10.0
- 1% rule +1.6/10.0
- Appreciation +0.0/10.0
$325,000
🖨 Deal sheet 📄 Offer letter ✓ Due diligence
Listing remarks
SHORT SALE !! You won't want to miss this opportunity, 4BR/3BA full brick home located just minutes from Mazda-Toyota and Amazon! Featuring elegant crown molding , a trey ceiling in the master suite with a whirlpool tub, and granit countertops in the kitchen. The home also includes a spacious side-entry garage and a fully fenced backyard- perfect for relaxing and entertaining. Enjoy access to Legacy Cove's community clubhouse, pool and tennis courts.
Key facts
- Trey ceiling
- Whirlpool tub
- Granite countertops
Tags
Neighborhood map
What this means for you Summary
Snapshot
- This is a 4-bed/3.0-bath single-family listed at $325k.
Deal economics
- At list price, monthly cash flow is $-270 ($-3k/yr) — negative.
- To cash-flow at today's rent, offer at most $277k (14.7% below list).
- To meet the 1% rule (rent ≥ 1% of price), the offer needs to be $213k (34.4% below list).
- Recommended offer: $213k (34.4% below list) — sets the bar for 1% rule.
- Cap rate 5.3% vs local median 3.6% in Athens — top-decile yield for the area; either an underpriced asset or a hidden risk that comps aren't pricing in. Stress-test before assuming the spread holds.
Location & tenants
- Location reads 75/100 on livability (#18 in AL, #4,019 nationally) — a middle-class / working-renter tenant base. Strengths: cost of living A+, housing A+, health & safety A+; Watch: employment C-, commute F.
- Limestone County (rural): math 21% / reading 44% proficiency, ranked #52 of 129 in AL (top 40%) — families likely to look elsewhere, expect single-tenant / working-renter base with shorter leases.
- Market conditions: 806 active listings in the ZIP; 11 comparable units currently listed for rent nearby; rentals at typical pace (median 21d on market — plan ~3-4 weeks tenant-placement turnaround); solid renter incomes; 494 units permitted in Limestone County in 2024 (0 in 5+ unit buildings).
Forward outlook
- Local home prices are declining (-3.0%/yr); year-one equity from $2k of loan paydown is wiped out by about $10k of value loss. Plan a longer hold.
- Limestone County population projected at +43% by 2050 — long-run rental-demand tailwind backs the buy-and-hold thesis.
Negotiation context
- It's been on market 200 days — a 12% lower offer ($286k) is reasonable based on typical stale-listing flexibility.
- 3 sale attempts since 7y ago; this cycle's ask has dropped $60k (16%) from the opening price — seller is motivated, your offer sets the floor, not the list.
Risks & watch-outs
- Climate carrying-cost: extreme-heat days projected 7→20/yr by 2055 (HVAC capex compounding) — expect insurance premiums to compound above CPI over the hold.
Questions for the listing agent
- What do current leases actually rent for vs. the listed asking? Can we see a recent rent roll and the last 12 months of T-12 income?
- It's been on market 200 days. Have you received any prior offers? Is the seller open to a 34% concession, seller financing, or rate buy-down credit?
- What does the HOA fee cover, when was the last increase, and are there any pending special assessments or reserve-fund shortfalls?
- Why hasn't it sold? Are there any deal-killer items the seller is aware of (foundation, flood, title, zoning, code violations)?
- Is there a deadline driving the sale (1031 exchange, divorce, estate, relocation)? That informs how much negotiation room exists.
- The area grade is low — what's the realistic commute time and amenity access for the typical tenant pool here? Any planned neighborhood developments (good or bad) we should know about?
- What's the average days-on-market for RENTAL listings here right now (not sales)? A rising rental-DOM trend means longer vacancies and softer asking-rent achievability than the comps imply.
- What's the recent tenant-quality profile in this submarket — average credit score on applications, eviction rate, late-payment / NSF rate, and stable-employment percentage? A property-management company in the area should have these aggregated.
- How much new for-sale + rental construction is in the pipeline within 1–3 miles? Heavy new supply typically softens prices + rents 12–24 months out; constrained supply supports both.
Investment metrics
- 1% rule
- 0.66% ✗
- Cap rate
- 5.30%
- Cash-on-cash
- -3.56%
- DSCR
- 0.84
- GRM
- 12.7
CMA / ARV
- ARV (median comp)
- $443,557
- List price
- $325,000
- Delta
- -26.73%
- Verdict
- UNDERPRICED
- Comps
- 20 within 1.0 mi
Show comp detail 12 sales within ~0.75 mi
| Address | Dist | Beds/Ba | Sqft | Sold | Price | $/sf | Match |
|---|---|---|---|---|---|---|---|
| 13399 Summerfield Dr | 0.20mi | 4/2.0 | 2,176 (+1%) | 9mo | $395,000 | $182 | 78 |
| 24722 Delilah Cir | 0.49mi | 4/3.0 | 2,031 (-6%) | 4mo | $285,000 | $140 | 64 |
| 13520 Arbor Rdg | 0.60mi | 4/3.0 | 2,263 (+5%) | 1mo | $375,000 | $166 | 63 |
| 13130 Hidden Valley Dr | 0.43mi | 3/2.0 (-1) | 2,265 (+5%) | 3mo | $375,000 | $166 | 60 |
| 13026 Breckenridge Dr | 0.30mi | 4/2.0 | 2,393 (+11%) | 4mo | $419,900 | $175 | 60 |
| 25090 Delilah Cir | 0.56mi | 4/2.0 | 2,335 (+8%) | 1mo | $325,000 | $139 | 55 |
| 27998 Cross Gate Dr | 0.57mi | 4/3.0 | 2,322 (+8%) | 7mo | $380,000 | $164 | 55 |
| 13205 Trumpet Dr | 0.47mi | 3/2.0 (-1) | 2,009 (-7%) | 8mo | $334,900 | $167 | 51 |
| 25104 Delilah Cir | 0.56mi | 4/2.0 | 1,884 (-13%) | 2mo | $285,000 | $151 | 47 |
| 26031 Apple Orchard Ln | 0.63mi | 3/3.5 (-1) | 2,381 (+10%) | 0mo | $401,650 | $169 | 46 |
| 13697 Callaway Dr | 0.61mi | 3/2.0 (-1) | 2,010 (-7%) | 7mo | $356,500 | $177 | 45 |
| 13091 Arbor Rdg | 0.44mi | 3/2.0 (-1) | 1,894 (-12%) | 8mo | $315,000 | $166 | 44 |
Match score weights: distance 35% · size 25% · config 20% · recency 20%. Top-matched comps best support the ARV.
Projected returns pro-forma
-3.0% appreciation · 3.0% rent growth · sell at horizon
- IRR
- -22.3%
- Equity multiple
- 0.23×
- Total profit
- $-70,023
- Equity at exit
- $48,459
- IRR
- -16.6%
- Equity multiple
- 0.08×
- Total profit
- $-83,734
- Equity at exit
- $28,100
Cash invested: $91,000 (down + closing). Projections, not guarantees.
Landlord ↔ Tenant lean methodology
- Overall (STATE)
- 90 Strongly Landlord-Friendly
- State Alabama
- 90 Strongly Landlord-Friendly · R+15
- County
- — inherits STATE
- City
- — inherits STATE
ZIP-level market 35613
- Home prices YoY
- -33.9%
- Active inventory
- 806
- Price-to-rent
- 12.7×
Monthly cashflow live
- Estimated rent
- $2,133 high interval (Pro) →
- Mortgage (P&I)
- −$1,704
- Tax from tax record
- −$86 /mo · $1,036/yr
- Insurance
- −$135
- HOA
- −$29
- Vacancy / Maint / Mgmt
- −$448
- Net cashflow
- $-270
Break-even live
UW: 25.0% down · 7.5% · 30yr · 1.5% tax · 5.0% vac · 8.0% maint · 8.0% mgmt
Financing live
Cash to close
- Down payment
- $81,250
- Closing costs
- $9,750
- Reserves months
- —
- Total cash needed
- —
Loan-product check · same deal, 3 products live
Conventional
25% down · 7.5% · 30yr
- Down + closing
- —
- Monthly P&I
- —
- Monthly cashflow
- —
- DSCR
- —
- Eligible?
- —
Personal DTI + credit; lowest rate.
DSCR
20% down · 8.5% · 30yr
- Down + closing
- —
- Monthly P&I
- —
- Monthly cashflow
- —
- DSCR
- —
- Eligible?
- —
No personal income docs; deal must DSCR.
Hard money
10% down · 12.0% · 12mo
- Down + closing
- —
- Monthly P&I
- —
- Monthly cashflow
- —
- DSCR
- —
- Eligible?
- —
Short-term bridge; refi at stabilization.
Rent comps 11 comps
| Address | Beds | Baths | Sqft | Rent | $/sqft | DOM | Units | Dist |
|---|---|---|---|---|---|---|---|---|
| 24809 Delilah Cir Athens, AL | 3.0 | 2.0 | 1683 | $1,800 | $1.07 | 43d | 1 | 0.46mi |
| 25090 Delilah Cir Athens, AL | 4.0 | 2.0 | 2335 | $1,995 | $0.85 | 23d | 1 | 0.57mi |
| 24663 Rolling Vista Dr Athens, AL | 3.0 | 2.0 | 1448 | $1,653 | $1.14 | 14d | 1 | 0.67mi |
| 12804 Hudbug Dr Madison, AL | 4.0 | 2.0 | 2314 | $2,250 | $0.97 | 14d | 1 | 0.88mi |
| 12392 Whitcomb Cir Athens, AL | 4.0 | 2.0 | 2106 | $2,150 | $1.02 | 21d | 1 | 0.89mi |
| 12660 Whitcomb Cir Athens, AL | 4.0 | 2.0 | 2106 | $1,950 | $0.93 | 43d | 1 | 0.90mi |
| 12821 Hudbug Dr Madison, AL | 4.0 | 2.0 | 2314 | $2,300 | $0.99 | 21d | 1 | 0.90mi |
| 12934 Tallulah Dr Madison, AL | 4.0 | 3.0 | 2058 | $2,050 | $1.00 | 43d | 1 | 0.95mi |
| 12786 Juniors Dr Madison, AL | 3.0 | 2.0 | 1745 | $1,995 | $1.14 | 14d | 1 | 0.95mi |
| 13546 Continental Rd Athens, AL | 3.0–4.0 | 2.0–2.5 | 1771 | $2,049 | $1.16 | 14d | 2 | 1.01mi |
| 26159 Valley Ridge Rd Madison, AL | 4.0 | 2.0 | 1631 | $1,845 | $1.13 | 23d | 1 | 1.35mi |
HOA detail
- Monthly dues
- $29 · $348/yr
- Likely covers
- pool
Listing history 15 events
-
2026-06-18days on market $325,000 Active 200 DOM
-
2026-06-17days on market $325,000 Active 199 DOM
-
2026-06-16statusdays on market $325,000 Active 198 DOM
-
2026-03-22price $325,000
-
2025-09-08price $355,000
-
2025-09-01$385,000 Active
-
2022-09-14soldstatus $374,000
-
2022-09-09soldstatus $374,000 Sold
-
2022-07-22status Pending
-
2022-06-16$374,000 Active
-
2022-04-26soldstatus $170,000
-
2019-04-25soldstatus $225,000 Sold
-
2019-04-25soldstatus $225,000
-
2019-03-26historical Contingent
-
2019-03-21$239,900 Active
ⓘ Source: listings_history table (triggers on properties + properties_extension) + one-shot
backfill from property_details.listing_events for pre-trigger history.
Tax reassessment forecast AL · Resets to sale price
- Current annual tax
- $1,036 · $86/mo
- Projected year-2 tax
- $1,332 · $111/mo
- Expected delta
- +$296/yr (+$25/mo · 28.6%)
ⓘ Screening estimate from a state-policy table — verify with the county assessor before closing.
Climate risk First Street
- Flood 1/10 Low FEMA zone X (unshaded) · 0% chance over 30 yrs
- Wildfire 1/10 Low
- Heat 6/10 Major 7 d/yr ≥105°F today · 20 d/yr by 30 yrs out
- Wind 4/10 Moderate 19% chance of damaging wind over 30 yrs
- Air quality 2/10 Low 1 unhealthy d/yr today · 1 by 30 yrs out
Nearby sold comps map
Loading sold comps map…
Walkable amenities ~0.75 mi
Loading nearby amenities…
Taxation est. · year 1
- Rental income
- $25,592
- − Mortgage interest
- −$18,205
- − Property taxes
- −$1,036
- − Insurance
- −$1,625
- − Repairs & maintenance
- −$2,047
- − Management
- −$2,047
- − HOA
- −$348
- − Depreciation
- −$9,455
- Taxable loss
- −$9,171
- Est. tax savings @ 24.0%
- +$2,201
- After-tax cash flow
- $-1,042/yr
For passive investors: Depreciation is non-cash, so a rental often shows a tax loss while cash-flowing — sheltering income. Rental losses are passive: they offset passive income freely, and up to $25,000/yr can offset ordinary (W-2) income if you actively participate and your MAGI is under $100k (phasing out to $0 by $150k); unused losses carry forward. On sale, claimed depreciation is recaptured at up to 25%, and gains may owe capital-gains tax (a 1031 exchange can defer both). Figures are a year-1 estimate at your 24.0% rate — not tax advice; consult a CPA.
Schools (NCES district)
- District
- Limestone County
- NCES district ID
- 0102100
- Math proficiency
- 21% ▼ -23.00%
- Reading proficiency
- 44% ▼ -3.00%
- Median HH income
- $48,972
- Composite
- 28.09/100
- National rank
- #6829
- State rank
- #52 of 129 in AL
Livability — Athens
- Score
- 75/100
- State rank
- #18
- US rank
- #4019
Category grades
Schools grade is shown separately in the Schools card above.
Census & demographics
- County
- Limestone County · 80,439 people
- City population
- 55,492
- Metro
- Huntsville, AL
- Population (ZIP)
- 25,523
- Household income
- $100,845
- Rent vs Own
- Severe rent burden
- 118.0
Population outlook (Limestone County) Hauer SSP2
- Today (2025)
- 111,441 people
- By 2030
- 121,272 · +8.8%
- By 2040
- 140,705 · +26.3%
- By 2050
- 159,069 · +42.7%
- By 2075
- 202,231 · +81.5%
- By 2100
- 230,608 · +106.9%
Race, ethnicity, and origin ACS 2023
- Neighborhood character
- Predominantly White (83%)
- Race & ethnicity
- White 83% Black 7% Hispanic / Latino 5% Two or more races 5%
- Hispanic origin (detail)
- Mexican 4%
- Common ancestry
- Slovak 3% Lithuanian 2% Romanian 2%
- Foreign-born
- 3% · Canada
- Languages at home
- 96% English-only · Spanish 3% Vietnamese 1%
Political lean MEDSL · Limestone
- 2024 margin
- Solid R (+43.9) · D 27.5% · R 71.4% · Other 1.2%
- 2008→2024 swing
- -2.0pp toward R · 2008: -41.9pp · 2024: -43.9pp
- All cycles
- 2024: R+43.9 2020: R+42.6 2016: R+49.5 2012: R+43.6 2008: R+41.9
Not yet ingested
- Civics
- —
Market trends
- HPI YoY
- ▼ -88.56%
- Current HPI
- 173.0763
- Rent YoY
- —
- Metro
- Huntsville, AL
- State GDP YoY
- ▲ 2.94%
- F500 in state
- 4
Industry mix (Fortune 500 HQ in AL)
| Industry | F500 HQs | Revenue |
|---|---|---|
| Financial Services | 1 | $8B |
|
||
| Healthcare | 1 | $5B |
|
||
Price history
+35.5% since first listed12 events — show timeline
- 2026-03-22 Price Changed $325,000 VMLS
- 2025-09-08 Price Changed $355,000 VMLS
- 2025-09-01 Listed $385,000 VMLS
- 2022-09-14 Sold (Public Records) $374,000 Public Records
- 2022-09-09 Sold (MLS) $374,000 VMLS
- 2022-07-22 Pending — VMLS
- 2022-06-16 Listed $374,000 VMLS
- 2022-04-26 Sold (Public Records) $170,000 Public Records
- 2019-04-25 Sold (Public Records) $225,000 Public Records
- 2019-04-25 Sold (MLS) $225,000 VMLS
- 2019-03-26 Contingent — VMLS
- 2019-03-21 Listed $239,900 VMLS
Property tax history
+5.1%/yrLatest (2025): $1,036 · +0.5% YoY. Source: county tax records.
Cash-flow waterfall
monthlySold comps — $/sqft
last 12 mo · ≤1 miLoading sold comps…