 Multi-family
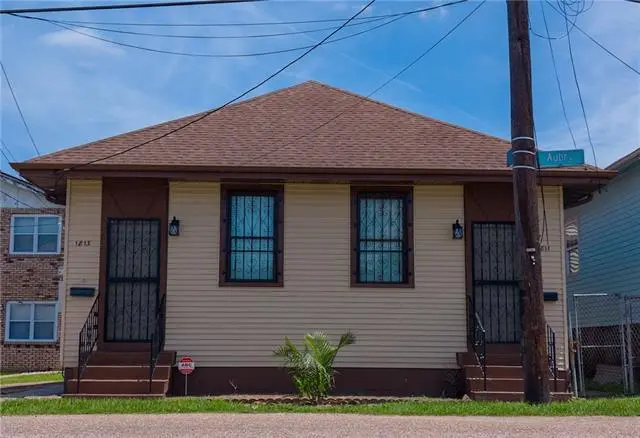
1811-13 Aubry St · New Orleans, LA
Flood risk 8/10 · Major
- FEMA flood zone
- X (shaded)
- Chance of flooding over 30 yrs
- 0.75%
- Est. flood insurance / yr
- $507 – $1,088
Fire risk 1/10 · Minimal
- Est. fire insurance / yr
- $1,269 – $2,357
Heat risk 10/10 · Severe
- Hot days now (above 108°F)
- 7 days/yr
- Hot days in 30 yrs
- 21 days/yr
Wind risk 10/10 · Severe
- Chance of severe wind over 30 yrs
- 99.0%
Air-quality risk 4/10 · Minor
- Unhealthy air days now
- 4 days/yr
- Unhealthy air days in 30 yrs
- 4 days/yr
Risk factors via First Street. Map © Google.
Why this score? — see what drove the C+ grade
The composite is a weighted blend of 9 inputs, each scored 0–100. Each bar is that input's sub-score; the figure is the points it added to the 100-point composite (weight × sub-score).
- Cash flow +29.4/30.0
- DSCR +10.0/10.0
- 1% rule +7.7/10.0
- ARV discount +5.5/15.0
- Livability +4.0/5.0
- Rent growth +2.5/5.0
- Condition / age +2.5/5.0
- Schools +1.6/10.0
- Appreciation +0.0/10.0
$231,000
🖨 Deal sheet 📄 Offer letter ✓ Due diligence
Multi-family units
County records classify this as Multi-Family (2-4 Unit). Listing-text estimate: 1 unit. estimate disagrees with records
Listing remarks
Located in the heart of the famous seventh ward, in a distinct area known as "The Cut", you will find this well maintained double. A ten minute drive from the notable French Quarters, Fair Grounds, and City Park. This New Orleans style double, has served only one family, for nearly a century!! The charm of the original bones, in combination with modern updates gives the classic New Orleans feel without the worry. Inside the two homes, you will find an adjoining door allowing you to access each individual home without exiting the property. Throughout the property, you will find fresh paint, newly installed light fixtures, updated bathrooms and more. In addition to the indoor space,
Key facts
- 2,480 sq ft lot
- Listed 42 days
Property features AI
Exterior
- Home design: Duplex; 2 total units
- Construction: Other construction materials
- Exterior features: Composition roof
Interior
- Heating & cooling: Central heating; Additional/other heating; Central air conditioning; Window unit(s)
- Interior features: Central heating and cooling; Window air conditioning units
Neighborhood map
What this means for you Summary
Snapshot
- This is a 8-bed/2.0-bath multifamily listed at $231k.
Deal economics
- At list price, monthly cash flow is $755 ($9k/yr) — positive.
- The deal already cash-flows at list — no discount required.
- Meets the 1% rule at list price ($3k rent vs $231k).
- Recommended offer: $224k (3.0% below list) — sets the bar for market timing.
- Cap rate 10.6% vs local median 4.4% in New Orleans — top-decile yield for the area; either an underpriced asset or a hidden risk that comps aren't pricing in. Stress-test before assuming the spread holds.
Location & tenants
- Location reads 81/100 on livability (#3 in LA, #1,383 nationally) — a professional / high-income tenant draw. Strengths: amenities A+, commute A+, health & safety A+; Watch: crime C-, employment D.
- Orleans Parish (urban): math 11% / reading 27% proficiency, ranked #69 of 98 in LA (top 70%) — low school quality limits family demand, transient renter base, plan for 1-2y turnover; 68% free/reduced lunch — lower-income household profile, screen leases tightly.
- Market conditions: Rents flat; 350 active listings in the ZIP; 710 units permitted in Orleans Parish in 2024 (244 in 5+ unit buildings).
- At $2,935/mo this rent would consume 67% of the median local household income ($52k/yr) (locally 1001% of renters already pay >50% of income on rent) — very limited rent-growth headroom before tenants either downsize or default.
Forward outlook
- Local home prices are declining (-3.0%/yr); year-one equity from $2k of loan paydown is wiped out by about $7k of value loss. Plan a longer hold.
- Orleans County population projected at +61% by 2050 — long-run rental-demand tailwind backs the buy-and-hold thesis.
Negotiation context
- It's been on market 42 days — a 3% lower offer ($224k) is reasonable based on typical stale-listing flexibility.
- 2 sale attempts with the ask held roughly flat each time — persistent listings suggest the price (not the market) is what's stuck; bring a comps-based counter.
Risks & watch-outs
- Watch-outs: flood insurance adds $66/mo; built in 1950 — expect roof / HVAC / electrical / plumbing capex.
- Climate carrying-cost: severe flood risk; severe wind risk, 99% chance of damaging wind over 30y; extreme-heat days projected 7→21/yr by 2055 (HVAC capex compounding) — expect insurance premiums to compound above CPI over the hold.
Questions for the listing agent
- It's been on market 42 days. Have you received any prior offers? Is the seller open to a 3% concession, seller financing, or rate buy-down credit?
- Built in 1950 — when were the roof, HVAC, electrical panel, plumbing, and water heater last replaced?
- What's the actual annual flood-insurance premium (NFIP or private), and is the property in a SFHA with mandatory coverage?
- Is there a deadline driving the sale (1031 exchange, divorce, estate, relocation)? That informs how much negotiation room exists.
- What's the average days-on-market for RENTAL listings here right now (not sales)? A rising rental-DOM trend means longer vacancies and softer asking-rent achievability than the comps imply.
- What's the recent tenant-quality profile in this submarket — average credit score on applications, eviction rate, late-payment / NSF rate, and stable-employment percentage? A property-management company in the area should have these aggregated.
- How much new apartment / multifamily construction is in the pipeline within 1–3 miles? Heavy new supply (>2% of stock underway) typically softens rents 12–24 months out; light construction supports rent growth.
Investment metrics
- 1% rule
- 1.27% ✓
- Cap rate
- 10.56%
- Cash-on-cash
- 15.25%
- DSCR
- 1.68
- GRM
- 6.6
CMA / ARV
- ARV (median comp)
- $221,379
- List price
- $231,000
- Delta
- 4.35%
- Verdict
- FAIR
- Comps
- 20 within 1.0 mi
Show comp detail 2 sales within ~0.75 mi
| Address | Dist | Beds/Ba | Sqft | Sold | Price | $/sf | Match |
|---|---|---|---|---|---|---|---|
| 2256 58 N Villere St | 0.71mi | 8/2.0 | 1,800 (-3%) | 18mo | $165,000 | $92 | 47 |
| 2517 Lapeyrouse St | 0.53mi | 8/— | 2,057 (+11%) | 23mo | $151,500 | $74 | 38 |
Match score weights: distance 35% · size 25% · config 20% · recency 20%. Top-matched comps best support the ARV.
Projected returns pro-forma
-3.0% appreciation · 0.18% rent growth · sell at horizon
- IRR
- 1.1%
- Equity multiple
- 1.04×
- Total profit
- $2,601
- Equity at exit
- $34,443
- IRR
- 7.7%
- Equity multiple
- 1.51×
- Total profit
- $32,896
- Equity at exit
- $19,973
Cash invested: $64,680 (down + closing). Projections, not guarantees.
Landlord ↔ Tenant lean methodology
- Overall (STATE)
- 90 Strongly Landlord-Friendly
- State Louisiana
- 90 Strongly Landlord-Friendly · R+12
- County
- — inherits STATE
- City
- — inherits STATE
ZIP-level market 70116
- Home prices YoY
- -34.5%
- Rents YoY
- 0.2%
- Active inventory
- 350
- Price-to-rent
- 13.1×
Monthly cashflow live
- Estimated rent
- $2,935 high interval (Pro) →
- Mortgage (P&I)
- −$1,211
- Tax from tax record
- −$189 /mo · $2,270/yr
- Insurance
- −$96
- Flood insurance flood zone
- −$66 /mo · $798/yr
- HOA
- −$0
- Vacancy / Maint / Mgmt
- −$616
- Net cashflow
- $755
Break-even live
2-unit breakdown (identical units grouped — click to expand)
| Units | Beds | Baths | Est. rent |
|---|---|---|---|
| 2× units | 2 | 1 | $2,936 |
| #1 | 2 | 1 | $1,468 |
| #2 | 2 | 1 | $1,468 |
| Total (2 units) | $2,935 | ||
UW: 25.0% down · 7.5% · 30yr · 1.5% tax · 5.0% vac · 8.0% maint · 8.0% mgmt
Financing live
Cash to close
- Down payment
- $57,750
- Closing costs
- $6,930
- Reserves months
- —
- Total cash needed
- —
Loan-product check · same deal, 3 products live
Conventional
25% down · 7.5% · 30yr
- Down + closing
- —
- Monthly P&I
- —
- Monthly cashflow
- —
- DSCR
- —
- Eligible?
- —
Personal DTI + credit; lowest rate.
DSCR
20% down · 8.5% · 30yr
- Down + closing
- —
- Monthly P&I
- —
- Monthly cashflow
- —
- DSCR
- —
- Eligible?
- —
No personal income docs; deal must DSCR.
Hard money
10% down · 12.0% · 12mo
- Down + closing
- —
- Monthly P&I
- —
- Monthly cashflow
- —
- DSCR
- —
- Eligible?
- —
Short-term bridge; refi at stabilization.
Listing history 16 events
-
2026-06-18days on market $231,000 Active 42 DOM
-
2026-06-17days on market $231,000 Active 41 DOM
-
2026-06-16days on market $231,000 Active 40 DOM
-
2026-06-15days on market $231,000 Active 39 DOM
-
2026-06-13days on market $231,000 Active 37 DOM
-
2026-06-10days on market $231,000 Active 34 DOM
-
2026-06-09days on market $231,000 Active 33 DOM
-
2026-06-08days on market $231,000 Active 32 DOM
-
2026-06-07days on market $231,000 Active 31 DOM
-
2026-06-05days on market $231,000 Active 28 DOM
-
2026-06-03days on market $231,000 Active 27 DOM
-
2026-06-02days on market $231,000 Active 26 DOM
-
2026-06-01days on market $231,000 Active 25 DOM
-
2026-05-31days on market $231,000 Active 24 DOM
-
2026-05-07$231,000 Active 991-char remark
-
2025-05-24$250,000 Active
ⓘ Source: listings_history table (triggers on properties + properties_extension) + one-shot
backfill from property_details.listing_events for pre-trigger history.
Tax reassessment forecast LA · Resets to sale price
- Current annual tax
- $2,270 · $189/mo
- Projected year-2 tax
- $2,270 · $189/mo
- Expected delta
- $0/yr ($0/mo · 0.0%)
ⓘ Screening estimate from a state-policy table — verify with the county assessor before closing.
Climate risk First Street
- Flood 8/10 Severe FEMA zone X (shaded) · 75% chance over 30 yrs
- Wildfire 1/10 Low
- Heat 10/10 Extreme 7 d/yr ≥108°F today · 21 d/yr by 30 yrs out
- Wind 10/10 Extreme 99% chance of damaging wind over 30 yrs
- Air quality 4/10 Moderate 4 unhealthy d/yr today · 4 by 30 yrs out
Nearby sold comps map
Loading sold comps map…
Walkable amenities ~0.75 mi
Loading nearby amenities…
Taxation est. · year 1
- Rental income
- $35,220
- − Mortgage interest
- −$12,940
- − Property taxes
- −$2,270
- − Insurance
- −$1,952
- − Repairs & maintenance
- −$2,818
- − Management
- −$2,818
- − Depreciation
- −$6,720
- Taxable income
- $5,702
- Est. tax owed @ 24.0%
- −$1,369
- After-tax cash flow
- $7,696/yr
For passive investors: Depreciation is non-cash, so a rental often shows a tax loss while cash-flowing — sheltering income. Rental losses are passive: they offset passive income freely, and up to $25,000/yr can offset ordinary (W-2) income if you actively participate and your MAGI is under $100k (phasing out to $0 by $150k); unused losses carry forward. On sale, claimed depreciation is recaptured at up to 25%, and gains may owe capital-gains tax (a 1031 exchange can defer both). Figures are a year-1 estimate at your 24.0% rate — not tax advice; consult a CPA.
Schools (NCES district)
- District
- Orleans Parish
- NCES district ID
- 2201170
- Math proficiency
- 11% ▼ -52.00%
- Reading proficiency
- 27% ▼ -46.00%
- Median HH income
- $37,011
- Composite
- 15.78/100
- National rank
- #9271
- State rank
- #69 of 98 in LA
Livability — New Orleans
- Score
- 81/100
- State rank
- #3
- US rank
- #1383
Category grades
Schools grade is shown separately in the Schools card above.
Census & demographics
- Census place
- New Orleans, LA
- County
- Orleans Parish · 338,817 people
- City population
- 338,817
- Metro
- New Orleans-Metairie, LA
- Population (ZIP)
- 10,404
- Household income
- $52,306
- Rent vs Own
- Severe rent burden
- 1001.0
Population outlook (Orleans County) Hauer SSP2
- Today (2025)
- 513,025 people
- By 2030
- 575,781 · +12.2%
- By 2040
- 700,174 · +36.5%
- By 2050
- 826,541 · +61.1%
- By 2075
- 1,123,374 · +119.0%
- By 2100
- 1,355,609 · +164.2%
Race, ethnicity, and origin ACS 2023
- Neighborhood character
- Diverse neighborhood (Simpson 0.63)
- Race & ethnicity
- White 45% Black 40% Hispanic / Latino 10% Two or more races 8%
- Hispanic origin (detail)
- Mexican 1% Cuban 3%
- Common ancestry
- Lithuanian 6% Slovak 3% Romanian 3%
- Foreign-born
- 5% · Canada
- Languages at home
- 90% English-only · Spanish 6% French/Haitian/Cajun 2%
Political lean MEDSL · Orleans
- 2024 margin
- Solid D (+67.0) · D 82.2% · R 15.2% · Other 2.7%
- 2008→2024 swing
- +6.7pp toward D · 2008: 60.3pp · 2024: 67.0pp
- All cycles
- 2024: D+67.0 2020: D+68.2 2016: D+66.2 2012: D+62.5 2008: D+60.3
Not yet ingested
- Civics
- —
Market trends
- HPI YoY
- ▼ -144.83%
- Current HPI
- 275.5453
- Rent YoY
- ▲ 0.18%
- Metro
- New Orleans-Metairie, LA
- State GDP YoY
- ▲ 3.29%
- F500 in state
- 10
Industry mix (Fortune 500 HQ in LA)
| Industry | F500 HQs | Revenue |
|---|---|---|
| Telecommunications | 2 | $23B |
|
||
| Utilities | 1 | $12B |
|
||
| Wholesale / Distribution | 1 | $5B |
|
||
| Advertising | 1 | $2B |
|
||
Price history
-7.6% since first listed2 events — show timeline
- 2026-05-07 Listed $231,000 AcadianaMLS
- 2025-05-24 Listed $250,000 AcadianaMLS
Property tax history
+33.9%/yrLatest (2026): $2,270 · +1.1% YoY. Source: county tax records.
Cash-flow waterfall
monthlySold comps — $/sqft
last 12 mo · ≤1 miLoading sold comps…