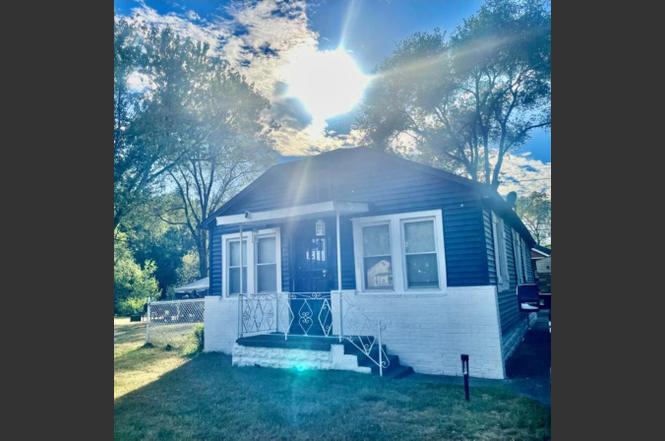
1166 Mount St · Gary, IN
Flood risk 4/10 · Minor
- FEMA flood zone
- X (unshaded)
- Chance of flooding over 30 yrs
- 0.22%
- Est. flood insurance / yr
- $473 – $860
Fire risk 1/10 · Minimal
- Est. fire insurance / yr
- $717 – $1,331
Heat risk 3/10 · Minor
- Hot days now (above 103°F)
- 7 days/yr
- Hot days in 30 yrs
- 15 days/yr
Wind risk 2/10 · Minimal
- Chance of severe wind over 30 yrs
- 1.0%
Air-quality risk 4/10 · Minor
- Unhealthy air days now
- 5 days/yr
- Unhealthy air days in 30 yrs
- 6 days/yr
Risk factors via First Street. Map © Google.
Why this score? — see what drove the B- grade
The composite is a weighted blend of 9 inputs, each scored 0–100. Each bar is that input's sub-score; the figure is the points it added to the 100-point composite (weight × sub-score).
- Cash flow +28.1/30.0
- DSCR +10.0/10.0
- ARV discount +7.5/15.0
- 1% rule +6.6/10.0
- Appreciation +5.6/10.0
- Livability +3.7/5.0
- Rent growth +2.5/5.0
- Condition / age +2.5/5.0
- Schools +0.5/10.0
$109,900
🖨 Deal sheet 📄 Offer letter ✓ Due diligence
Listing remarks MLS
Price Reduced!Step into this beautifully updated 2-bedroom, 1-bathroom bungalow, perfectly situated in the heart of Gary, IN. This home effortlessly blends timeless charm with modern updates, making it a cozy retreat that's move-in ready. What Makes This Home Special?A sleek and stylish kitchen featuring stainless steel appliances: refrigerator, stove, microwave, dishwasher, washer, and dryer--all included!Bright, inviting living spaces with modern finishes and thoughtful updates throughout. BONUS: The seller is offering $7,500 towards updates or closing costs! Use it to customize this home to fit your vision. This property is a perfect match for anyone seeking comfort and value! Don't wait--schedule your showing today!
Key facts
- Full basement
- 0.3 acre lot
- Built 1926
Tags
Property features AI
Exterior
- Parking: Driveway parking
- Security: Carbon monoxide detector(s); Fire alarm
- Utilities: Public water; No sewer information listed
- Home design: One-level home; Built in 1926; Entry level: main
- Construction: Aluminum siding and brick exterior; Shingle roof; Unfinished basement
- Exterior features: Neighborhood view
Interior
- Kitchen: No appliances listed
- Bedrooms: Primary bedroom; Second bedroom
- Flooring: Laminate flooring
- Bathrooms: 1 full bathroom
- Heating & cooling: Forced air heating; No cooling system
- Interior features: Ceiling fan(s); Carbon monoxide and fire alarms
- Laundry & utility: No laundry appliances listed
Neighborhood map
What this means for you Summary
Snapshot
- This is a 2-bed/1.0-bath single-family listed at $110k.
Deal economics
- At list price, monthly cash flow is $345 ($4k/yr) — positive.
- The deal already cash-flows at list — no discount required.
- Meets the 1% rule at list price ($1k rent vs $110k).
Location & tenants
- Location reads 73/100 on livability (#105 in IN) — a middle-class / working-renter tenant base. Strengths: commute A+, cost of living A+, housing A+; Watch: schools F, crime F, employment F.
- Gary Community School Corporation (urban): math 3% / reading 11% proficiency, ranked #299 of 301 in IN (top 99%) — low school quality limits family demand, transient renter base, plan for 1-2y turnover; 80% free/reduced lunch — lower-income household profile, screen leases tightly.
- Market conditions: 54 active listings in the ZIP; 8 comparable units currently listed for rent nearby; rentals leasing fast (median 2d on market — plan ~1-2 weeks tenant-placement turnaround); 1,642 units permitted in Lake County in 2024 (14 in 5+ unit buildings).
Forward outlook
- In year one you build about $2k of equity ($760 loan paydown + $1k appreciation (1.3% local appreciation)).
- Lake County population projected to shrink 7% by 2050 — rents likely to lag national; underwrite the cash flow, not the appreciation.
- At projected returns (1.3% appreciation + 3.0% rent growth), your $31k cash investment doubles in ~5 years — after that, you're playing with house money.
Negotiation context
- Only 3 days on market — expect competitive offers; lowballing is unlikely to land.
- 6 sale attempts since 3y ago with the ask held roughly flat each time — persistent listings suggest the price (not the market) is what's stuck; bring a comps-based counter.
- Current owner paid $65k; list at $110k implies a 69% gain — meaningful room to come down on a strong offer.
Risks & watch-outs
- Watch-outs: built in 1926 — expect roof / HVAC / electrical / plumbing capex.
Questions for the listing agent
- Built in 1926 — when were the roof, HVAC, electrical panel, plumbing, and water heater last replaced?
- Is there a deadline driving the sale (1031 exchange, divorce, estate, relocation)? That informs how much negotiation room exists.
- Schools are F-rated, which usually means shorter tenancies and higher turnover. Who's the typical renter profile here, and what's been the actual vacancy rate?
- Crime grade is F in this area — have there been break-ins, vandalism, or insurance claims at this property in the last 3 years? What carrier currently insures it and at what premium?
- What's the average days-on-market for RENTAL listings here right now (not sales)? A rising rental-DOM trend means longer vacancies and softer asking-rent achievability than the comps imply.
- What's the recent tenant-quality profile in this submarket — average credit score on applications, eviction rate, late-payment / NSF rate, and stable-employment percentage? A property-management company in the area should have these aggregated.
- How much new for-sale + rental construction is in the pipeline within 1–3 miles? Heavy new supply typically softens prices + rents 12–24 months out; constrained supply supports both.
Investment metrics
- 1% rule
- 1.16% ✓
- Cap rate
- 10.06%
- Cash-on-cash
- 13.45%
- DSCR
- 1.60
- GRM
- 7.2
CMA / ARV
- ARV (on-the-fly)
- $63,000
- Comps found
- 12
Show comp detail 12 sales within ~0.75 mi
| Address | Dist | Beds/Ba | Sqft | Sold | Price | $/sf | Match |
|---|---|---|---|---|---|---|---|
| 1125 Durbin St | 0.06mi | 2/2.5 | 814 (-3%) | 1mo | $32,500 | $40 | 85 |
| 1075 Mount St | 0.13mi | 3/1.0 (+1) | 884 (+5%) | 2mo | $70,000 | $79 | 79 |
| 1000 Durbin St | 0.21mi | 2/1.0 | 780 (-7%) | 5mo | $89,900 | $115 | 74 |
| 1168 Hovey St | 0.13mi | 2/1.0 | 931 (+11%) | 4mo | $42,000 | $45 | 73 |
| 771 Durbin St | 0.48mi | 2/1.5 | 864 (+3%) | 2mo | $65,000 | $75 | 69 |
| 942 Durbin St | 0.28mi | 2/1.0 | 780 (-7%) | 10mo | $45,000 | $58 | 66 |
| 4633 W 11th Ave | 0.23mi | 2/1.0 | 720 (-14%) | 1mo | $65,000 | $90 | 64 |
| 973 Williams St | 0.43mi | 2/1.0 | 916 (+9%) | 1mo | $55,000 | $60 | 64 |
| 972 Durbin St | 0.24mi | 3/1.0 (+1) | 780 (-7%) | 11mo | $40,000 | $51 | 62 |
| 794 Porter St | 0.48mi | 2/2.0 | 768 (-9%) | 5mo | $57,000 | $74 | 55 |
| 4317 W 19th Plz | 0.66mi | 3/1.0 (+1) | 873 (+4%) | 12mo | $119,900 | $137 | 48 |
| 565 Porter St | 0.74mi | 3/1.0 (+1) | 912 (+9%) | 13mo | $80,000 | $88 | 36 |
Match score weights: distance 35% · size 25% · config 20% · recency 20%. Top-matched comps best support the ARV.
Projected returns pro-forma
1.26% appreciation · 3.0% rent growth · sell at horizon
- IRR
- 15.9%
- Equity multiple
- 1.82×
- Total profit
- $25,369
- Equity at exit
- $38,996
- IRR
- 19.0%
- Equity multiple
- 3.36×
- Total profit
- $72,576
- Equity at exit
- $52,984
Cash invested: $30,772 (down + closing). Projections, not guarantees.
Landlord ↔ Tenant lean methodology
- Overall (STATE)
- 90 Strongly Landlord-Friendly
- State Indiana
- 90 Strongly Landlord-Friendly · R+11
- County
- — inherits STATE
- City
- — inherits STATE
ZIP-level market 46406
- Home prices YoY
- 0.9%
- Active inventory
- 54
- Price-to-rent
- 7.2×
Monthly cashflow live
- Estimated rent
- $1,274 high interval (Pro) →
- Mortgage (P&I)
- −$576
- Tax from tax record
- −$39 /mo · $470/yr
- Insurance
- −$46
- HOA
- −$0
- Vacancy / Maint / Mgmt
- −$267
- Net cashflow
- $345
Break-even live
UW: 25.0% down · 7.5% · 30yr · 1.5% tax · 5.0% vac · 8.0% maint · 8.0% mgmt
Financing live
Cash to close
- Down payment
- $27,475
- Closing costs
- $3,297
- Reserves months
- —
- Total cash needed
- —
Loan-product check · same deal, 3 products live
Conventional
25% down · 7.5% · 30yr
- Down + closing
- —
- Monthly P&I
- —
- Monthly cashflow
- —
- DSCR
- —
- Eligible?
- —
Personal DTI + credit; lowest rate.
DSCR
20% down · 8.5% · 30yr
- Down + closing
- —
- Monthly P&I
- —
- Monthly cashflow
- —
- DSCR
- —
- Eligible?
- —
No personal income docs; deal must DSCR.
Hard money
10% down · 12.0% · 12mo
- Down + closing
- —
- Monthly P&I
- —
- Monthly cashflow
- —
- DSCR
- —
- Eligible?
- —
Short-term bridge; refi at stabilization.
Rent comps 8 comps
| Address | Beds | Baths | Sqft | Rent | $/sqft | DOM | Units | Dist |
|---|---|---|---|---|---|---|---|---|
| 1043 Mount St Gary, IN | 3.0 | 1.0 | 750 | $1,200 | $1.60 | 1d | 1 | 0.18mi |
| 743 Hanley St Gary, IN | 3.0 | 1.0 | 800 | $1,350 | $1.69 | 1d | 1 | 0.55mi |
| 4061 W 20th Pl Gary, IN | 3.0 | 1.0 | 925 | $1,450 | $1.57 | 1d | 1 | 0.87mi |
| 4300 W 22nd Pl Gary, IN | 3.0 | 1.0 | 977 | $1,395 | $1.43 | 2d | 1 | 0.89mi |
| 4328 W 22nd Plz Gary, IN | 3.0 | 1.0 | 950 | $1,300 | $1.37 | 3d | 1 | 0.93mi |
| 4134 W 22nd Pl Gary, IN | 3.0 | 1.0 | 825 | $1,395 | $1.69 | 1d | 1 | 0.96mi |
| 2939 W 10th Ave Gary, IN | 2.0 | 1.0 | 744 | $1,190 | $1.60 | 1d | 1 | 1.30mi |
| 1531 Taney Pl Gary, IN | 2.0 | 1.0 | 900 | $1,045 | $1.16 | 1d | 1 | 1.30mi |
Listing history 4 events
-
2026-06-18days on market $109,900 Active 3 DOM
-
2026-06-17days on market $109,900 Active 2 DOM
-
2026-06-16remarks 357-char remark
-
2026-06-16$109,900 Active 1 DOM
ⓘ Source: listings_history table (triggers on properties + properties_extension) + one-shot
backfill from property_details.listing_events for pre-trigger history.
Tax reassessment forecast IN · Partial reset (capped growth)
- Current annual tax
- $470 · $39/mo
- Projected year-2 tax
- $702 · $59/mo
- Expected delta
- +$232/yr (+$19/mo · 49.4%)
ⓘ Screening estimate from a state-policy table — verify with the county assessor before closing.
Climate risk First Street
- Flood 4/10 Moderate FEMA zone X (unshaded) · 22% chance over 30 yrs
- Wildfire 1/10 Low
- Heat 3/10 Moderate 7 d/yr ≥103°F today · 15 d/yr by 30 yrs out
- Wind 2/10 Low 100% chance of damaging wind over 30 yrs
- Air quality 4/10 Moderate 5 unhealthy d/yr today · 6 by 30 yrs out
Nearby sold comps map
Loading sold comps map…
Walkable amenities ~0.75 mi
Loading nearby amenities…
Taxation est. · year 1
- Rental income
- $15,284
- − Mortgage interest
- −$6,156
- − Property taxes
- −$470
- − Insurance
- −$550
- − Repairs & maintenance
- −$1,223
- − Management
- −$1,223
- − Depreciation
- −$3,197
- Taxable income
- $2,466
- Est. tax owed @ 24.0%
- −$592
- After-tax cash flow
- $3,547/yr
For passive investors: Depreciation is non-cash, so a rental often shows a tax loss while cash-flowing — sheltering income. Rental losses are passive: they offset passive income freely, and up to $25,000/yr can offset ordinary (W-2) income if you actively participate and your MAGI is under $100k (phasing out to $0 by $150k); unused losses carry forward. On sale, claimed depreciation is recaptured at up to 25%, and gains may owe capital-gains tax (a 1031 exchange can defer both). Figures are a year-1 estimate at your 24.0% rate — not tax advice; consult a CPA.
Schools (NCES district)
- District
- Gary Community School Corporation
- NCES district ID
- 1803870
- Math proficiency
- 3% ▼ -10.00%
- Reading proficiency
- 11% ▼ -6.00%
- Median HH income
- $27,739
- Composite
- 4.98/100
- National rank
- #10039
- State rank
- #299 of 301 in IN
Livability — Gary
- Score
- 73/100
- State rank
- #105
- US rank
- #5592
Category grades
Schools grade is shown separately in the Schools card above.
Census & demographics
- Census place
- Gary, IN
- City population
- 63,701
- Population (ZIP)
- 8,513
Population outlook (Lake County) Hauer SSP2
- Today (2025)
- 484,026 people
- By 2030
- 478,091 · -1.2%
- By 2040
- 462,974 · -4.3%
- By 2050
- 449,894 · -7.1%
- By 2075
- 436,169 · -9.9%
- By 2100
- 426,607 · -11.9%
Race, ethnicity, and origin ACS 2023
- Neighborhood character
- Majority Black (63%)
- Race & ethnicity
- Black 63% White 21% Hispanic / Latino 13% Two or more races 7%
- Hispanic origin (detail)
- Mexican 7% Puerto Rican 3%
- Common ancestry
- Slovak 2% Italian 1% Lithuanian 1%
- Foreign-born
- 4% · Canada
- Languages at home
- 91% English-only · Spanish 8%
Political lean MEDSL · Lake
- 2024 margin
- Lean D (+5.6) · D 52.1% · R 46.5% · Other 1.5%
- 2008→2024 swing
- -28.6pp toward R · 2008: 34.3pp · 2024: 5.6pp
- All cycles
- 2024: D+5.6 2020: D+15.1 2016: D+20.6 2012: D+31.0 2008: D+34.3
Not yet ingested
- Civics
- —
Market trends
- HPI YoY
- ▲ 1.26%
- Current HPI
- 147.0732
- Rent YoY
- —
- Metro
- —
- State GDP YoY
- ▲ 2.90%
- F500 in state
- 18
Industry mix (Fortune 500 HQ in IN)
| Industry | F500 HQs | Revenue |
|---|---|---|
| Industrial Machinery | 2 | $37B |
|
||
| Healthcare | 1 | $177B |
|
||
| Pharmaceuticals | 1 | $45B |
|
||
| Metals / Steel | 1 | $18B |
|
||
| Agriculture | 1 | $17B |
|
||
| Packaging | 1 | $12B |
|
||
Price history
+514.0% since first listed17 events — show timeline
- 2026-06-09 Listed $109,900 NIRA MLS as Distributed by MLS Grid
- 2025-04-25 Rental Removed $1,250 RENTEC
- 2025-04-04 Price Changed $1,250 RENTEC
- 2025-03-27 Listed for Rent $1,350 RENTEC
- 2025-02-14 Sold (MLS) $65,000 NIRA MLS as Distributed by MLS Grid
- 2025-02-06 Pending — NIRA MLS as Distributed by MLS Grid
- 2025-01-31 Contingent — NIRA MLS as Distributed by MLS Grid
- 2024-11-27 Price Changed $90,000 NIRA MLS as Distributed by MLS Grid
- 2024-09-19 Listed $95,000 NIRA MLS as Distributed by MLS Grid
- 2024-06-25 Listing Removed — NIRA MLS as Distributed by MLS Grid
- 2024-05-24 Price Changed $85,000 NIRA MLS as Distributed by MLS Grid
- 2024-04-01 Relisted — NIRA MLS as Distributed by MLS Grid
- 2023-11-05 Listing Removed — NIRA MLS as Distributed by MLS Grid
- 2023-09-04 Listed $90,000 NIRA MLS as Distributed by MLS Grid
- 2023-04-25 Sold (MLS) $17,000 NIRA MLS as Distributed by MLS Grid
- 2023-04-15 Pending — NIRA MLS as Distributed by MLS Grid
- 2023-03-24 Listed $17,900 NIRA MLS as Distributed by MLS Grid
Property tax history
+3.6%/yrLatest (2024): $470 · +8.2% YoY. Source: county tax records.
Cash-flow waterfall
monthlySold comps — $/sqft
last 12 mo · ≤1 miLoading sold comps…