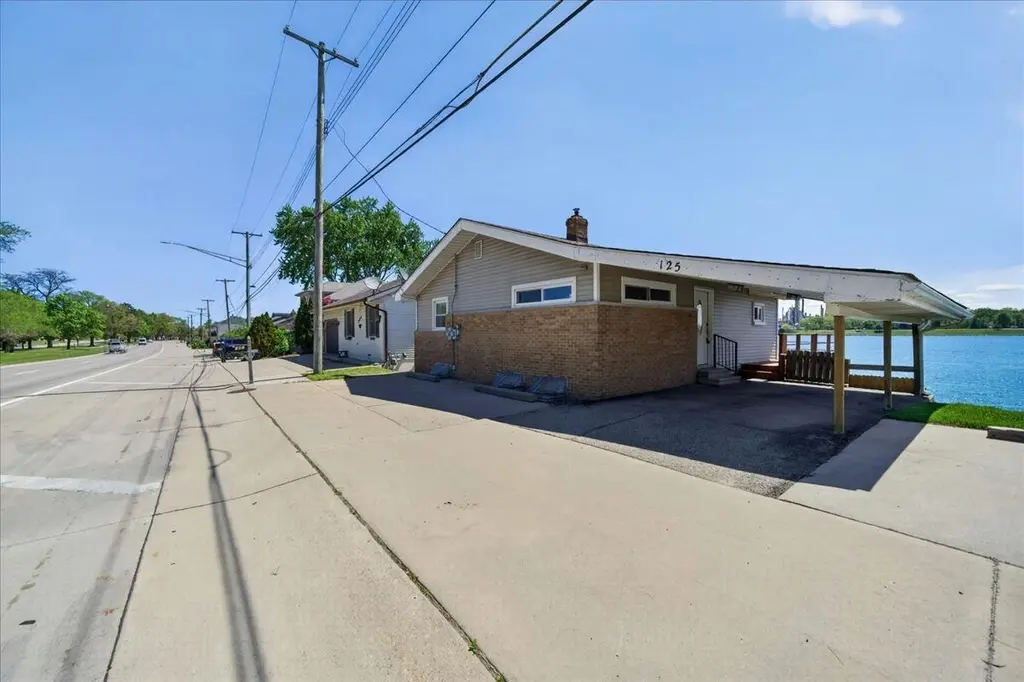
125 Gratiot Blvd · Marysville, MI
Flood risk 1/10 · Minimal
- FEMA flood zone
- X (unshaded)
- Chance of flooding over 30 yrs
- 0.0%
- Est. flood insurance / yr
- $473 – $860
Fire risk 1/10 · Minimal
- Est. fire insurance / yr
- $784 – $1,456
Heat risk 2/10 · Minimal
- Hot days now (above 99°F)
- 7 days/yr
- Hot days in 30 yrs
- 13 days/yr
Wind risk 1/10 · Minimal
- Chance of severe wind over 30 yrs
- —
Air-quality risk 3/10 · Minor
- Unhealthy air days now
- 2 days/yr
- Unhealthy air days in 30 yrs
- 3 days/yr
Risk factors via First Street. Map © Google.
Why this score? — see what drove the B grade
The composite is a weighted blend of 9 inputs, each scored 0–100. Each bar is that input's sub-score; the figure is the points it added to the 100-point composite (weight × sub-score).
- Cash flow +30.0/30.0
- 1% rule +10.0/10.0
- DSCR +10.0/10.0
- ARV discount +7.5/15.0
- Schools +4.2/10.0
- Livability +3.9/5.0
- Rent growth +2.5/5.0
- Condition / age +2.5/5.0
- Appreciation +0.0/10.0
$301,500
🖨 Deal sheet 📄 Offer letter ✓ Due diligence
Listing remarks MLS
St. Clair River Frontage! Square footage of house doubles when you include the recently gutted walk out lower level! There is a total of 2 full kitchens, 2 living rooms, 3 bedrooms and 2 full baths! Updated roof, windows, electrical, and plumbing. You will appreciate the tinted upper level windows, 2nd story deck, lower level covered patio and of course the patio and party shed right on the water. This home sits high and dry! No showings Sunday August 16th due to float down party.
Key facts
- 6,970 sq ft lot
- Built 1960
- Listed 23 days
Property features AI
Finance
- Other: Property type: Residential; Structure style: 1 story; Legal water access: river; Green feature: HVAC
Exterior
- Parking: Carport; Two parking spaces
- Utilities: Public water; Public sanitary sewer; Natural gas heating and gas water heater
- Home design: Single-story residential property; Built in 1960; Located on the St. Clair River; Sloping lot on a main street
- Construction: Basement foundation; Block basement; Finished basement
- Exterior features: Brick and vinyl siding with vinyl trim; Deck and porch; Neighbor-owned fence; Street lights; Cabana/outbuilding; River view with waterfront access and river frontage; Sea wall
Interior
- Kitchen: Eat-in kitchen; Range/oven; Microwave; Refrigerator; Bar refrigerator
- Bedrooms: Two main-level bedrooms with laminate flooring (approx. 11 x 11 and 11 x 10); One lower-level bedroom with carpet (approx. 8' width)
- Flooring: Laminate flooring in main living areas and bedrooms; Carpet in lower bedroom; Slate and ceramic in bathrooms; Concrete in laundry/basement
- Bathrooms: Two full bathrooms; Entry-level bathroom with slate flooring; Lower-level bathroom with ceramic flooring
- Heating & cooling: Forced air heating; Central A/C
- Interior features: Bay window; Cable/internet available; Finished full basement with egress/daylight windows and walk-out; Basement has full bath
- Laundry & utility: Lower-level laundry room (washer and dryer included); Laundry room with concrete floor
Neighborhood map
What this means for you Summary
Snapshot
- This is a 3-bed/2.0-bath single-family listed at $302k.
Deal economics
- At list price, monthly cash flow is $2k ($18k/yr) — positive.
- The deal already cash-flows at list — no discount required.
- Meets the 1% rule at list price ($5k rent vs $302k).
- Recommended offer: $297k (1.5% below list) — sets the bar for market timing.
- Cap rate 12.3% vs local median 4.8% in Marysville — top-decile yield for the area; either an underpriced asset or a hidden risk that comps aren't pricing in. Stress-test before assuming the spread holds.
Location & tenants
- Location reads 78/100 on livability (#114 in MI, #2,700 nationally) — a middle-class / working-renter tenant base. Strengths: crime A+, cost of living A+, housing A+; Watch: amenities C-, employment D+, health & safety D.
- Marysville Public Schools (suburban): math 42% / reading 53% proficiency, ranked #115 of 540 in MI (top 21%) — families likely to look elsewhere, expect single-tenant / working-renter base with shorter leases.
- Market conditions: 84 active listings in the ZIP; 2 comparable units currently listed for rent nearby; 232 units permitted in St. Clair County in 2024 (0 in 5+ unit buildings).
Forward outlook
- Local home prices are declining (-3.0%/yr); year-one equity from $2k of loan paydown is wiped out by about $9k of value loss. Plan a longer hold.
- St. Clair County population projected at -20% by 2050 — secular population decline; favor cash flow + early exit over multi-decade hold.
- At projected returns (-3.0% appreciation + 3.0% rent growth), your $84k cash investment doubles in ~6 years — after that, you're playing with house money.
Negotiation context
- It's been on market 23 days — a 2% lower offer ($297k) is reasonable based on typical stale-listing flexibility.
- 19 sale attempts since 19y ago; this cycle's ask is 44% above the opening price — seller raised mid-cycle; expect resistance to lowballs.
- Current owner paid $208k; 45% above their basis — modest negotiation headroom, anchor on the comps not their cost.
Questions for the listing agent
- Built in 1960 — when were the roof, HVAC, electrical panel, plumbing, and water heater last replaced?
- Is there a deadline driving the sale (1031 exchange, divorce, estate, relocation)? That informs how much negotiation room exists.
- Schools are B-rated — typically a magnet for longer-tenancy family renters. What's the average tenant stay here, and is there a school-zone premium baked into asking?
- What's the average days-on-market for RENTAL listings here right now (not sales)? A rising rental-DOM trend means longer vacancies and softer asking-rent achievability than the comps imply.
- What's the recent tenant-quality profile in this submarket — average credit score on applications, eviction rate, late-payment / NSF rate, and stable-employment percentage? A property-management company in the area should have these aggregated.
- How much new for-sale + rental construction is in the pipeline within 1–3 miles? Heavy new supply typically softens prices + rents 12–24 months out; constrained supply supports both.
Investment metrics
- 1% rule
- 1.53% ✓
- Cap rate
- 12.32%
- Cash-on-cash
- 21.52%
- DSCR
- 1.96
- GRM
- 5.4
CMA / ARV
- ARV (on-the-fly)
- $182,825
- Comps found
- 4
Show comp detail 4 sales within ~0.75 mi
| Address | Dist | Beds/Ba | Sqft | Sold | Price | $/sf | Match |
|---|---|---|---|---|---|---|---|
| 2909 North Blvd | 0.57mi | 3/1.5 | 1,785 (+1%) | 14mo | $155,000 | $87 | 59 |
| 2801 Sturges St | 0.40mi | 4/1.5 (+1) | 1,608 (-9%) | 18mo | $73,000 | $45 | 44 |
| 2601 Peavey St | 0.48mi | 3/1.5 | 1,598 (-10%) | 20mo | $165,000 | $103 | 42 |
| 3502 Ravenswood Rd | 0.68mi | 3/2.5 | 1,575 (-11%) | 8mo | $295,000 | $187 | 41 |
Match score weights: distance 35% · size 25% · config 20% · recency 20%. Top-matched comps best support the ARV.
Projected returns pro-forma
-3.0% appreciation · 3.0% rent growth · sell at horizon
- IRR
- 14.1%
- Equity multiple
- 1.56×
- Total profit
- $47,676
- Equity at exit
- $44,955
- IRR
- 22.9%
- Equity multiple
- 2.97×
- Total profit
- $166,108
- Equity at exit
- $26,068
Cash invested: $84,420 (down + closing). Projections, not guarantees.
Landlord ↔ Tenant lean methodology
- Overall (STATE)
- 62 Landlord-Friendly
- State Michigan
- 62 Landlord-Friendly · EVEN
- County
- — inherits STATE
- City
- — inherits STATE
ZIP-level market 48040
- Home prices YoY
- -34.4%
- Active inventory
- 84
- Price-to-rent
- 5.4×
Monthly cashflow live
- Estimated rent
- $4,626 medium interval (Pro) →
- Mortgage (P&I)
- −$1,581
- Tax from tax record
- −$434 /mo · $5,209/yr
- Insurance
- −$126
- HOA
- −$0
- Vacancy / Maint / Mgmt
- −$972
- Net cashflow
- $1,514
Break-even live
UW: 25.0% down · 7.5% · 30yr · 1.5% tax · 5.0% vac · 8.0% maint · 8.0% mgmt
Financing live
Cash to close
- Down payment
- $75,375
- Closing costs
- $9,045
- Reserves months
- —
- Total cash needed
- —
Loan-product check · same deal, 3 products live
Conventional
25% down · 7.5% · 30yr
- Down + closing
- —
- Monthly P&I
- —
- Monthly cashflow
- —
- DSCR
- —
- Eligible?
- —
Personal DTI + credit; lowest rate.
DSCR
20% down · 8.5% · 30yr
- Down + closing
- —
- Monthly P&I
- —
- Monthly cashflow
- —
- DSCR
- —
- Eligible?
- —
No personal income docs; deal must DSCR.
Hard money
10% down · 12.0% · 12mo
- Down + closing
- —
- Monthly P&I
- —
- Monthly cashflow
- —
- DSCR
- —
- Eligible?
- —
Short-term bridge; refi at stabilization.
Rent comps 2 comps
| Address | Beds | Baths | Sqft | Rent | $/sqft | DOM | Units | Dist |
|---|---|---|---|---|---|---|---|---|
| 45 Gratiot Blvd Unit 1550273P Marysville, MI | 2.0 | 1.5 | 1323 | $5,089 | $3.85 | 2d | 1 | 0.23mi |
| 3991 Brookstone Pl Port Huron, MI | 2.0–3.0 | 1.0–2.0 | 1078 | $1,570 | $1.46 | 1d | 7 | 1.24mi |
Listing history 50 events
-
2026-06-18days on market $301,500 Active 23 DOM
-
2026-06-17days on market $301,500 Active 22 DOM
-
2026-06-16days on market $301,500 Active 21 DOM
-
2026-06-15days on market $301,500 Active 20 DOM
-
2026-06-13days on market $301,500 Active 18 DOM
-
2026-06-09days on market $301,500 Active 14 DOM
-
2026-06-08days on market $301,500 Active 13 DOM
-
2026-06-07days on market $301,500 Active 12 DOM
-
2026-06-04days on market $301,500 Active 9 DOM
-
2026-06-03days on market $301,500 Active 8 DOM
-
2026-06-02days on market $301,500 Active 7 DOM
-
2026-06-01days on market $301,500 Active 6 DOM
-
2026-05-31days on market $301,500 Active 5 DOM
-
2026-05-22historical $301,500
-
2020-12-07soldstatus $208,000
-
2020-09-17soldstatus $208,000 Closed 489-char remark
Show marketing remark (489 chars)
St. Clair River Frontage! Square footage of house doubles when you include the recently gutted walk out lower level! There is a total of 2 full kitchens, 2 living rooms, 3 bedrooms and 2 full baths! Updated roof, windows, electrical, and plumbing. You will appreciate the tinted upper level windows, 2nd story deck, lower level covered patio and of course the patio and party shed right on the water. This home sits high and dry! No showings Sunday August 16th due to float down party.
-
2020-09-17soldstatus $208,000
Show marketing remark (489 chars)
St. Clair River Frontage! Square footage of house doubles when you include the recently gutted walk out lower level! There is a total of 2 full kitchens, 2 living rooms, 3 bedrooms and 2 full baths! Updated roof, windows, electrical, and plumbing. You will appreciate the tinted upper level windows, 2nd story deck, lower level covered patio and of course the patio and party shed right on the water. This home sits high and dry! No showings Sunday August 16th due to float down party.
-
2020-08-19status Pending 489-char remark
Show marketing remark (489 chars)
St. Clair River Frontage! Square footage of house doubles when you include the recently gutted walk out lower level! There is a total of 2 full kitchens, 2 living rooms, 3 bedrooms and 2 full baths! Updated roof, windows, electrical, and plumbing. You will appreciate the tinted upper level windows, 2nd story deck, lower level covered patio and of course the patio and party shed right on the water. This home sits high and dry! No showings Sunday August 16th due to float down party.
-
2020-08-10$210,000 Active 489-char remark
Show marketing remark (489 chars)
St. Clair River Frontage! Square footage of house doubles when you include the recently gutted walk out lower level! There is a total of 2 full kitchens, 2 living rooms, 3 bedrooms and 2 full baths! Updated roof, windows, electrical, and plumbing. You will appreciate the tinted upper level windows, 2nd story deck, lower level covered patio and of course the patio and party shed right on the water. This home sits high and dry! No showings Sunday August 16th due to float down party.
-
2020-08-10$210,000
Show marketing remark (489 chars)
St. Clair River Frontage! Square footage of house doubles when you include the recently gutted walk out lower level! There is a total of 2 full kitchens, 2 living rooms, 3 bedrooms and 2 full baths! Updated roof, windows, electrical, and plumbing. You will appreciate the tinted upper level windows, 2nd story deck, lower level covered patio and of course the patio and party shed right on the water. This home sits high and dry! No showings Sunday August 16th due to float down party.
-
2020-04-13historical
-
2020-04-13historical
-
2020-03-19price $215,000
-
2020-03-19price $115,000
-
2020-03-19price $215,000
-
2020-03-19price $115,000
-
2020-02-05$225,000 Active
-
2020-02-05$225,000 Active
-
2015-08-03soldstatus $160,000
-
2015-07-21soldstatus $160,000 Closed
-
2015-07-21soldstatus $160,000
-
2015-07-15status Pending
-
2015-05-27status Back on Market
-
2015-05-27price $165,000
-
2015-03-26status Pending
-
2015-01-15status Active
-
2015-01-11historical
-
2014-12-18status Back on Market
-
2014-10-30historical
-
2014-07-10$154,900
-
2014-07-10$165,000
-
2014-06-28historical
-
2013-07-02$159,900
-
2010-10-13historical
-
2010-10-13historical
-
2010-10-11historical
-
2009-08-31$199,000
-
2009-08-29$199,000
-
2009-08-29$199,000
-
2009-07-20historical
ⓘ Source: listings_history table (triggers on properties + properties_extension) + one-shot
backfill from property_details.listing_events for pre-trigger history.
Tax reassessment forecast MI · Partial reset (capped growth)
- Current annual tax
- $5,209 · $434/mo
- Projected year-2 tax
- $5,209 · $434/mo
- Expected delta
- $0/yr ($0/mo · 0.0%)
ⓘ Screening estimate from a state-policy table — verify with the county assessor before closing.
Climate risk First Street
- Flood 1/10 Low FEMA zone X (unshaded) · 0% chance over 30 yrs
- Wildfire 1/10 Low
- Heat 2/10 Low 7 d/yr ≥99°F today · 13 d/yr by 30 yrs out
- Wind 1/10 Low
- Air quality 3/10 Moderate 2 unhealthy d/yr today · 3 by 30 yrs out
Nearby sold comps map
Loading sold comps map…
Walkable amenities ~0.75 mi
Loading nearby amenities…
Taxation est. · year 1
- Rental income
- $55,516
- − Mortgage interest
- −$16,889
- − Property taxes
- −$5,209
- − Insurance
- −$1,508
- − Repairs & maintenance
- −$4,441
- − Management
- −$4,441
- − Depreciation
- −$8,771
- Taxable income
- $14,257
- Est. tax owed @ 24.0%
- −$3,422
- After-tax cash flow
- $14,746/yr
For passive investors: Depreciation is non-cash, so a rental often shows a tax loss while cash-flowing — sheltering income. Rental losses are passive: they offset passive income freely, and up to $25,000/yr can offset ordinary (W-2) income if you actively participate and your MAGI is under $100k (phasing out to $0 by $150k); unused losses carry forward. On sale, claimed depreciation is recaptured at up to 25%, and gains may owe capital-gains tax (a 1031 exchange can defer both). Figures are a year-1 estimate at your 24.0% rate — not tax advice; consult a CPA.
Schools (NCES district)
- District
- Marysville Public Schools
- NCES district ID
- 2623040
- Math proficiency
- 42% ▼ -14.00%
- Reading proficiency
- 53% ▼ -12.00%
- Median HH income
- $58,817
- Composite
- 41.51/100
- National rank
- #3454
- State rank
- #115 of 540 in MI
Livability — Marysville
- Score
- 78/100
- State rank
- #114
- US rank
- #2700
Category grades
Schools grade is shown separately in the Schools card above.
Census & demographics
- Census place
- Marysville, MI
- City population
- 9,942
- Population (ZIP)
- 9,942
Population outlook (St. Clair County) Hauer SSP2
- Today (2025)
- 154,587 people
- By 2030
- 150,031 · -2.9%
- By 2040
- 138,177 · -10.6%
- By 2050
- 124,390 · -19.5%
- By 2075
- 95,825 · -38.0%
- By 2100
- 68,672 · -55.6%
Race, ethnicity, and origin ACS 2023
- Neighborhood character
- Predominantly White (93%)
- Race & ethnicity
- White 93% Two or more races 3% Hispanic / Latino 1% Asian 1% Black 1%
- Common ancestry
- Romanian 11% Iranian 6% Lithuanian 5%
- Foreign-born
- 2% · Canada, Philippines
- Languages at home
- 98% English-only · Other Asian/Pacific 1%
Political lean MEDSL · St. Clair
- 2024 margin
- Solid R (+34.6) · D 32.0% · R 66.6% · Other 1.4%
- 2008→2024 swing
- -37.3pp toward R · 2008: 2.6pp · 2024: -34.6pp
- All cycles
- 2024: R+34.6 2020: R+30.2 2016: R+31.4 2012: R+7.1 2008: D+2.6
Not yet ingested
- Civics
- —
Market trends
- HPI YoY
- ▼ -98.64%
- Current HPI
- 188.3932
- Rent YoY
- —
- Metro
- —
- State GDP YoY
- ▲ 1.37%
- F500 in state
- 28
Industry mix (Fortune 500 HQ in MI)
| Industry | F500 HQs | Revenue |
|---|---|---|
| Automotive Parts | 3 | $48B |
|
||
| Automotive | 2 | $372B |
|
||
| Chemicals | 1 | $45B |
|
||
| Automotive Retail | 1 | $29B |
|
||
| Healthcare / Medical Devices | 1 | $23B |
|
||
| Automotive Technology | 1 | $20B |
|
||
Price history
+7.7% since first listed48 events — show timeline
- 2026-05-22 Coming Soon $301,500 MiRealSource-MiMLS
- 2020-12-07 Sold (Public Records) $208,000 Public Records
- 2020-09-17 Sold (MLS) $208,000 REALCOMP
- 2020-09-17 Sold (MLS) $208,000 MiRealSource-MiMLS
- 2020-08-19 Pending — MiRealSource-MiMLS
- 2020-08-10 Listed $210,000 REALCOMP
- 2020-08-10 Listed $210,000 MiRealSource-MiMLS
- 2020-04-13 Listing Removed — REALCOMP
- 2020-04-13 Listing Removed — MiRealSource-MiMLS
- 2020-03-19 Price Changed $215,000 MiRealSource-MiMLS
- 2020-03-19 Price Changed $115,000 MiRealSource-MiMLS
- 2020-03-19 Price Changed $215,000 REALCOMP
- 2020-03-19 Price Changed $115,000 REALCOMP
- 2020-02-05 Listed $225,000 MiRealSource-MiMLS
- 2020-02-05 Listed $225,000 REALCOMP
- 2015-08-03 Sold (Public Records) $160,000 Public Records
- 2015-07-21 Sold (MLS) $160,000 REALCOMP
- 2015-07-21 Sold (MLS) $160,000 MiRealSource-MiMLS
- 2015-07-15 Pending — MiRealSource-MiMLS
- 2015-05-27 Price Changed $165,000 MiRealSource-MiMLS
- 2015-05-27 Relisted — MiRealSource-MiMLS
- 2015-03-26 Pending — MiRealSource-MiMLS
- 2015-01-15 Relisted — MiRealSource-MiMLS
- 2015-01-11 Listing Removed — MiRealSource-MiMLS
- 2014-12-18 Relisted — MiRealSource-MiMLS
- 2014-10-30 Listing Removed — MiRealSource-MiMLS
- 2014-07-10 Listed $165,000 REALCOMP
- 2014-07-10 Listed $154,900 MiRealSource-MiMLS
- 2014-06-28 Listing Removed — MiRealSource-MiMLS
- 2013-07-02 Listed $159,900 MiRealSource-MiMLS
- 2010-10-13 Listing Removed — REALCOMP
- 2010-10-13 Listing Removed — MiRealSource-MiMLS
- 2010-10-11 Listing Removed — MiRealSource-MiMLS
- 2009-08-31 Listed $199,000 MiRealSource-MiMLS
- 2009-08-29 Listed $199,000 REALCOMP
- 2009-08-29 Listed $199,000 MiRealSource-MiMLS
- 2009-07-20 Listing Removed — REALCOMP
- 2009-07-20 Listing Removed — MiRealSource-MiMLS
- 2009-06-09 Listed $225,000 REALCOMP
- 2009-06-09 Listed $225,000 MiRealSource-MiMLS
- 2008-08-26 Listing Removed — REALCOMP
- 2008-08-26 Listing Removed — MiRealSource-MiMLS
- 2008-04-25 Listed $219,900 REALCOMP
- 2008-04-25 Listed $219,900 MiRealSource-MiMLS
- 2007-11-07 Listing Removed — MiRealSource-MiMLS
- 2007-11-07 Listing Removed — REALCOMP
- 2007-05-08 Listed $279,900 MiRealSource-MiMLS
- 2007-05-08 Listed $279,900 REALCOMP
Property tax history
+0.1%/yrLatest (2025): $5,209 · +4.2% YoY. Source: county tax records.
Cash-flow waterfall
monthlySold comps — $/sqft
last 12 mo · ≤1 miLoading sold comps…