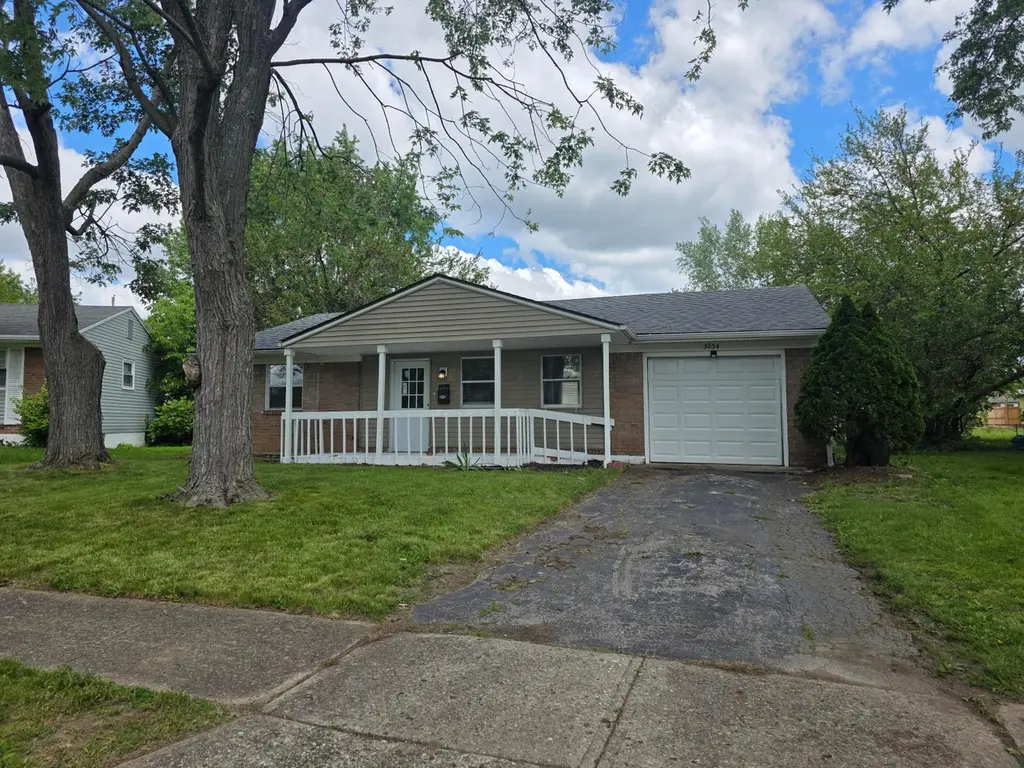
3054 Wadsworth Ct · Columbus, OH
Flood risk 1/10 · Minimal
- FEMA flood zone
- X (unshaded)
- Chance of flooding over 30 yrs
- 0.0%
- Est. flood insurance / yr
- $507 – $1,088
Fire risk 1/10 · Minimal
- Est. fire insurance / yr
- $713 – $1,323
Heat risk 4/10 · Minor
- Hot days now (above 101°F)
- 7 days/yr
- Hot days in 30 yrs
- 18 days/yr
Wind risk 2/10 · Minimal
- Chance of severe wind over 30 yrs
- 1.0%
Air-quality risk 2/10 · Minimal
- Unhealthy air days now
- 1 days/yr
- Unhealthy air days in 30 yrs
- 1 days/yr
Risk factors via First Street. Map © Google.
Why this score? — see what drove the D grade
The composite is a weighted blend of 9 inputs, each scored 0–100. Each bar is that input's sub-score; the figure is the points it added to the 100-point composite (weight × sub-score).
- ARV discount +13.1/15.0
- Cash flow +10.3/30.0
- Livability +4.0/5.0
- Rent growth +3.1/5.0
- DSCR +3.0/10.0
- 1% rule +2.9/10.0
- Condition / age +2.5/5.0
- Schools +1.7/10.0
- Appreciation +0.0/10.0
$187,900
🖨 Deal sheet (PDF) 📄 Offer letter ✓ Due diligence
Listing remarks
Charming & Modernized Ranch - Minutes to Downtown Welcome home to this beautifully updated 3-bedroom, 1-bathroom residence that perfectly blends modern convenience with everyday comfort. Ideally located with quick freeway access and just minutes from the heart of downtown, this property is a standout opportunity for first-time buyers or savvy investors. Interior Highlights: Open Concept Living: Step inside to a light-filled, open floor plan that seamlessly connects the living area to the kitchen, creating the perfect environment for entertaining. Chef's Kitchen: Enjoy a modern kitchen updated within the last few years, featuring sleek finishes, ample cabinetry, and generous counter
Key facts
- Open concept living
- Expansive outdoors
- Chef's kitchen
Tags
Property features AI
Exterior
- Parking: Attached garage with 1 parking space
- Utilities: Public water; Public sewer
- Home design: Single family residence; One story; Built in 1964; No common walls
- Construction: Slab foundation; Other foundation details
- Exterior features: Fenced yard
Interior
- Bedrooms: Three main-level bedrooms
- Bathrooms: One full bathroom
- Heating & cooling: Central air conditioning; Forced air heating
- Interior features: Living area approximately 1,074
Neighborhood map
What this means for you Summary
Snapshot
- This is a 3-bed/1.0-bath single-family listed at $188k.
Deal economics
- At list price, monthly cash flow is $-103 ($-1k/yr) — negative.
- To cash-flow at today's rent, offer at most $170k (9.7% below list).
- To meet the 1% rule (rent ≥ 1% of price), the offer needs to be $149k (20.6% below list).
- Recommended offer: $149k (20.6% below list) — sets the bar for 1% rule.
- Cap rate 5.6% vs local median 3.8% in Columbus — top-decile yield for the area; either an underpriced asset or a hidden risk that comps aren't pricing in. Stress-test before assuming the spread holds.
Location & tenants
- Location reads 81/100 on livability (#97 in OH, #1,491 nationally) — a professional / high-income tenant draw. Strengths: commute A+, cost of living A+, housing A+; Watch: employment C-, crime F.
- Columbus City School District (urban): math 15% / reading 26% proficiency, ranked #626 of 656 in OH (top 95%) — low school quality limits family demand, transient renter base, plan for 1-2y turnover; 72% free/reduced lunch — lower-income household profile, screen leases tightly.
- Market conditions: Rents rising (+2.4%/yr); 89 active listings in the ZIP; 30 comparable units currently listed for rent nearby; rentals at typical pace (median 24d on market — plan ~3-4 weeks tenant-placement turnaround); 43% of comp listings sitting > 30 days — soft ceiling on asking rent; 8,139 units permitted in Franklin County in 2024 (5,940 in 5+ unit buildings).
- This rent runs 35% of the median local income ($51k/yr) — at the standard rent-burdened threshold; future hikes will face affordability resistance.
Forward outlook
- Local home prices are declining (-3.0%/yr); year-one equity from $1k of loan paydown is wiped out by about $6k of value loss. Plan a longer hold.
- Franklin County population projected at +34% by 2050 — long-run rental-demand tailwind backs the buy-and-hold thesis.
Negotiation context
- It's been on market 37 days — a 3% lower offer ($182k) is reasonable based on typical stale-listing flexibility.
- 4 sale attempts since 3y ago with the ask held roughly flat each time — persistent listings suggest the price (not the market) is what's stuck; bring a comps-based counter.
Questions for the listing agent
- What do current leases actually rent for vs. the listed asking? Can we see a recent rent roll and the last 12 months of T-12 income?
- It's been on market 37 days. Have you received any prior offers? Is the seller open to a 21% concession, seller financing, or rate buy-down credit?
- Built in 1964 — when were the roof, HVAC, electrical panel, plumbing, and water heater last replaced?
- Is there a deadline driving the sale (1031 exchange, divorce, estate, relocation)? That informs how much negotiation room exists.
- Crime grade is F in this area — have there been break-ins, vandalism, or insurance claims at this property in the last 3 years? What carrier currently insures it and at what premium?
- The area grade is low — what's the realistic commute time and amenity access for the typical tenant pool here? Any planned neighborhood developments (good or bad) we should know about?
- What's the average days-on-market for RENTAL listings here right now (not sales)? A rising rental-DOM trend means longer vacancies and softer asking-rent achievability than the comps imply.
- What's the recent tenant-quality profile in this submarket — average credit score on applications, eviction rate, late-payment / NSF rate, and stable-employment percentage? A property-management company in the area should have these aggregated.
- How much new for-sale + rental construction is in the pipeline within 1–3 miles? Heavy new supply typically softens prices + rents 12–24 months out; constrained supply supports both.
Investment metrics
- 1% rule
- 0.79% ✗
- Cap rate
- 5.64%
- Cash-on-cash
- -2.34%
- DSCR
- 0.90
- GRM
- 10.5
CMA / ARV
- ARV (median comp)
- $214,747
- List price
- $187,900
- Delta
- -12.50%
- Verdict
- UNDERPRICED
- Comps
- 20 within 1.0 mi
Show comp detail 12 sales within ~0.75 mi
| Address | Dist | Beds/Ba | Sqft | Sold | Price | $/sf | Match |
|---|---|---|---|---|---|---|---|
| 3038 Wadsworth Ct | 0.04mi | 3/2.0 | 1,074 (0%) | 0mo | $180,000 | $168 | 94 |
| 2942 Arrowhead Ct | 0.15mi | 3/1.0 | 1,086 (+1%) | 3mo | $213,660 | $197 | 89 |
| 2068 Easthaven Dr | 0.04mi | 3/2.0 | 1,170 (+9%) | 12mo | $184,900 | $158 | 69 |
| 3330 Balford Sq S | 0.42mi | 3/2.0 | 1,096 (+2%) | 8mo | $190,000 | $173 | 66 |
| 1703 Quigley Rd | 0.55mi | 3/1.0 | 1,025 (-5%) | 8mo | $160,000 | $156 | 60 |
| 1884 Barnett Ct W | 0.37mi | 3/2.0 | 948 (-12%) | 2mo | $242,900 | $256 | 58 |
| 1634 S James Rd | 0.64mi | 3/1.5 | 1,120 (+4%) | 8mo | $140,000 | $125 | 54 |
| 3314 E Deshler Ave | 0.71mi | 2/1.0 (-1) | 1,076 (+0%) | 12mo | $135,900 | $126 | 52 |
| 1892 Somerset Ct E | 0.33mi | 4/2.0 (+1) | 1,196 (+11%) | 6mo | $134,000 | $112 | 52 |
| 3210 E Deshler Ave | 0.65mi | 2/1.0 (-1) | 1,030 (-4%) | 11mo | $230,000 | $223 | 49 |
| 3025 Langfield Dr | 0.60mi | 3/1.0 | 968 (-10%) | 9mo | $140,000 | $145 | 48 |
| 1679 Penfield Rd | 0.59mi | 2/2.0 (-1) | 938 (-13%) | 3mo | $162,500 | $173 | 40 |
Match score weights: distance 35% · size 25% · config 20% · recency 20%. Top-matched comps best support the ARV.
Projected returns pro-forma
-3.0% appreciation · 2.36% rent growth · sell at horizon
- IRR
- -20.9%
- Equity multiple
- 0.28×
- Total profit
- $-37,932
- Equity at exit
- $28,017
- IRR
- -15.7%
- Equity multiple
- 0.14×
- Total profit
- $-45,272
- Equity at exit
- $16,246
Cash invested: $52,612 (down + closing). Projections, not guarantees.
Landlord ↔ Tenant lean methodology
- Overall (STATE)
- 73 Landlord-Friendly
- State Ohio
- 73 Landlord-Friendly · R+6
- County
- — inherits STATE
- City
- — inherits STATE
ZIP-level market 43232
- Rents YoY
- 2.4%
- Active inventory
- 89
- Price-to-rent
- 10.5×
Monthly cashflow live
- Estimated rent
- $1,492 high interval (Pro) →
- Mortgage (P&I)
- −$985
- Tax from tax record
- −$218 /mo · $2,615/yr
- Insurance
- −$78
- HOA
- −$0
- Vacancy / Maint / Mgmt
- −$313
- Net cashflow
- $-103
Break-even live
Sensitivity live
| Price | -10% $4 | -5% $-50 | +0% $-103 | +5% $-156 | +10% $-209 |
|---|---|---|---|---|---|
| Rent | -10% $-221 | -5% $-162 | +0% $-103 | +5% $-44 | +10% $15 |
| Rate | -1.0pp $-8 | -0.5pp $-55 | base $-103 | +0.5pp $-151 | +1.0pp $-201 |
UW: 25.0% down · 7.5% · 30yr · 1.5% tax · 5.0% vac · 8.0% maint · 8.0% mgmt
Financing live
Cash to close
- Down payment
- $46,975
- Closing costs
- $5,637
- Reserves months
- —
- Total cash needed
- —
Loan-product check · same deal, 3 products live
Conventional
25% down · 7.5% · 30yr
- Down + closing
- —
- Monthly P&I
- —
- Monthly cashflow
- —
- DSCR
- —
- Eligible?
- —
Personal DTI + credit; lowest rate.
DSCR
20% down · 8.5% · 30yr
- Down + closing
- —
- Monthly P&I
- —
- Monthly cashflow
- —
- DSCR
- —
- Eligible?
- —
No personal income docs; deal must DSCR.
Hard money
10% down · 12.0% · 12mo
- Down + closing
- —
- Monthly P&I
- —
- Monthly cashflow
- —
- DSCR
- —
- Eligible?
- —
Short-term bridge; refi at stabilization.
Rent comps 30 comps
| Address | Beds | Baths | Sqft | Rent | $/sqft | DOM | Units | Dist |
|---|---|---|---|---|---|---|---|---|
| 3071 Rotunda Ct S Columbus, OH | 4.0 | 2.5 | 1147 | $1,400 | $1.22 | 44d | 1 | 0.17mi |
| 2209 Wabash Ct W Columbus, OH | 1.0–2.0 | 1.0–1.5 | 826 | $1,456 | $1.76 | 3d | 6 | 0.25mi |
| 2842 Kingsrowe Ct Unit 2842 Columbus, OH | 3.0 | 1.5 | 871 | $1,975 | $2.27 | 44d | 1 | 0.35mi |
| 1892 Somerset Ct E Columbus, OH | 4.0 | 2.0 | 1300 | $1,725 | $1.33 | 24d | 1 | 0.35mi |
| 3170 Melissa Pl Columbus, OH | 2.0 | 1.0 | 850 | $1,000 | $1.18 | 4d | 1 | 0.49mi |
| 3170 Melissa Pl Unit MR 3175A Columbus, OH | 2.0 | 1.0 | 850 | $1,000 | $1.18 | 24d | 1 | 0.49mi |
| 3409 Bexvie Ave Columbus, OH | 2.0–3.0 | 1.5 | 990 | $1,400 | $1.41 | 2d | 3 | 0.52mi |
| 2645 Travis Rd Columbus, OH | 1.0–3.0 | 1.0–1.5 | 1100 | $1,725 | $1.57 | 44d | 6 | 0.54mi |
| 1728 Penfield Rd Columbus, OH | 3.0 | 1.0 | 1224 | $1,925 | $1.57 | 44d | 1 | 0.54mi |
| 1634 S James Rd Columbus, OH | 3.0 | 1.5 | 1120 | $1,945 | $1.74 | 44d | 1 | 0.67mi |
| 2451 Natchez Dr Unit A Columbus, OH | 2.0 | 1.0 | 837 | $1,350 | $1.61 | 44d | 1 | 0.82mi |
| 2233 Courtside Dr Columbus, OH | 3.0 | 1.0 | 812 | $1,167 | $1.44 | 2d | 10 | 0.86mi |
| 3486 Roswell Dr Columbus, OH | 3.0 | 2.0 | 1116 | $1,625 | $1.46 | 44d | 1 | 0.96mi |
| 2500 Waters Edge Blvd Unit 042 Columbus, OH | 2.0 | 2.0 | 1057 | $1,635 | $1.55 | 4d | 1 | 0.99mi |
| 2440 Burgandy Ln Columbus, OH | 2.0 | 1.0 | 960 | $1,195 | $1.24 | 44d | 1 | 1.08mi |
| 1708 Creeksedge Dr Columbus, OH | 1.0–2.0 | 1.0–1.5 | 818 | $1,475 | $1.80 | 3d | 13 | 1.09mi |
| 1317 Barnett Rd Columbus, OH | 3.0 | 1.0 | 1057 | $1,299 | $1.23 | 12d | 1 | 1.21mi |
| 1303 Barnett Rd Unit 1303 Columbus, OH | 2.0 | 1.0 | 1020 | $1,150 | $1.13 | 12d | 1 | 1.22mi |
| 3103 Clairpoint Ct Columbus, OH | 2.0 | 1.0 | 1000 | $1,060 | $1.06 | 44d | 1 | 1.24mi |
| 3605 Cushing Dr Unit A Columbus, OH | 2.0 | 1.0 | 900 | $815 | $0.91 | 11d | 1 | 1.29mi |
| 3600 Cushing Dr Unit C Columbus, OH | 2.0 | 1.0 | 810 | $900 | $1.11 | 44d | 1 | 1.31mi |
| 3632 Cushing Dr Columbus, OH | 2.0 | 1.0 | 950 | $1,050 | $1.11 | 13d | 1 | 1.33mi |
| 3632 Cushing Dr Unit D Columbus, OH | 2.0 | 1.0 | 950 | $1,050 | $1.11 | 16d | 1 | 1.33mi |
| 3632 Cushing Dr Unit B Columbus, OH | 2.0 | 1.0 | 900 | $950 | $1.06 | 20d | 1 | 1.33mi |
| 2475 Lawndale Ave Columbus, OH | 3.0 | 2.0 | 1362 | $1,945 | $1.43 | 24d | 1 | 1.37mi |
| 2143 Winslow Dr Columbus, OH | 3.0 | 1.0 | 575 | $1,129 | $1.96 | 3d | 11 | 1.42mi |
| 1256 Rand Ave Columbus, OH | 2.0 | 1.0 | 967 | $1,299 | $1.34 | 44d | 1 | 1.43mi |
| 1079 S James Rd Columbus, OH | 2.0 | 1.0 | 768 | $995 | $1.30 | 44d | 1 | 1.46mi |
| 1789 Elaine Rd Columbus, OH | 2.0 | 1.5 | 960 | $1,270 | $1.32 | 2d | 2 | 1.50mi |
| 1705 Carstare Dr Columbus, OH | 2.0 | 1.5 | 720 | $950 | $1.32 | 44d | 1 | 1.50mi |
Listing history 22 events
-
2026-06-18days on market $187,900 Active 37 DOM
-
2026-06-17days on market $187,900 Active 36 DOM
-
2026-06-16days on market $187,900 Active 35 DOM
-
2026-06-15days on market $187,900 Active 34 DOM
-
2026-06-13days on market $187,900 Active 32 DOM
-
2026-06-13days on market $187,900 Active 31 DOM
-
2026-06-09days on market $187,900 Active 28 DOM
-
2026-06-08pricedays on market $187,900 Active 27 DOM
-
2026-06-07days on market $189,900 Active 26 DOM
-
2026-06-05days on market $189,900 Active 23 DOM
-
2026-06-03days on market $189,900 Active 22 DOM
-
2026-06-02days on market $189,900 Active 21 DOM
-
2026-06-01days on market $189,900 Active 20 DOM
-
2026-05-31days on market $189,900 Active 19 DOM
-
2026-05-12$189,900 Active 1037-char remark
-
2025-12-23historical
-
2025-12-16$194,900 Active
-
2023-11-20historical $1,375
-
2023-11-20historical
-
2023-11-09$189,900 Active
-
2023-11-06price $1,375
-
2023-10-18$1,450
ⓘ Source: listings_history table (triggers on properties + properties_extension) + one-shot
backfill from property_details.listing_events for pre-trigger history.
Tax reassessment forecast OH · Partial reset (capped growth)
- Current annual tax
- $2,615 · $218/mo
- Projected year-2 tax
- $2,773 · $231/mo
- Expected delta
- +$158/yr (+$13/mo · 6.1%)
ⓘ Screening estimate from a state-policy table — verify with the county assessor before closing.
Climate risk First Street
- Flood 1/10 Low FEMA zone X (unshaded) · 0% chance over 30 yrs
- Wildfire 1/10 Low
- Heat 4/10 Moderate 7 d/yr ≥101°F today · 18 d/yr by 30 yrs out
- Wind 2/10 Low 100% chance of damaging wind over 30 yrs
- Air quality 2/10 Low 1 unhealthy d/yr today · 1 by 30 yrs out
Nearby sold comps map
Loading sold comps map…
Walkable amenities ~0.75 mi
Loading nearby amenities…
Taxation est. · year 1
- Rental income
- $17,906
- − Mortgage interest
- −$10,525
- − Property taxes
- −$2,615
- − Insurance
- −$940
- − Repairs & maintenance
- −$1,433
- − Management
- −$1,433
- − Depreciation
- −$5,466
- Taxable loss
- −$4,504
- Est. tax savings @ 24.0%
- +$1,081
- After-tax cash flow
- $-151/yr
For passive investors: Depreciation is non-cash, so a rental often shows a tax loss while cash-flowing — sheltering income. Rental losses are passive: they offset passive income freely, and up to $25,000/yr can offset ordinary (W-2) income if you actively participate and your MAGI is under $100k (phasing out to $0 by $150k); unused losses carry forward. On sale, claimed depreciation is recaptured at up to 25%, and gains may owe capital-gains tax (a 1031 exchange can defer both). Figures are a year-1 estimate at your 24.0% rate — not tax advice; consult a CPA.
Schools (NCES district)
- District
- Columbus City School District
- NCES district ID
- 3904380
- Math proficiency
- 15% ▼ -17.00%
- Reading proficiency
- 26% ▼ -12.00%
- Median HH income
- $38,483
- Composite
- 17.19/100
- National rank
- #9105
- State rank
- #626 of 656 in OH
Livability — Columbus
- Score
- 81/100
- State rank
- #97
- US rank
- #1491
Category grades
Schools grade is shown separately in the Schools card above.
Census & demographics
- Census place
- Columbus, OH
- County
- Franklin County · 1,351,780 people
- City population
- 612,189
- Metro
- Columbus, OH
- Population (ZIP)
- 47,364
- Household income
- $51,417
- Rent vs Own
- Severe rent burden
- 2584.0
Population outlook (Franklin County) Hauer SSP2
- Today (2025)
- 1,456,139 people
- By 2030
- 1,556,890 · +6.9%
- By 2040
- 1,757,349 · +20.7%
- By 2050
- 1,950,539 · +34.0%
- By 2075
- 2,376,171 · +63.2%
- By 2100
- 2,636,796 · +81.1%
Race, ethnicity, and origin ACS 2023
- Neighborhood character
- Diverse neighborhood (Simpson 0.58)
- Race & ethnicity
- Black 58% White 26% Hispanic / Latino 8% Two or more races 7% Asian 1%
- Hispanic origin (detail)
- Mexican 2% Puerto Rican 1% Dominican 1%
- Common ancestry
- Swiss 1% Slovak 1% Italian 1%
- Foreign-born
- 13% · Canada, China
- Languages at home
- 86% English-only · Spanish 6% French/Haitian/Cajun 1%
Political lean MEDSL · Franklin
- 2024 margin
- Strong D (+28.4) · D 63.7% · R 35.3% · Other 1.0%
- 2008→2024 swing
- +7.7pp toward D · 2008: 20.7pp · 2024: 28.4pp
- All cycles
- 2024: D+28.4 2020: D+31.4 2016: D+25.9 2012: D+21.7 2008: D+20.7
Not yet ingested
- Civics
- —
Market trends
- HPI YoY
- ▼ -203.49%
- Current HPI
- 249.3708
- Rent YoY
- ▲ 2.36%
- Metro
- Columbus, OH
- State GDP YoY
- ▲ 1.98%
- F500 in state
- 48
Industry mix (Fortune 500 HQ in OH)
| Industry | F500 HQs | Revenue |
|---|---|---|
| Insurance | 3 | $145B |
|
||
| Industrial Machinery | 3 | $49B |
|
||
| Financial Services | 3 | $24B |
|
||
| Consumer Goods | 2 | $93B |
|
||
| Aerospace / Defense | 2 | $47B |
|
||
| Utilities | 2 | $33B |
|
||
Price history
+12858.6% since first listed9 events — show timeline
- 2026-06-08 Price Changed $187,900 CBRMLS
- 2026-05-12 Listed $189,900 CBRMLS
- 2025-12-23 Listing Removed — CBRMLS
- 2025-12-16 Listed $194,900 CBRMLS
- 2023-11-20 Rental Removed $1,375 BUILDIUM
- 2023-11-20 Listing Removed — CBRMLS
- 2023-11-09 Listed $189,900 CBRMLS
- 2023-11-06 Price Changed $1,375 BUILDIUM
- 2023-10-18 Listed for Rent $1,450 BUILDIUM
Property tax history
+9.6%/yrLatest (2024): $2,615 · +33.6% YoY. Source: county tax records.
Cash-flow waterfall
monthlySold comps — $/sqft
last 12 mo · ≤1 miLoading sold comps…