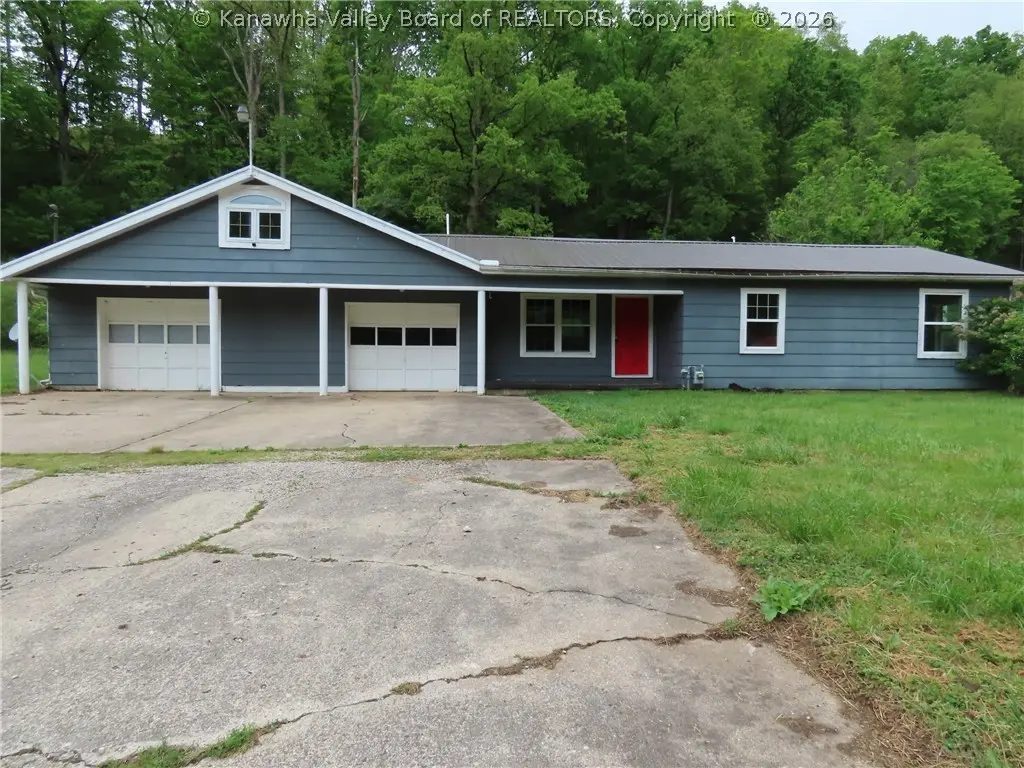
764 Fudges Creek Rd · Barboursville, WV
Flood risk No data
- FEMA flood zone
- —
- Chance of flooding over 30 yrs
- —
- Est. flood insurance / yr
- —
Fire risk No data
- Est. fire insurance / yr
- —
Heat risk No data
- Hot days now (above threshold)
- —
- Hot days in 30 yrs
- —
Wind risk No data
- Chance of severe wind over 30 yrs
- —
Air-quality risk No data
- Unhealthy air days now
- —
- Unhealthy air days in 30 yrs
- —
Risk factors via First Street. Map © Google.
Why this score? — see what drove the C- grade
The composite is a weighted blend of 9 inputs, each scored 0–100. Each bar is that input's sub-score; the figure is the points it added to the 100-point composite (weight × sub-score).
- Cash flow +17.3/30.0
- ARV discount +7.5/15.0
- Appreciation +6.2/10.0
- DSCR +5.4/10.0
- 1% rule +4.7/10.0
- Livability +4.1/5.0
- Schools +3.0/10.0
- Rent growth +2.5/5.0
- Condition / age +2.0/5.0
$119,900
🖨 Deal sheet 📄 Offer letter ✓ Due diligence
Listing remarks MLS
Great 4BR, 2BA ranch in a country setting on almost an acre with updates that include a newer metal roof, septic and great space. Huge kitchen and dining area with so much countertop space. Potential to add more sqft with the room over the garage which includes a pool table. Great storage in the two car garage and offers a fenced yard with covered patio area. Just minutes from Rt. 60, Cabell Midland and interstate.
Key facts
- Main level en suite
- Solid birch cabinets
- Unfinished basement
Tags
Property features AI
Exterior
- Parking: Attached 2-car garage
- Utilities: Public water
- Home design: Single-family residence; Single story
- Construction: Vinyl siding; Metal roof
- Exterior features: Patio; Porch
Interior
- Flooring: Carpet; Vinyl
- Bathrooms: 2 full bathrooms
- Heating & cooling: Electric forced air heating; Central electric air conditioning
- Interior features: Eat-in kitchen; Insulated windows
Neighborhood map
What this means for you Summary
Snapshot
- This is a 3-bed/2.0-bath single-family listed at $120k. Condition is rated fair.
Deal economics
- At list price, monthly cash flow is $87 ($1k/yr) — positive.
- The deal already cash-flows at list — no discount required.
- To meet the 1% rule (rent ≥ 1% of price), the offer needs to be $116k (3.4% below list).
- Recommended offer: $116k (3.4% below list) — sets the bar for 1% rule.
- Cap rate 7.2% vs local median 3.6% in Barboursville — top-decile yield for the area; either an underpriced asset or a hidden risk that comps aren't pricing in. Stress-test before assuming the spread holds.
Location & tenants
- Location reads 82/100 on livability (#8 in WV, #1,207 nationally) — a professional / high-income tenant draw. Strengths: cost of living A+, housing A+, health & safety A+; Watch: commute D+.
- Cabell County Schools (urban): math 31% / reading 42% proficiency, ranked #13 of 55 in WV (top 24%) — families likely to look elsewhere, expect single-tenant / working-renter base with shorter leases.
- Zoned schools: Ona Elementary School (math 42% / reading 47%, grade F, #71 of 377 statewide, top 22%, 266 students, 0% FRL); Milton Middle School (math 34% / reading 45%, grade F, #20 of 109 statewide, top 18%, 570 students, 0% FRL); Cabell Midland High School (math 25% / reading 56%, grade F, #19 of 110 statewide, top 17%, 1,757 students, 0% FRL) — zoned schools average 0% FRL vs 47% district-wide (47 pts lower); this property's tenant base skews higher-income than the district average.
- Market conditions: 31 active listings in the ZIP; 61 units permitted in Cabell County in 2024 (5 in 5+ unit buildings).
Forward outlook
- In year one you build about $4k of equity ($829 loan paydown + $3k appreciation (2.4% local appreciation)).
- At projected returns (2.4% appreciation + 3.0% rent growth), your $34k cash investment doubles in ~6 years — after that, you're playing with house money.
- By year 9, paydown + projected appreciation supports a ~$31k cash-out refi (75% LTV) — recoverable capital for the next deal without selling this one.
Negotiation context
- It's been on market 42 days — a 3% lower offer ($116k) is reasonable based on typical stale-listing flexibility.
- 2 sale attempts since 3y ago; this cycle's ask has dropped $20k (14%) from the opening price — seller is motivated, your offer sets the floor, not the list.
Questions for the listing agent
- It's been on market 42 days. Have you received any prior offers? Is the seller open to a 3% concession, seller financing, or rate buy-down credit?
- Have any recent inspections been done? Can we get a copy of the seller's disclosures and any deferred-maintenance estimates?
- Built in 1960 — when were the roof, HVAC, electrical panel, plumbing, and water heater last replaced?
- Is there a deadline driving the sale (1031 exchange, divorce, estate, relocation)? That informs how much negotiation room exists.
- What's the average days-on-market for RENTAL listings here right now (not sales)? A rising rental-DOM trend means longer vacancies and softer asking-rent achievability than the comps imply.
- What's the recent tenant-quality profile in this submarket — average credit score on applications, eviction rate, late-payment / NSF rate, and stable-employment percentage? A property-management company in the area should have these aggregated.
- How much new for-sale + rental construction is in the pipeline within 1–3 miles? Heavy new supply typically softens prices + rents 12–24 months out; constrained supply supports both.
Investment metrics
- 1% rule
- 0.97% ✗
- Cap rate
- 7.16%
- Cash-on-cash
- 3.10%
- DSCR
- 1.14
- GRM
- 8.6
CMA / ARV
No comps found within radius.
Projected returns pro-forma
2.36% appreciation · 3.0% rent growth · sell at horizon
- IRR
- 8.6%
- Equity multiple
- 1.48×
- Total profit
- $15,963
- Equity at exit
- $49,627
- IRR
- 11.6%
- Equity multiple
- 2.62×
- Total profit
- $54,265
- Equity at exit
- $73,302
Cash invested: $33,572 (down + closing). Projections, not guarantees.
Landlord ↔ Tenant lean methodology
- Overall (STATE)
- 83 Strongly Landlord-Friendly
- State West Virginia
- 83 Strongly Landlord-Friendly · R+22
- County
- — inherits STATE
- City
- — inherits STATE
ZIP-level market 25545
- Home prices YoY
- 1.3%
- Active inventory
- 31
- Price-to-rent
- 8.6×
Monthly cashflow live
- Estimated rent
- $1,159 medium interval (Pro) →
- Mortgage (P&I)
- −$629
- Tax est. 1.5%
- −$150 /mo · $1,798/yr
- Insurance
- −$50
- HOA
- −$0
- Vacancy / Maint / Mgmt
- −$243
- Net cashflow
- $87
Break-even live
UW: 25.0% down · 7.5% · 30yr · 1.5% tax · 5.0% vac · 8.0% maint · 8.0% mgmt
Financing live
Cash to close
- Down payment
- $29,975
- Closing costs
- $3,597
- Reserves months
- —
- Total cash needed
- —
Loan-product check · same deal, 3 products live
Conventional
25% down · 7.5% · 30yr
- Down + closing
- —
- Monthly P&I
- —
- Monthly cashflow
- —
- DSCR
- —
- Eligible?
- —
Personal DTI + credit; lowest rate.
DSCR
20% down · 8.5% · 30yr
- Down + closing
- —
- Monthly P&I
- —
- Monthly cashflow
- —
- DSCR
- —
- Eligible?
- —
No personal income docs; deal must DSCR.
Hard money
10% down · 12.0% · 12mo
- Down + closing
- —
- Monthly P&I
- —
- Monthly cashflow
- —
- DSCR
- —
- Eligible?
- —
Short-term bridge; refi at stabilization.
Listing history 19 events
-
2026-06-19days on market $119,900 Active 42 DOM
-
2026-06-18days on market $119,900 Active 41 DOM
-
2026-06-17days on market $119,900 Active 40 DOM
-
2026-06-16days on market $119,900 Active 39 DOM
-
2026-06-15days on market $119,900 Active 38 DOM
-
2026-06-14days on market $119,900 Active 36 DOM
-
2026-06-12pricedays on market $119,900 Active 35 DOM
-
2026-06-09days on market $139,900 Active 32 DOM
-
2026-06-08days on market $139,900 Active 31 DOM
-
2026-06-07days on market $139,900 Active 30 DOM
-
2026-06-05days on market $139,900 Active 27 DOM
-
2026-06-03days on market $139,900 Active 26 DOM
-
2026-06-02days on market $139,900 Active 25 DOM
-
2026-06-01days on market $139,900 Active 24 DOM
-
2026-05-31days on market $139,900 Active 23 DOM
-
2026-05-30days on market $139,900 Active 22 DOM
-
2026-05-06$139,900 Active
-
2023-09-01soldstatus $140,000 418-char remark
Show marketing remark (418 chars)
Great 4BR, 2BA ranch in a country setting on almost an acre with updates that include a newer metal roof, septic and great space. Huge kitchen and dining area with so much countertop space. Potential to add more sqft with the room over the garage which includes a pool table. Great storage in the two car garage and offers a fenced yard with covered patio area. Just minutes from Rt. 60, Cabell Midland and interstate.
-
2023-05-15$147,000 418-char remark
Show marketing remark (418 chars)
Great 4BR, 2BA ranch in a country setting on almost an acre with updates that include a newer metal roof, septic and great space. Huge kitchen and dining area with so much countertop space. Potential to add more sqft with the room over the garage which includes a pool table. Great storage in the two car garage and offers a fenced yard with covered patio area. Just minutes from Rt. 60, Cabell Midland and interstate.
ⓘ Source: listings_history table (triggers on properties + properties_extension) + one-shot
backfill from property_details.listing_events for pre-trigger history.
Nearby sold comps map
Loading sold comps map…
Walkable amenities ~0.75 mi
Loading nearby amenities…
Taxation est. · year 1
- Rental income
- $13,905
- − Mortgage interest
- −$6,716
- − Property taxes
- −$1,798
- − Insurance
- −$600
- − Repairs & maintenance
- −$1,112
- − Management
- −$1,112
- − Depreciation
- −$3,488
- Taxable loss
- −$922
- Est. tax savings @ 24.0%
- +$221
- After-tax cash flow
- $1,263/yr
For passive investors: Depreciation is non-cash, so a rental often shows a tax loss while cash-flowing — sheltering income. Rental losses are passive: they offset passive income freely, and up to $25,000/yr can offset ordinary (W-2) income if you actively participate and your MAGI is under $100k (phasing out to $0 by $150k); unused losses carry forward. On sale, claimed depreciation is recaptured at up to 25%, and gains may owe capital-gains tax (a 1031 exchange can defer both). Figures are a year-1 estimate at your 24.0% rate — not tax advice; consult a CPA.
Condition & rehab AI · 1 photo
This single-family home requires moderate repairs and maintenance to improve its condition and value. Exterior and interior paint, along with driveway repair, are the highest-impact areas for increasing both resale and rental value.
Repairs flagged
- Major exterior siding — Significant wear and tear
- Major exterior paint — Peeling and chipping
- Major concrete driveway — Cracks and deterioration
Value-add opportunities
- Both repair and paint exterior — Enhances curb appeal and value
- Both repair driveway — Improves functionality and aesthetics
- Both paint interior walls — Fresh paint improves aesthetics and value
Renovation cost estimate screening
| Repair item | Severity | Est. cost |
|---|---|---|
| exterior siding · Significant wear and tear | Major | $15,000–50,000 |
| exterior paint · Peeling and chipping | Major | $15,000–50,000 |
| concrete driveway · Cracks and deterioration | Major | $15,000–50,000 |
| Total estimated repair cost · 3 items | $45,000–150,000 |
Value-add ROI direction
- Both repair and paint exterior — Enhances curb appeal and value ↑
- Both repair driveway — Improves functionality and aesthetics ↑
- Both paint interior walls — Fresh paint improves aesthetics and value ↑
ⓘ Cost ranges are severity-bucket heuristics (US national rule-of-thumb). Get contractor quotes + a written scope before underwriting a rehab budget.
Schools (NCES district)
- District
- Cabell County Schools
- NCES district ID
- 5400180
- Math proficiency
- 31% ▼ -7.00%
- Reading proficiency
- 42% ▼ -6.00%
- Median HH income
- $36,426
- Composite
- 30.26/100
- National rank
- #6285
- State rank
- #13 of 55 in WV
Livability — Barboursville
- Score
- 82/100
- State rank
- #8
- US rank
- #1207
Category grades
Schools grade is shown separately in the Schools card above.
Census & demographics
- Population (ZIP)
- 5,005
Population outlook (Cabell County) Hauer SSP2
- Today (2025)
- 97,574 people
- By 2030
- 98,060 · +0.5%
- By 2040
- 98,817 · +1.3%
- By 2050
- 100,185 · +2.7%
- By 2075
- 105,895 · +8.5%
- By 2100
- 105,948 · +8.6%
Race, ethnicity, and origin ACS 2023
- Neighborhood character
- Predominantly White (95%)
- Race & ethnicity
- White 95% Two or more races 2% Black 2%
- Common ancestry
- Slovak 11% Greek 1% Serbian 1%
- Foreign-born
- 0%
Political lean MEDSL · Cabell
- 2024 margin
- Strong R (+21.9) · D 38.0% · R 59.9% · Other 2.0%
- 2008→2024 swing
- -11.8pp toward R · 2008: -10.1pp · 2024: -21.9pp
- All cycles
- 2024: R+21.9 2020: R+18.0 2016: R+25.5 2012: R+13.9 2008: R+10.1
Not yet ingested
- Civics
- —
Market trends
- HPI YoY
- ▲ 2.36%
- Current HPI
- 179.4941
- Rent YoY
- —
- Metro
- —
- State GDP YoY
- —
- F500 in state
- 0
Price history
-4.8% since first listed3 events — show timeline
- 2026-05-06 Listed $139,900 KVBOR
- 2023-09-01 Sold (MLS) $140,000 HBRMLS
- 2023-05-15 Listed $147,000 HBRMLS
Cash-flow waterfall
monthlySold comps — $/sqft
last 12 mo · ≤1 miLoading sold comps…