2718 Grange Ct · Hamilton, NJ
Flood risk 1/10 · Minimal
- FEMA flood zone
- X (unshaded)
- Chance of flooding over 30 yrs
- 0.0%
- Est. flood insurance / yr
- $507 – $1,088
Fire risk 3/10 · Minor
- Est. fire insurance / yr
- $526 – $976
Heat risk 8/10 · Major
- Hot days now (above 102°F)
- 7 days/yr
- Hot days in 30 yrs
- 15 days/yr
Wind risk 8/10 · Major
- Chance of severe wind over 30 yrs
- 80.0%
Air-quality risk 2/10 · Minimal
- Unhealthy air days now
- 1 days/yr
- Unhealthy air days in 30 yrs
- 2 days/yr
Risk factors via First Street. Map © Google.
Why this score? — see what drove the D grade
The composite is a weighted blend of 9 inputs, each scored 0–100. Each bar is that input's sub-score; the figure is the points it added to the 100-point composite (weight × sub-score).
- Appreciation +10.0/10.0
- Cash flow +7.6/30.0
- ARV discount +7.4/15.0
- 1% rule +4.8/10.0
- Rent growth +2.5/5.0
- Livability +2.5/5.0
- Condition / age +2.5/5.0
- Schools +2.1/10.0
- DSCR +1.7/10.0
$245,000
🖨 Deal sheet (PDF) 📄 Offer letter ✓ Due diligence
Listing remarks MLS
This is what you have been waiting for! Totally remodeled 2-bedroom, 2-bath corner condo located in the desirable Timber Glen community. Once inside you will find a bright open layout perfect for everyday living and enjoyment. The kitchen offers plenty of cabinet space and flows into the main living. The 1st floor main bedroom features generous closet space and a remodeled bath, while the second bedroom has a full bathroom too. conveniently located close to shopping, dining, and major roadways. This move-in ready condo is looking for a buyer who is ready to go.
Key facts
- Bright open layout
- Remodeled bath
- Conveniently located
Tags
Property features AI
Finance
- HOA & community: Monthly association fee of $493; Association amenities include outdoor pool and tennis courts; Association fee covers other items (unspecified)
Exterior
- Parking: Assigned parking space in a parking lot (1 assigned space)
- Utilities: Public water; Public sewer
- Home design: End-of-row townhouse; Fee simple ownership; Entry level is level with the main floor
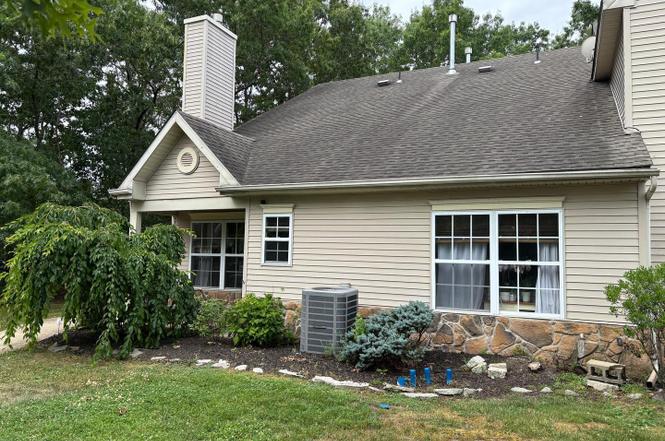
- Construction: Vinyl siding and stone exterior; Built (year per assessor); Slab foundation
- Exterior features: Community outdoor pool; Tennis courts; Not in a federal flood zone; Pets allowed with size/weight restrictions
Interior
- Bedrooms: One bedroom on the main level; One bedroom on the first upper level
- Bathrooms: Two full bathrooms (one on main level, one on first upper level)
- Heating & cooling: Forced air heating fueled by natural gas; Central air conditioning (natural gas cooling fuel); Natural gas hot water
- Interior features: Assessor-reported living area; Level entry to main level
Neighborhood map
What this means for you Summary
Snapshot
- This is a 2-bed/2.0-bath townhouse listed at $245k.
Deal economics
- At list price, monthly cash flow is $-298 ($-4k/yr) — negative.
- To cash-flow at today's rent, offer at most $202k (17.6% below list).
- To meet the 1% rule (rent ≥ 1% of price), the offer needs to be $239k (2.4% below list).
- Recommended offer: $202k (17.6% below list) — sets the bar for cash-flow.
Location & tenants
- Location reads: area grade D — affects rentability + tenant quality, not the cash-flow math above.
- Hamilton Township School District (suburban): math 9% / reading 37% proficiency, ranked #401 of 472 in NJ (top 85%) — low school quality limits family demand, transient renter base, plan for 1-2y turnover.
- Zoned schools: George L. Hess Educational Complex (math 8% / reading 32%, grade F, #990 of 1,303 statewide, top 76%, 1,363 students, 53% FRL); William Davies Middle School (math 10% / reading 41%, grade F, #359 of 431 statewide, top 84%, 930 students, 51% FRL); Oakcrest High School (math 9% / reading 36%, grade F, #342 of 399 statewide, top 86%, 914 students, 61% FRL) — zoned schools average 55% FRL vs 37% district-wide (18 pts higher); higher-poverty schools than district average — tighter screening recommended.
- Market conditions: 244 active listings in the ZIP; 8 comparable units currently listed for rent nearby; rentals at typical pace (median 16d on market — plan ~3-4 weeks tenant-placement turnaround); solid renter incomes; 672 units permitted in Atlantic County in 2024 (258 in 5+ unit buildings).
- This rent runs 37% of the median local income ($77k/yr) — at the standard rent-burdened threshold; future hikes will face affordability resistance.
Forward outlook
- In year one you build about $26k of equity ($2k loan paydown + $24k appreciation (10.0% local appreciation)).
- Atlantic County population projected at -12% by 2050 — secular population decline; favor cash flow + early exit over multi-decade hold.
- By year 2, paydown + projected appreciation supports a ~$42k cash-out refi (75% LTV) — recoverable capital for the next deal without selling this one.
Negotiation context
- Only 1 days on market — expect competitive offers; lowballing is unlikely to land.
- 3 sale attempts since 6y ago with the ask held roughly flat each time — persistent listings suggest the price (not the market) is what's stuck; bring a comps-based counter.
- Current owner paid $140k; list at $245k implies a 74% gain — meaningful room to come down on a strong offer.
Risks & watch-outs
- Watch-outs: HOA is 21% of rent.
- Climate carrying-cost: severe wind risk, 80% chance of damaging wind over 30y; extreme-heat days projected 7→15/yr by 2055 (HVAC capex compounding) — expect insurance premiums to compound above CPI over the hold.
Questions for the listing agent
- What do current leases actually rent for vs. the listed asking? Can we see a recent rent roll and the last 12 months of T-12 income?
- What does the HOA fee cover, when was the last increase, and are there any pending special assessments or reserve-fund shortfalls?
- Is there a deadline driving the sale (1031 exchange, divorce, estate, relocation)? That informs how much negotiation room exists.
- The area grade is low — what's the realistic commute time and amenity access for the typical tenant pool here? Any planned neighborhood developments (good or bad) we should know about?
- What's the average days-on-market for RENTAL listings here right now (not sales)? A rising rental-DOM trend means longer vacancies and softer asking-rent achievability than the comps imply.
- What's the recent tenant-quality profile in this submarket — average credit score on applications, eviction rate, late-payment / NSF rate, and stable-employment percentage? A property-management company in the area should have these aggregated.
- How much new for-sale + rental construction is in the pipeline within 1–3 miles? Heavy new supply typically softens prices + rents 12–24 months out; constrained supply supports both.
Investment metrics
- 1% rule
- 0.98% ✗
- Cap rate
- 4.84%
- Cash-on-cash
- -5.20%
- DSCR
- 0.77
- GRM
- 8.5
CMA / ARV
- ARV (on-the-fly)
- $244,205
- Comps found
- 12
Show comp detail 12 sales within ~0.75 mi
| Address | Dist | Beds/Ba | Sqft | Sold | Price | $/sf | Match |
|---|---|---|---|---|---|---|---|
| 2713 Falcon Ct | 0.06mi | 2/2.0 | 1,188 (+8%) | 11mo | $235,000 | $198 | 75 |
| 2614 Canyon Ct #2614 | 0.22mi | 2/2.0 | 1,177 (+6%) | 8mo | $235,000 | $200 | 72 |
| 2705 Canyon Ct | 0.18mi | 2/2.0 | 1,177 (+6%) | 15mo | $259,900 | $221 | 68 |
| 2705 Canyon Ct #2705 | 0.18mi | 2/2.0 | 1,177 (+6%) | 15mo | $259,900 | $221 | 68 |
| 2619 Boulder Ct | 0.14mi | 2/2.0 | 955 (-14%) | 5mo | $235,000 | $246 | 67 |
| 2619 Durango Ct #2619 | 0.09mi | 2/1.0 | 955 (-14%) | 4mo | $225,000 | $236 | 66 |
| 2618 Flagstaff Ct #2001 | 0.05mi | 2/2.0 | 955 (-14%) | 11mo | $200,000 | $209 | 66 |
| 2618 Flagstaff Ct | 0.06mi | 2/2.0 | 955 (-14%) | 11mo | $200,000 | $209 | 66 |
| 2619 Durango Ct | 0.14mi | 2/1.0 | 955 (-14%) | 4mo | $225,000 | $236 | 64 |
| 2819 Canyon Ct #1001 | 0.12mi | 2/2.0 | 955 (-14%) | 14mo | $211,150 | $221 | 60 |
| 2603 Canyon Ct #2603 | 0.22mi | 2/2.0 | 955 (-14%) | 10mo | $223,000 | $234 | 59 |
| 2603 Canyon Ct | 0.22mi | 1/1.0 (-1) | 955 (-14%) | 10mo | $223,000 | $234 | 50 |
Match score weights: distance 35% · size 25% · config 20% · recency 20%. Top-matched comps best support the ARV.
Projected returns pro-forma
10.0% appreciation · 3.0% rent growth · sell at horizon
- IRR
- 20.6%
- Equity multiple
- 2.67×
- Total profit
- $114,823
- Equity at exit
- $220,715
- IRR
- 18.8%
- Equity multiple
- 6.16×
- Total profit
- $353,711
- Equity at exit
- $475,981
Cash invested: $68,600 (down + closing). Projections, not guarantees.
Landlord ↔ Tenant lean methodology
- Overall (STATE)
- 21 Tenant-Leaning
- State New Jersey
- 21 Tenant-Leaning · D+6
- County
- — inherits STATE
- City
- — inherits STATE
ZIP-level market 08330
- Home prices YoY
- 3.9%
- Active inventory
- 244
- Price-to-rent
- 8.5×
Monthly cashflow live
- Estimated rent
- $2,391 high interval (Pro) →
- Mortgage (P&I)
- −$1,285
- Tax est. 1.5%
- −$306 /mo · $3,675/yr
- Insurance
- −$102
- HOA
- −$493
- Vacancy / Maint / Mgmt
- −$502
- Net cashflow
- $-298
Break-even live
Sensitivity live
| Price | -10% $-128 | -5% $-213 | +0% $-298 | +5% $-382 | +10% $-467 |
|---|---|---|---|---|---|
| Rent | -10% $-486 | -5% $-392 | +0% $-298 | +5% $-203 | +10% $-109 |
| Rate | -1.0pp $-174 | -0.5pp $-235 | base $-298 | +0.5pp $-361 | +1.0pp $-426 |
UW: 25.0% down · 7.5% · 30yr · 1.5% tax · 5.0% vac · 8.0% maint · 8.0% mgmt
Financing live
Cash to close
- Down payment
- $61,250
- Closing costs
- $7,350
- Reserves months
- —
- Total cash needed
- —
Loan-product check · same deal, 3 products live
Conventional
25% down · 7.5% · 30yr
- Down + closing
- —
- Monthly P&I
- —
- Monthly cashflow
- —
- DSCR
- —
- Eligible?
- —
Personal DTI + credit; lowest rate.
DSCR
20% down · 8.5% · 30yr
- Down + closing
- —
- Monthly P&I
- —
- Monthly cashflow
- —
- DSCR
- —
- Eligible?
- —
No personal income docs; deal must DSCR.
Hard money
10% down · 12.0% · 12mo
- Down + closing
- —
- Monthly P&I
- —
- Monthly cashflow
- —
- DSCR
- —
- Eligible?
- —
Short-term bridge; refi at stabilization.
Rent comps 8 comps
| Address | Beds | Baths | Sqft | Rent | $/sqft | DOM | Units | Dist |
|---|---|---|---|---|---|---|---|---|
| 2605 Flagstaff Ct #2605 Mays Landing, NJ | 2.0 | 2.0 | 1250 | $2,500 | $2.00 | 23d | 1 | 0.09mi |
| 2000 Timber Glen Dr Mays Landing, NJ | 2.0–3.0 | 2.5 | 1577 | $2,441 | $1.55 | 15d | 2 | 0.22mi |
| 2703 Mimosa Ct Mays Landing, NJ | 2.0 | 1.5 | 1268 | $2,200 | $1.74 | 15d | 1 | 0.90mi |
| 2807 Hawthorn Ct Mays Landing, NJ | 1.0 | 1.0 | 929 | $1,800 | $1.94 | 15d | 1 | 0.92mi |
| 2529 Cottonwood Ct Mays Landing, NJ | 2.0 | 1.5 | 1376 | $2,200 | $1.60 | 45d | 1 | 1.08mi |
| 2529 Cottonwood Ct Mays Landing, NJ | 2.0 | 1.5 | 1376 | $2,200 | $1.60 | 15d | 1 | 1.08mi |
| 3401 Montgomery Dr Mays Landing, NJ | 1.0–2.0 | 1.0–2.0 | 1192 | $2,810 | $2.36 | 15d | 18 | 1.14mi |
| 6020 Delilah Rd Egg Harbor Township, NJ | 1.0–2.0 | 1.0–2.0 | 1009 | $2,425 | $2.40 | 15d | 1 | 1.49mi |
HOA detail
- Monthly dues
- $493 · $5,916/yr
Listing history 2 events
-
2026-06-21remarks 567-char remark
-
2026-06-21$245,000 Active 1 DOM
ⓘ Source: listings_history table (triggers on properties + properties_extension) + one-shot
backfill from property_details.listing_events for pre-trigger history.
Climate risk First Street
- Flood 1/10 Low FEMA zone X (unshaded) · 0% chance over 30 yrs
- Wildfire 3/10 Moderate
- Heat 8/10 Severe 7 d/yr ≥102°F today · 15 d/yr by 30 yrs out
- Wind 8/10 Severe 80% chance of damaging wind over 30 yrs
- Air quality 2/10 Low 1 unhealthy d/yr today · 2 by 30 yrs out
Nearby sold comps map
Loading sold comps map…
Walkable amenities ~0.75 mi
Loading nearby amenities…
Taxation est. · year 1
- Rental income
- $28,688
- − Mortgage interest
- −$13,724
- − Property taxes
- −$3,675
- − Insurance
- −$1,225
- − Repairs & maintenance
- −$2,295
- − Management
- −$2,295
- − HOA
- −$5,916
- − Depreciation
- −$7,127
- Taxable loss
- −$7,569
- Est. tax savings @ 24.0%
- +$1,817
- After-tax cash flow
- $-1,754/yr
For passive investors: Depreciation is non-cash, so a rental often shows a tax loss while cash-flowing — sheltering income. Rental losses are passive: they offset passive income freely, and up to $25,000/yr can offset ordinary (W-2) income if you actively participate and your MAGI is under $100k (phasing out to $0 by $150k); unused losses carry forward. On sale, claimed depreciation is recaptured at up to 25%, and gains may owe capital-gains tax (a 1031 exchange can defer both). Figures are a year-1 estimate at your 24.0% rate — not tax advice; consult a CPA.
Schools (NCES district)
- District
- Hamilton Township School District
- NCES district ID
- 3406510
- Math proficiency
- 9% ▼ -20.00%
- Reading proficiency
- 37% ▼ -9.00%
- Median HH income
- $60,997
- Composite
- 21.34/100
- National rank
- #8372
- State rank
- #401 of 472 in NJ
Livability — Hamilton
No livability data for this city. (Only ~50 U.S. cities are tracked.)
Census & demographics
- Census place
- McKee City, NJ
- County
- Atlantic County · 143,611 people
- Metro
- Atlantic City-Hammonton, NJ
- Population (ZIP)
- 29,972
- Household income
- $77,167
- Rent vs Own
- Severe rent burden
- 1003.0
Population outlook (Atlantic County) Hauer SSP2
- Today (2025)
- 268,948 people
- By 2030
- 264,497 · -1.7%
- By 2040
- 252,261 · -6.2%
- By 2050
- 237,846 · -11.6%
- By 2075
- 210,650 · -21.7%
- By 2100
- 180,234 · -33.0%
Race, ethnicity, and origin ACS 2023
- Neighborhood character
- Diverse neighborhood (Simpson 0.62)
- Race & ethnicity
- White 58% Hispanic / Latino 16% Black 14% Two or more races 13% Asian 4%
- Hispanic origin (detail)
- Puerto Rican 7% Dominican 4%
- Common ancestry
- Romanian 3% Italian 2% Lithuanian 1%
- Foreign-born
- 9% · Canada, Vietnam, Guatemala
- Languages at home
- 84% English-only · Spanish 10% Tagalog/Filipino 1% Other Indo-European 1%
Political lean MEDSL · Atlantic
- 2024 margin
- Toss-up / Even · D 47.7% · R 50.7% · Other 1.6%
- 2008→2024 swing
- -18.1pp toward R · 2008: 15.1pp · 2024: -3.0pp
- All cycles
- 2024: R+3.0 2020: D+6.7 2016: D+6.2 2012: D+17.2 2008: D+15.1
Not yet ingested
- Civics
- —
Market trends
- HPI YoY
- ▲ 11.58%
- Current HPI
- 308.5148
- Rent YoY
- —
- Metro
- Atlantic City-Hammonton, NJ
- State GDP YoY
- ▲ 2.05%
- F500 in state
- 34
Industry mix (Fortune 500 HQ in NJ)
| Industry | F500 HQs | Revenue |
|---|---|---|
| Consumer Goods | 3 | $31B |
|
||
| Pharmaceuticals | 2 | $153B |
|
||
| Technology | 2 | $21B |
|
||
| Insurance | 2 | $20B |
|
||
| Healthcare | 2 | $19B |
|
||
| Financial Services | 1 | $70B |
|
||
Price history
+67.9% since first listed5 events — show timeline
- 2026-06-21 Listed $245,000 BRIGHT MLS
- 2026-06-20 Listed $245,000 SJSRMLS
- 2020-04-30 Sold (MLS) $140,500 BRIGHT MLS
- 2020-03-27 Pending — BRIGHT MLS
- 2020-03-18 Listed $145,900 BRIGHT MLS
Cash-flow waterfall
monthlySold comps — $/sqft
last 12 mo · ≤1 miLoading sold comps…