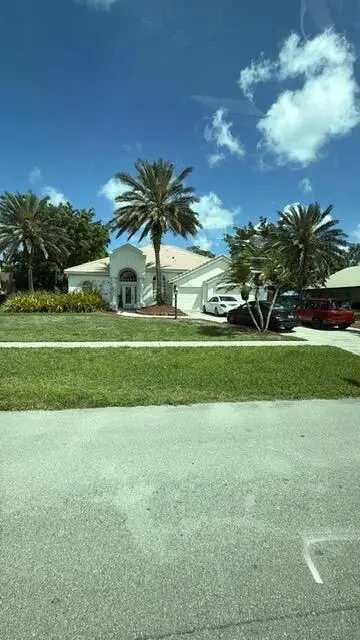
4447 Hunting Trl · Wellington, FL
Flood risk 1/10 · Minimal
- FEMA flood zone
- X (unshaded)
- Chance of flooding over 30 yrs
- 0.0%
- Est. flood insurance / yr
- $507 – $1,088
Fire risk 1/10 · Minimal
- Est. fire insurance / yr
- $947 – $1,759
Heat risk 9/10 · Severe
- Hot days now (above 106°F)
- 7 days/yr
- Hot days in 30 yrs
- 25 days/yr
Wind risk 10/10 · Severe
- Chance of severe wind over 30 yrs
- 99.0%
Air-quality risk 2/10 · Minimal
- Unhealthy air days now
- 0 days/yr
- Unhealthy air days in 30 yrs
- 2 days/yr
Risk factors via First Street. Map © Google.
Why this score? — see what drove the C- grade
The composite is a weighted blend of 9 inputs, each scored 0–100. Each bar is that input's sub-score; the figure is the points it added to the 100-point composite (weight × sub-score).
- Cash flow +21.5/30.0
- ARV discount +7.5/15.0
- DSCR +6.9/10.0
- 1% rule +5.5/10.0
- Schools +4.3/10.0
- Livability +3.7/5.0
- Condition / age +2.5/5.0
- Rent growth +2.4/5.0
- Appreciation +0.0/10.0
$399,000
🖨 Deal sheet 📄 Offer letter ✓ Due diligence
Listing remarks
Live Auction at the Property! Sat June 13, 11am! Preview 30 minutes prior to sale. 10% due at time of sale. Must have a 10,000 cashier's check and a blank personal check in order to bid. 30 days to close. Seller guarantees a free and clear title. Suggested opening bid 399,000
Key facts
- 0.51 acre lot
- 2 garage spots
- Pool
Property features AI
Exterior
- Parking: Attached 2-car garage (4 parking spaces total, 2 covered)
- Utilities: Public water; Public sewer; Electricity connected; Water connected; Sewer connected
- Home design: Single-family residence; One story; North-facing
- Construction: Concrete block construction with stucco; Spanish tile roof; Built as resale property
- Exterior features: Private pool with concrete finish; Waterfront property
Interior
- Kitchen: Dishwasher
- Bedrooms: Three bedrooms on the main level
- Flooring: Ceramic tile
- Bathrooms: Three full bathrooms on the main level
- Heating & cooling: Central heating; Central air conditioning
- Interior features: Electric water heater; Dishwasher; Ceramic tile flooring
Neighborhood map
What this means for you Summary
Snapshot
- This is a 4-bed/2.0-bath single-family listed at $399k.
Deal economics
- At list price, monthly cash flow is $598 ($7k/yr) — positive.
- The deal already cash-flows at list — no discount required.
- Meets the 1% rule at list price ($4k rent vs $399k).
- Cap rate 8.1% vs local median 3.4% in Wellington — top-decile yield for the area; either an underpriced asset or a hidden risk that comps aren't pricing in. Stress-test before assuming the spread holds.
Location & tenants
- Location reads 73/100 on livability (#294 in FL, #4,986 nationally) — a middle-class / working-renter tenant base. Strengths: crime A+, employment A+, housing A+; Watch: amenities F, commute F, cost of living F.
- Palm Beach (suburban): math 46% / reading 53% proficiency, ranked #34 of 73 in FL (top 47%) — families likely to look elsewhere, expect single-tenant / working-renter base with shorter leases.
- Zoned schools: Discovery Key Elementary School (math 61% / reading 72%, grade B+, #473 of 2,144 statewide, top 23%, 1,050 students, 31% FRL); Woodlands Middle School (math 51% / reading 58%, grade B-, #183 of 571 statewide, top 34%, 1,551 students, 40% FRL) — zoned schools average 36% FRL vs 52% district-wide (16 pts lower); this property's tenant base skews higher-income than the district average.
- Market conditions: Rents soft (-0.4%/yr); 651 active listings in the ZIP; 36 comparable units currently listed for rent nearby; rentals at typical pace (median 24d on market — plan ~3-4 weeks tenant-placement turnaround); solid renter incomes; 3,974 units permitted in Palm Beach County in 2024 (1,012 in 5+ unit buildings).
- At $4,184/mo this rent would consume 52% of the median local household income ($96k/yr) (locally 960% of renters already pay >50% of income on rent) — very limited rent-growth headroom before tenants either downsize or default.
Forward outlook
- Local home prices are declining (-3.0%/yr); year-one equity from $3k of loan paydown is wiped out by about $12k of value loss. Plan a longer hold.
- Palm Beach County population projected at +30% by 2050 — long-run rental-demand tailwind backs the buy-and-hold thesis.
Negotiation context
- Only 8 days on market — expect competitive offers; lowballing is unlikely to land.
- Current owner paid $142k; list at $399k implies a 181% gain — meaningful room to come down on a strong offer.
Risks & watch-outs
- Climate carrying-cost: severe wind risk, 99% chance of damaging wind over 30y; extreme-heat days projected 7→25/yr by 2055 (HVAC capex compounding) — expect insurance premiums to compound above CPI over the hold.
Questions for the listing agent
- Is there a deadline driving the sale (1031 exchange, divorce, estate, relocation)? That informs how much negotiation room exists.
- Schools are A-rated — typically a magnet for longer-tenancy family renters. What's the average tenant stay here, and is there a school-zone premium baked into asking?
- What's the average days-on-market for RENTAL listings here right now (not sales)? A rising rental-DOM trend means longer vacancies and softer asking-rent achievability than the comps imply.
- What's the recent tenant-quality profile in this submarket — average credit score on applications, eviction rate, late-payment / NSF rate, and stable-employment percentage? A property-management company in the area should have these aggregated.
- How much new for-sale + rental construction is in the pipeline within 1–3 miles? Heavy new supply typically softens prices + rents 12–24 months out; constrained supply supports both.
Investment metrics
- 1% rule
- 1.05% ✓
- Cap rate
- 8.09%
- Cash-on-cash
- 6.42%
- DSCR
- 1.29
- GRM
- 7.9
CMA / ARV
No comps found within radius.
Projected returns pro-forma
-3.0% appreciation · 0.0% rent growth · sell at horizon
- IRR
- -9.8%
- Equity multiple
- 0.65×
- Total profit
- $-38,811
- Equity at exit
- $59,492
- IRR
- -5.1%
- Equity multiple
- 0.71×
- Total profit
- $-32,027
- Equity at exit
- $34,498
Cash invested: $111,720 (down + closing). Projections, not guarantees.
Landlord ↔ Tenant lean methodology
- Overall (STATE)
- 87 Strongly Landlord-Friendly
- State Florida
- 87 Strongly Landlord-Friendly · R+3
- County
- — inherits STATE
- City
- — inherits STATE
ZIP-level market 33467
- Rents YoY
- -0.4%
- Active inventory
- 651
- Price-to-rent
- 7.9×
Monthly cashflow live
- Estimated rent
- $4,184 high interval (Pro) →
- Mortgage (P&I)
- −$2,092
- Tax from tax record
- −$449 /mo · $5,390/yr
- Insurance
- −$166
- HOA
- −$0
- Vacancy / Maint / Mgmt
- −$879
- Net cashflow
- $598
Break-even live
UW: 25.0% down · 7.5% · 30yr · 1.5% tax · 5.0% vac · 8.0% maint · 8.0% mgmt
Financing live
Cash to close
- Down payment
- $99,750
- Closing costs
- $11,970
- Reserves months
- —
- Total cash needed
- —
Loan-product check · same deal, 3 products live
Conventional
25% down · 7.5% · 30yr
- Down + closing
- —
- Monthly P&I
- —
- Monthly cashflow
- —
- DSCR
- —
- Eligible?
- —
Personal DTI + credit; lowest rate.
DSCR
20% down · 8.5% · 30yr
- Down + closing
- —
- Monthly P&I
- —
- Monthly cashflow
- —
- DSCR
- —
- Eligible?
- —
No personal income docs; deal must DSCR.
Hard money
10% down · 12.0% · 12mo
- Down + closing
- —
- Monthly P&I
- —
- Monthly cashflow
- —
- DSCR
- —
- Eligible?
- —
Short-term bridge; refi at stabilization.
Rent comps 36 comps
| Address | Beds | Baths | Sqft | Rent | $/sqft | DOM | Units | Dist |
|---|---|---|---|---|---|---|---|---|
| 9676 Eagle Point Ln Lake Worth, FL | 4.0 | 3.0 | 2815 | $5,800 | $2.06 | 24d | 1 | 0.23mi |
| 10640 Oak Meadow Ln Lake Worth, FL | 4.0 | 3.0 | 2727 | $7,500 | $2.75 | 17d | 1 | 0.76mi |
| 4839 Navali Dr Lake Worth, FL | 3.0 | 2.5 | 2124 | $3,300 | $1.55 | 24d | 1 | 0.78mi |
| 4841 Exeter Estate Ln Lake Worth, FL | 3.0 | 3.0 | 2567 | $5,000 | $1.95 | 24d | 1 | 0.81mi |
| 4790 Navali Dr Lake Worth, FL | 3.0 | 2.5 | 1708 | $3,200 | $1.87 | 24d | 1 | 0.81mi |
| 9108 Kingsmoor Way Lake Worth, FL | 3.0 | 2.5 | 1918 | $3,400 | $1.77 | 10d | 1 | 0.83mi |
| 9006 Zevon Ct Lake Worth, FL | 3.0 | 2.5 | 2032 | $3,300 | $1.62 | 24d | 1 | 0.83mi |
| 8951 Kingsmoor Way Lake Worth, FL | 3.0 | 2.5 | 1918 | $3,500 | $1.82 | 4d | 1 | 0.85mi |
| 8914 Kingsmoor Way Lake Worth, FL | 3.0 | 2.0 | 2019 | $4,500 | $2.23 | 10d | 1 | 0.89mi |
| 8914 Kingsmoor Way Lake Worth, FL | 3.0 | 2.0 | 2019 | $4,500 | $2.23 | 24d | 1 | 0.89mi |
| 8883 Kingsmoor Way Lake Worth, FL | 3.0 | 2.0 | 1997 | $4,225 | $2.12 | 10d | 1 | 0.93mi |
| 10372 Old Winston Ct Lake Worth, FL | 3.0 | 2.0 | 1798 | $3,395 | $1.89 | 7d | 1 | 0.94mi |
| 10173 Andover Coach Cir Unit G2 Lake Worth, FL | 3.0 | 2.0 | 1807 | $3,500 | $1.94 | 24d | 1 | 0.95mi |
| 4985 Navali Dr Lake Worth, FL | 3.0 | 2.5 | 1604 | $3,050 | $1.90 | 1d | 1 | 0.96mi |
| 4553 Barclay Fair Way Lake Worth, FL | 3.0 | 3.0 | 2278 | $4,000 | $1.76 | 24d | 1 | 0.97mi |
| 4553 Barclay Fair Way Lake Worth, FL | 3.0 | 3.0 | 2278 | $4,000 | $1.76 | 16d | 1 | 0.97mi |
| 10434 White Pinto Ct Lake Worth, FL | 5.0 | 3.0 | 2708 | $4,195 | $1.55 | 24d | 1 | 1.01mi |
| 4845 Chantilly Rd Lake Worth, FL | 3.0 | 2.5 | 1879 | $3,450 | $1.84 | 3d | 1 | 1.08mi |
| 4837 Chantilly Rd Lake Worth, FL | 3.0 | 2.5 | 1826 | $3,300 | $1.81 | 24d | 1 | 1.08mi |
| 4757 Roldan Ct Lake Worth, FL | 4.0 | 3.5 | 2585 | $4,500 | $1.74 | 24d | 1 | 1.17mi |
| 8835 Sandy Creek Way Lake Worth, FL | 3.0 | 2.5 | 2049 | $3,500 | $1.71 | 24d | 1 | 1.23mi |
| 4689 Eventing St Lake Worth, FL | 3.0 | 2.5 | 1870 | $3,300 | $1.76 | 24d | 1 | 1.28mi |
| 8807 Antarus Dr Lake Worth, FL | 3.0 | 2.5 | 1954 | $3,700 | $1.89 | 24d | 1 | 1.28mi |
| 8807 Antarus Dr Lake Worth, FL | 3.0 | 2.5 | 1954 | $3,700 | $1.89 | 14d | 1 | 1.28mi |
| 4675 Eventing St Lake Worth, FL | 3.0 | 2.5 | 1909 | $3,650 | $1.91 | 24d | 1 | 1.29mi |
| 8413 Linden Way Lake Worth, FL | 4.0 | 2.0 | 1800 | $3,500 | $1.94 | 11d | 1 | 1.33mi |
| 8309 Catria Ln Lake Worth, FL | 3.0 | 2.5 | 1911 | $3,300 | $1.73 | 24d | 1 | 1.35mi |
| 10295 Trianon Pl Wellington, FL | 5.0 | 3.0 | 3297 | $6,600 | $2.00 | 2d | 1 | 1.37mi |
| 8641 Antarus Dr Lake Worth, FL | 3.0 | 2.5 | 1724 | $3,350 | $1.94 | 4d | 1 | 1.39mi |
| 8641 Antarus Dr Lake Worth, FL | 3.0 | 2.5 | 1724 | $3,250 | $1.89 | 3d | 1 | 1.39mi |
| 4802 San Fratello Cir Lake Worth, FL | 3.0 | 3.0 | 2309 | $3,550 | $1.54 | 24d | 1 | 1.43mi |
| 4802 San Fratello Cir Unit 1 Lake Worth, FL | 3.0 | 2.5 | 2309 | $3,550 | $1.54 | 24d | 1 | 1.43mi |
| 8333 Rearing Ln Lake Worth, FL | 3.0 | 2.5 | 1884 | $3,500 | $1.86 | 21d | 1 | 1.48mi |
| 8333 Rearing Ln Lake Worth, FL | 3.0 | 2.5 | 1884 | $3,500 | $1.86 | 19d | 1 | 1.48mi |
| 8333 Rearing Ln Lake Worth, FL | 3.0 | 2.5 | 1884 | $3,500 | $1.86 | 15d | 1 | 1.48mi |
| 5901 White Cypress Dr Lake Worth, FL | 4.0 | 3.0 | 2200 | $3,950 | $1.80 | 24d | 1 | 1.49mi |
Listing history 6 events
-
2026-06-15status $399,000 Pending 8 DOM
-
2026-06-13days on market $399,000 Active 8 DOM
-
2026-06-09days on market $399,000 Active 4 DOM
-
2026-06-08days on market $399,000 Active 3 DOM
-
2026-06-07remarks 276-char remark
-
2026-06-07$399,000 Active 2 DOM
ⓘ Source: listings_history table (triggers on properties + properties_extension) + one-shot
backfill from property_details.listing_events for pre-trigger history.
Tax reassessment forecast FL · Resets to sale price
- Current annual tax
- $5,390 · $449/mo
- Projected year-2 tax
- $5,390 · $449/mo
- Expected delta
- $0/yr ($0/mo · 0.0%)
ⓘ Screening estimate from a state-policy table — verify with the county assessor before closing.
Climate risk First Street
- Flood 1/10 Low FEMA zone X (unshaded) · 0% chance over 30 yrs
- Wildfire 1/10 Low
- Heat 9/10 Extreme 7 d/yr ≥106°F today · 25 d/yr by 30 yrs out
- Wind 10/10 Extreme 99% chance of damaging wind over 30 yrs
- Air quality 2/10 Low 0 unhealthy d/yr today · 2 by 30 yrs out
Nearby sold comps map
Loading sold comps map…
Walkable amenities ~0.75 mi
Loading nearby amenities…
Taxation est. · year 1
- Rental income
- $50,212
- − Mortgage interest
- −$22,350
- − Property taxes
- −$5,390
- − Insurance
- −$1,995
- − Repairs & maintenance
- −$4,017
- − Management
- −$4,017
- − Depreciation
- −$11,607
- Taxable income
- $835
- Est. tax owed @ 24.0%
- −$201
- After-tax cash flow
- $6,973/yr
For passive investors: Depreciation is non-cash, so a rental often shows a tax loss while cash-flowing — sheltering income. Rental losses are passive: they offset passive income freely, and up to $25,000/yr can offset ordinary (W-2) income if you actively participate and your MAGI is under $100k (phasing out to $0 by $150k); unused losses carry forward. On sale, claimed depreciation is recaptured at up to 25%, and gains may owe capital-gains tax (a 1031 exchange can defer both). Figures are a year-1 estimate at your 24.0% rate — not tax advice; consult a CPA.
Schools (NCES district)
- District
- Palm Beach
- NCES district ID
- 1201500
- Math proficiency
- 46% ▼ -16.00%
- Reading proficiency
- 53% ▼ -4.00%
- Median HH income
- $53,943
- Composite
- 42.72/100
- National rank
- #3160
- State rank
- #34 of 73 in FL
Livability — Wellington
- Score
- 73/100
- State rank
- #294
- US rank
- #4986
Category grades
Schools grade is shown separately in the Schools card above.
Census & demographics
- County
- Palm Beach County · 1,438,312 people
- City population
- 60,184
- Metro
- Miami-Fort Lauderdale-Pompano Beach, FL
- Population (ZIP)
- 58,411
- Household income
- $95,739
- Rent vs Own
- Severe rent burden
- 960.0
Population outlook (Palm Beach County) Hauer SSP2
- Today (2025)
- 1,637,487 people
- By 2030
- 1,743,255 · +6.5%
- By 2040
- 1,948,712 · +19.0%
- By 2050
- 2,132,979 · +30.3%
- By 2075
- 2,530,027 · +54.5%
- By 2100
- 2,706,979 · +65.3%
Race, ethnicity, and origin ACS 2023
- Neighborhood character
- Diverse neighborhood (Simpson 0.59)
- Race & ethnicity
- White 59% Hispanic / Latino 22% Two or more races 13% Black 10% Asian 4%
- Hispanic origin (detail)
- Mexican 2% Puerto Rican 4% Cuban 4% Dominican 2%
- Common ancestry
- Romanian 4% Scotch-Irish 3% Hispanic 3%
- Foreign-born
- 24% · Canada, Jamaica, Vietnam
- Languages at home
- 71% English-only · Spanish 17% French/Haitian/Cajun 5% Other Indo-European 3%
Political lean MEDSL · Palm Beach
- 2024 margin
- Toss-up / Even · D 50.0% · R 49.2%
- 2008→2024 swing
- -22.1pp toward R · 2008: 22.9pp · 2024: 0.8pp
- All cycles
- 2024: D+0.8 2020: D+12.8 2016: D+15.3 2012: D+17.0 2008: D+22.9
Not yet ingested
- Civics
- —
Market trends
- HPI YoY
- ▼ -288.94%
- Current HPI
- 343.7738
- Rent YoY
- ▼ -0.40%
- Metro
- Miami-Fort Lauderdale-Pompano Beach, FL
- State GDP YoY
- ▲ 3.28%
- F500 in state
- 36
Industry mix (Fortune 500 HQ in FL)
| Industry | F500 HQs | Revenue |
|---|---|---|
| Industrial Technology | 2 | $29B |
|
||
| Insurance | 2 | $17B |
|
||
| Retail | 1 | $60B |
|
||
| Technology Distribution | 1 | $58B |
|
||
| Homebuilding | 1 | $35B |
|
||
| Technology Manufacturing | 1 | $35B |
|
||
Price history
-47.2% since first listed3 events — show timeline
- 2026-06-04 Listed $399,000 Beaches MLS
- 1997-02-07 Sold (Public Records) $141,928 Public Records
- 1995-07-25 Sold (Public Records) $756,100 Public Records
Property tax history
+1.1%/yrLatest (2025): $5,390 · +3.1% YoY. Source: county tax records.
Cash-flow waterfall
monthlySold comps — $/sqft
last 12 mo · ≤1 miLoading sold comps…