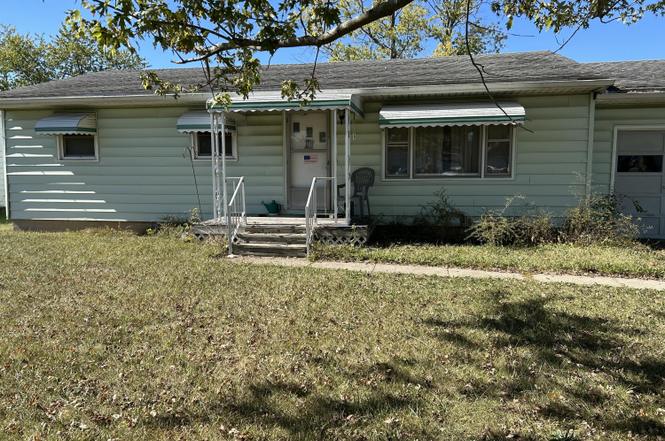
2225 N Cable Rd · Lima, OH
Flood risk 1/10 · Minimal
- FEMA flood zone
- X (unshaded)
- Chance of flooding over 30 yrs
- 0.0%
- Est. flood insurance / yr
- $473 – $860
Fire risk 1/10 · Minimal
- Est. fire insurance / yr
- $713 – $1,323
Heat risk 4/10 · Minor
- Hot days now (above 100°F)
- 7 days/yr
- Hot days in 30 yrs
- 18 days/yr
Wind risk 2/10 · Minimal
- Chance of severe wind over 30 yrs
- —
Air-quality risk 2/10 · Minimal
- Unhealthy air days now
- 1 days/yr
- Unhealthy air days in 30 yrs
- 2 days/yr
Risk factors via First Street. Map © Google.
Why this score? — see what drove the B+ grade
The composite is a weighted blend of 9 inputs, each scored 0–100. Each bar is that input's sub-score; the figure is the points it added to the 100-point composite (weight × sub-score).
- Cash flow +25.4/30.0
- ARV discount +15.0/15.0
- Appreciation +10.0/10.0
- DSCR +8.4/10.0
- 1% rule +6.4/10.0
- Schools +5.0/10.0
- Livability +3.2/5.0
- Rent growth +2.5/5.0
- Condition / age +2.5/5.0
$140,000
🖨 Deal sheet 📄 Offer letter ✓ Due diligence
Listing remarks
MOTIVATED SELLERS in Elida School District! Located close to shopping and restaurants, this 3-bedroom, 1-bath home has great potential and plenty of space to make it your own. The full basement is sectioned off, offering room for storage, a workshop, or additional living space. With a little elbow grease, this could be a wonderful family home or investment property. Being sold as is, this home is ready for your personal touch!
Key facts
- 0.28 acre lot
- Garage
- Built 1960
Neighborhood map
What this means for you Summary
Snapshot
- This is a 3-bed/1.0-bath single-family listed at $140k.
Deal economics
- At list price, monthly cash flow is $323 ($4k/yr) — positive.
- The deal already cash-flows at list — no discount required.
- Meets the 1% rule at list price ($2k rent vs $140k).
- Recommended offer: $136k (3.0% below list) — sets the bar for market timing.
Location & tenants
- Location reads 64/100 on livability (#787 in OH) — a middle-class / working-renter tenant base. Strengths: cost of living A+, housing A+, health & safety A-; Watch: crime F, amenities F, commute F.
- Elida Local (rural): math 59% / reading 59% proficiency, ranked #311 of 656 in OH (top 47%) — acceptable for families but not a draw, mixed tenant base, ~2y average lease.
- Market conditions: 53 active listings in the ZIP; 88 units permitted in Allen County in 2024 (0 in 5+ unit buildings).
Forward outlook
- In year one you build about $15k of equity ($968 loan paydown + $14k appreciation (10.0% local appreciation)).
- Allen County population projected at -14% by 2050 — secular population decline; favor cash flow + early exit over multi-decade hold.
- At projected returns (10.0% appreciation + 3.0% rent growth), your $39k cash investment doubles in ~2 years — after that, you're playing with house money.
- By year 3, paydown + projected appreciation supports a ~$38k cash-out refi (75% LTV) — recoverable capital for the next deal without selling this one.
Negotiation context
- It's been on market 60 days — a 3% lower offer ($136k) is reasonable based on typical stale-listing flexibility.
Questions for the listing agent
- It's been on market 60 days. Have you received any prior offers? Is the seller open to a 3% concession, seller financing, or rate buy-down credit?
- Built in 1960 — when were the roof, HVAC, electrical panel, plumbing, and water heater last replaced?
- Is there a deadline driving the sale (1031 exchange, divorce, estate, relocation)? That informs how much negotiation room exists.
- Crime grade is F in this area — have there been break-ins, vandalism, or insurance claims at this property in the last 3 years? What carrier currently insures it and at what premium?
- What's the average days-on-market for RENTAL listings here right now (not sales)? A rising rental-DOM trend means longer vacancies and softer asking-rent achievability than the comps imply.
- What's the recent tenant-quality profile in this submarket — average credit score on applications, eviction rate, late-payment / NSF rate, and stable-employment percentage? A property-management company in the area should have these aggregated.
- How much new for-sale + rental construction is in the pipeline within 1–3 miles? Heavy new supply typically softens prices + rents 12–24 months out; constrained supply supports both.
Investment metrics
- 1% rule
- 1.14% ✓
- Cap rate
- 9.06%
- Cash-on-cash
- 9.89%
- DSCR
- 1.44
- GRM
- 7.3
CMA / ARV
- ARV (on-the-fly)
- $169,520
- Comps found
- 2
Show comp detail 2 sales within ~0.75 mi
| Address | Dist | Beds/Ba | Sqft | Sold | Price | $/sf | Match |
|---|---|---|---|---|---|---|---|
| 2251 N Cable Rd | 0.07mi | 3/2.0 | 952 (-8%) | 17mo | $155,000 | $163 | 65 |
| 1790 Homeward Ave | 0.52mi | 2/1.0 (-1) | 1,160 (+12%) | 2mo | $63,000 | $54 | 50 |
Match score weights: distance 35% · size 25% · config 20% · recency 20%. Top-matched comps best support the ARV.
Projected returns pro-forma
10.0% appreciation · 3.0% rent growth · sell at horizon
- IRR
- 31.5%
- Equity multiple
- 3.47×
- Total profit
- $96,837
- Equity at exit
- $126,123
- IRR
- 27.2%
- Equity multiple
- 7.86×
- Total profit
- $268,987
- Equity at exit
- $271,989
Cash invested: $39,200 (down + closing). Projections, not guarantees.
Landlord ↔ Tenant lean methodology
- Overall (STATE)
- 73 Landlord-Friendly
- State Ohio
- 73 Landlord-Friendly · R+6
- County
- — inherits STATE
- City
- — inherits STATE
ZIP-level market 45807
- Home prices YoY
- 8.5%
- Active inventory
- 53
- Price-to-rent
- 7.3×
Monthly cashflow live
- Estimated rent
- $1,591 medium interval (Pro) →
- Mortgage (P&I)
- −$734
- Tax from tax record
- −$141 /mo · $1,692/yr
- Insurance
- −$58
- HOA
- −$0
- Vacancy / Maint / Mgmt
- −$334
- Net cashflow
- $323
Break-even live
UW: 25.0% down · 7.5% · 30yr · 1.5% tax · 5.0% vac · 8.0% maint · 8.0% mgmt
Financing live
Cash to close
- Down payment
- $35,000
- Closing costs
- $4,200
- Reserves months
- —
- Total cash needed
- —
Loan-product check · same deal, 3 products live
Conventional
25% down · 7.5% · 30yr
- Down + closing
- —
- Monthly P&I
- —
- Monthly cashflow
- —
- DSCR
- —
- Eligible?
- —
Personal DTI + credit; lowest rate.
DSCR
20% down · 8.5% · 30yr
- Down + closing
- —
- Monthly P&I
- —
- Monthly cashflow
- —
- DSCR
- —
- Eligible?
- —
No personal income docs; deal must DSCR.
Hard money
10% down · 12.0% · 12mo
- Down + closing
- —
- Monthly P&I
- —
- Monthly cashflow
- —
- DSCR
- —
- Eligible?
- —
Short-term bridge; refi at stabilization.
Listing history 4 events
-
2025-12-13status Pending
-
2025-12-08price $140,000
-
2025-10-31price $150,000
-
2025-10-13$170,000 Active
ⓘ Source: listings_history table (triggers on properties + properties_extension) + one-shot
backfill from property_details.listing_events for pre-trigger history.
Tax reassessment forecast OH · Partial reset (capped growth)
- Current annual tax
- $1,692 · $141/mo
- Projected year-2 tax
- $1,938 · $162/mo
- Expected delta
- +$246/yr (+$20/mo · 14.5%)
ⓘ Screening estimate from a state-policy table — verify with the county assessor before closing.
Climate risk First Street
- Flood 1/10 Low FEMA zone X (unshaded) · 0% chance over 30 yrs
- Wildfire 1/10 Low
- Heat 4/10 Moderate 7 d/yr ≥100°F today · 18 d/yr by 30 yrs out
- Wind 2/10 Low
- Air quality 2/10 Low 1 unhealthy d/yr today · 2 by 30 yrs out
Nearby sold comps map
Loading sold comps map…
Walkable amenities ~0.75 mi
Loading nearby amenities…
Taxation est. · year 1
- Rental income
- $19,090
- − Mortgage interest
- −$7,842
- − Property taxes
- −$1,692
- − Insurance
- −$700
- − Repairs & maintenance
- −$1,527
- − Management
- −$1,527
- − Depreciation
- −$4,073
- Taxable income
- $1,728
- Est. tax owed @ 24.0%
- −$415
- After-tax cash flow
- $3,464/yr
For passive investors: Depreciation is non-cash, so a rental often shows a tax loss while cash-flowing — sheltering income. Rental losses are passive: they offset passive income freely, and up to $25,000/yr can offset ordinary (W-2) income if you actively participate and your MAGI is under $100k (phasing out to $0 by $150k); unused losses carry forward. On sale, claimed depreciation is recaptured at up to 25%, and gains may owe capital-gains tax (a 1031 exchange can defer both). Figures are a year-1 estimate at your 24.0% rate — not tax advice; consult a CPA.
Schools (NCES district)
- District
- Elida Local
- NCES district ID
- 3904577
- Math proficiency
- 59% ▼ -11.00%
- Reading proficiency
- 59% ▼ -7.00%
- Median HH income
- $46,632
- Composite
- 49.93/100
- National rank
- #1934
- State rank
- #311 of 656 in OH
Livability — Lima
- Score
- 64/100
- State rank
- #787
- US rank
- #14288
Category grades
Schools grade is shown separately in the Schools card above.
Census & demographics
- County
- Allen · 98,169 people
- City population
- 21,739
- Metro
- Lima, OH
- Population (ZIP)
- 11,631
- Household income
- $74,387
- Rent vs Own
- Severe rent burden
- 6.3
Population outlook (Allen County) Hauer SSP2
- Today (2025)
- 100,321 people
- By 2030
- 97,693 · -2.6%
- By 2040
- 91,802 · -8.5%
- By 2050
- 86,152 · -14.1%
- By 2075
- 73,659 · -26.6%
- By 2100
- 58,716 · -41.5%
Race, ethnicity, and origin ACS 2023
- Neighborhood character
- Predominantly White (90%)
- Race & ethnicity
- White 90% Black 5% Two or more races 4% Hispanic / Latino 2%
- Common ancestry
- Lithuanian 2% Iranian 1% Romanian 1%
- Foreign-born
- 2% · Canada, South Korea
- Languages at home
- 98% English-only · Spanish 1%
Political lean MEDSL · Allen
- 2024 margin
- Solid R (+44.1) · D 27.5% · R 71.6%
- 2008→2024 swing
- -23.4pp toward R · 2008: -20.7pp · 2024: -44.1pp
- All cycles
- 2024: R+44.1 2020: R+39.5 2016: R+38.2 2012: R+25.7 2008: R+20.7
Not yet ingested
- Civics
- —
Market trends
- HPI YoY
- ▲ 36.64%
- Current HPI
- 468.59
- Rent YoY
- —
- Metro
- —
- State GDP YoY
- ▲ 1.98%
- F500 in state
- 48
Industry mix (Fortune 500 HQ in OH)
| Industry | F500 HQs | Revenue |
|---|---|---|
| Insurance | 3 | $145B |
|
||
| Industrial Machinery | 3 | $49B |
|
||
| Financial Services | 3 | $24B |
|
||
| Consumer Goods | 2 | $93B |
|
||
| Aerospace / Defense | 2 | $47B |
|
||
| Utilities | 2 | $33B |
|
||
Price history
-17.6% since first listed4 events — show timeline
- 2025-12-13 Pending — WCARE
- 2025-12-08 Price Changed $140,000 WCARE
- 2025-10-31 Price Changed $150,000 WCARE
- 2025-10-13 Listed $170,000 WCARE
Property tax history
+9.9%/yrLatest (2025): $1,692 · +33.0% YoY. Source: county tax records.
Cash-flow waterfall
monthlySold comps — $/sqft
last 12 mo · ≤1 miLoading sold comps…