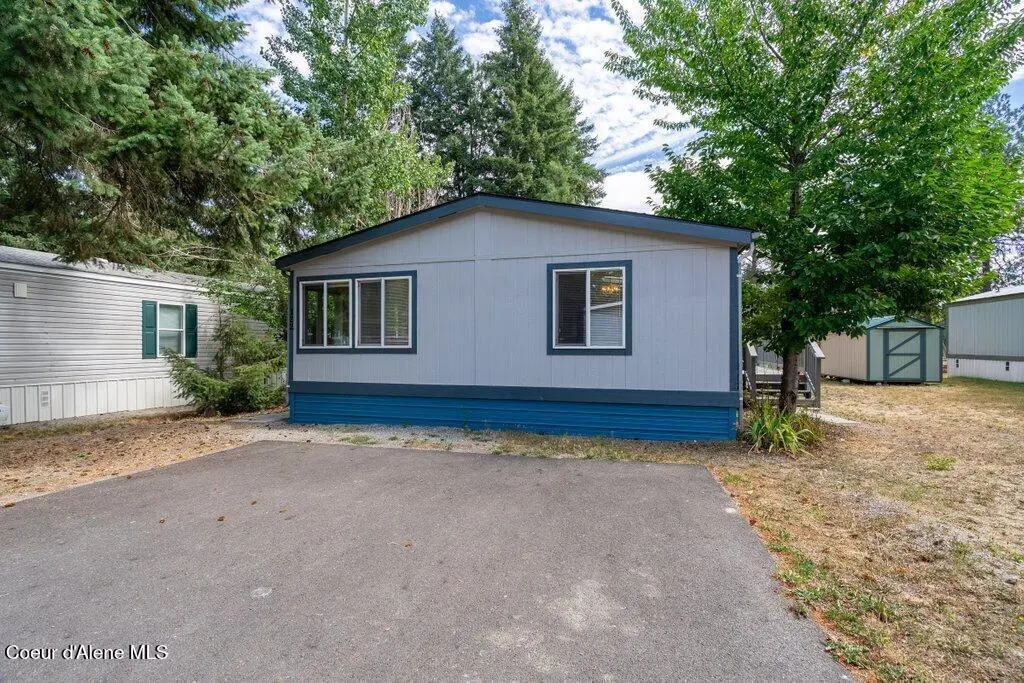
122 E Walrose Loop · Hayden, ID
Flood risk No data
- FEMA flood zone
- —
- Chance of flooding over 30 yrs
- —
- Est. flood insurance / yr
- —
Fire risk No data
- Est. fire insurance / yr
- —
Heat risk No data
- Hot days now (above threshold)
- —
- Hot days in 30 yrs
- —
Wind risk No data
- Chance of severe wind over 30 yrs
- —
Air-quality risk No data
- Unhealthy air days now
- —
- Unhealthy air days in 30 yrs
- —
Risk factors via First Street. Map © Google.
Why this score? — see what drove the B grade
The composite is a weighted blend of 9 inputs, each scored 0–100. Each bar is that input's sub-score; the figure is the points it added to the 100-point composite (weight × sub-score).
- Cash flow +30.0/30.0
- 1% rule +10.0/10.0
- DSCR +10.0/10.0
- ARV discount +7.5/15.0
- Schools +4.4/10.0
- Condition / age +3.8/5.0
- Livability +3.2/5.0
- Rent growth +2.8/5.0
- Appreciation +0.0/10.0
$125,000
🖨 Deal sheet 📄 Offer letter ✓ Due diligence
Listing remarks
6 months rent paid for! Located in a quiet Hayden community, this updated 3-bedroom, 2-bath home offers 1,512 square feet of comfortable, easy living. Step inside to a bright, open layout with refreshed finishes, abundant natural light, and plenty of space to gather or relax. Outside, you'll enjoy the peaceful neighborhood setting while being just minutes from North Idaho's best recreation. Spend your weekends on the water at Hayden Lake or Coeur d'Alene Lake, hit the fairways at Avondale Golf Course, or explore endless hiking and biking trails nearby. With easy access to shopping, dining, and Highway 95, this home blends small-town tranquility with everyday convenience. Low monthly lot le
Key facts
- Bright open layout
- Updated home
- Built 1992
Tags
Property features AI
Finance
- HOA & community: Monthly association fee; Association covers grounds maintenance, sewer, snow removal, trash, and water
Exterior
- Parking: Paved parking
- Utilities: Public water; Public sewer
- Home design: Manufactured home; No shared/common walls
- Construction: T1-11 siding; Composition roof; Pillar/post/pier foundation; Built as a manufactured structure
- Exterior features: Open deck; Exterior lighting; Rain gutters; Level lot; View
Interior
- Kitchen: Electric range; Dishwasher; Refrigerator; Gas water heater
- Bedrooms: 3 main-level bedrooms
- Flooring: Laminate; Luxury Vinyl Plank (LVP)
- Bathrooms: 2 main-level bathrooms
- Heating & cooling: Natural gas and electric heating; Forced air furnace
- Interior features: Cable internet available; Satellite service; Washer hookup; Crawl space (no full basement)
- Laundry & utility: Electric dryer hookup
Neighborhood map
What this means for you Summary
Snapshot
- This is a 3-bed/2.0-bath single-family listed at $125k. Condition is rated good.
Deal economics
- At list price, monthly cash flow is $1k ($12k/yr) — positive.
- The deal already cash-flows at list — no discount required.
- Meets the 1% rule at list price ($2k rent vs $125k).
- Recommended offer: $118k (6.0% below list) — sets the bar for market timing.
- Cap rate 16.1% vs local median 2.2% in Hayden — top-decile yield for the area; either an underpriced asset or a hidden risk that comps aren't pricing in. Stress-test before assuming the spread holds.
Location & tenants
- Location reads 64/100 on livability (#150 in ID) — a middle-class / working-renter tenant base. Strengths: crime A+, housing A+; Watch: schools D+, amenities F, commute F.
- Coeur D'Alene District (urban): math 44% / reading 60% proficiency, ranked #23 of 92 in ID (top 25%) — acceptable for families but not a draw, mixed tenant base, ~2y average lease.
- Market conditions: Rents rising (+1.2%/yr); 383 active listings in the ZIP; 4 comparable units currently listed for rent nearby; rentals at typical pace (median 21d on market — plan ~3-4 weeks tenant-placement turnaround); solid renter incomes; 1,606 units permitted in Kootenai County in 2024 (154 in 5+ unit buildings).
- This rent runs 31% of the median local income ($91k/yr) — at the standard rent-burdened threshold; future hikes will face affordability resistance.
Forward outlook
- Local home prices are declining (-3.0%/yr); year-one equity from $864 of loan paydown is wiped out by about $4k of value loss. Plan a longer hold.
- Kootenai County population projected at +33% by 2050 — long-run rental-demand tailwind backs the buy-and-hold thesis.
- At projected returns (-3.0% appreciation + 1.2% rent growth), your $35k cash investment doubles in ~4 years — after that, you're playing with house money.
Negotiation context
- It's been on market 77 days — a 6% lower offer ($118k) is reasonable based on typical stale-listing flexibility.
- 4 sale attempts with the ask held roughly flat each time — persistent listings suggest the price (not the market) is what's stuck; bring a comps-based counter.
Questions for the listing agent
- It's been on market 77 days. Have you received any prior offers? Is the seller open to a 6% concession, seller financing, or rate buy-down credit?
- Why hasn't it sold? Are there any deal-killer items the seller is aware of (foundation, flood, title, zoning, code violations)?
- Is there a deadline driving the sale (1031 exchange, divorce, estate, relocation)? That informs how much negotiation room exists.
- Schools are D-rated, which usually means shorter tenancies and higher turnover. Who's the typical renter profile here, and what's been the actual vacancy rate?
- What's the average days-on-market for RENTAL listings here right now (not sales)? A rising rental-DOM trend means longer vacancies and softer asking-rent achievability than the comps imply.
- What's the recent tenant-quality profile in this submarket — average credit score on applications, eviction rate, late-payment / NSF rate, and stable-employment percentage? A property-management company in the area should have these aggregated.
- How much new for-sale + rental construction is in the pipeline within 1–3 miles? Heavy new supply typically softens prices + rents 12–24 months out; constrained supply supports both.
Investment metrics
- 1% rule
- 1.91% ✓
- Cap rate
- 16.07%
- Cash-on-cash
- 34.90%
- DSCR
- 2.55
- GRM
- 4.4
CMA / ARV
- ARV (on-the-fly)
- $420,336
- Comps found
- 12
Show comp detail 12 sales within ~0.75 mi
| Address | Dist | Beds/Ba | Sqft | Sold | Price | $/sf | Match |
|---|---|---|---|---|---|---|---|
| 11810 N Peridot Dr | 0.27mi | 3/2.5 | 1,600 (+6%) | 11mo | $489,900 | $306 | 66 |
| 11501 N Alaska Loop | 0.52mi | 3/2.0 | 1,568 (+4%) | 10mo | $159,900 | $102 | 61 |
| 11474 N Alaska Loop | 0.50mi | 3/2.0 | 1,344 (-11%) | 3mo | $174,900 | $130 | 56 |
| 10788 N Oak St | 0.59mi | 3/2.0 | 1,644 (+9%) | 4mo | $449,000 | $273 | 54 |
| 696 W Peach Tree Dr | 0.66mi | 3/2.0 | 1,692 (+12%) | 1mo | $515,000 | $304 | 49 |
| 10603 N Hillview Dr | 0.74mi | 3/2.0 | 1,587 (+5%) | 12mo | $749,500 | $472 | 47 |
| 797 E Burdock Loop | 0.70mi | 3/2.0 | 1,669 (+10%) | 4mo | $525,000 | $315 | 47 |
| 659 W Wyoming Ave | 0.56mi | 3/2.0 | 1,680 (+11%) | 11mo | $55,000 | $33 | 46 |
| 87 E Burdock Loop | 0.64mi | 3/2.0 | 1,669 (+10%) | 8mo | $499,990 | $300 | 46 |
| 164 E Spirea Ln | 0.70mi | 3/2.0 | 1,661 (+10%) | 12mo | $384,950 | $232 | 41 |
| 90 E Spirea Ln | 0.70mi | 2/2.5 (-1) | 1,330 (-12%) | 8mo | $369,950 | $278 | 34 |
| 176 E Spirea Ln | 0.70mi | 2/2.5 (-1) | 1,330 (-12%) | 12mo | $359,950 | $271 | 30 |
Match score weights: distance 35% · size 25% · config 20% · recency 20%. Top-matched comps best support the ARV.
Projected returns pro-forma
-3.0% appreciation · 1.16% rent growth · sell at horizon
- IRR
- 28.3%
- Equity multiple
- 2.15×
- Total profit
- $40,284
- Equity at exit
- $18,638
- IRR
- 34.7%
- Equity multiple
- 3.90×
- Total profit
- $101,582
- Equity at exit
- $10,808
Cash invested: $35,000 (down + closing). Projections, not guarantees.
Landlord ↔ Tenant lean methodology
- Overall (STATE)
- 91 Strongly Landlord-Friendly
- State Idaho
- 91 Strongly Landlord-Friendly · R+18
- County
- — inherits STATE
- City
- — inherits STATE
ZIP-level market 83835
- Rents YoY
- 1.2%
- Active inventory
- 383
- Price-to-rent
- 4.4×
Monthly cashflow live
- Estimated rent
- $2,382 medium interval (Pro) →
- Mortgage (P&I)
- −$656
- Tax est. 1.5%
- −$156 /mo · $1,875/yr
- Insurance
- −$52
- HOA
- −$0
- Vacancy / Maint / Mgmt
- −$500
- Net cashflow
- $1,018
Break-even live
UW: 25.0% down · 7.5% · 30yr · 1.5% tax · 5.0% vac · 8.0% maint · 8.0% mgmt
Financing live
Cash to close
- Down payment
- $31,250
- Closing costs
- $3,750
- Reserves months
- —
- Total cash needed
- —
Loan-product check · same deal, 3 products live
Conventional
25% down · 7.5% · 30yr
- Down + closing
- —
- Monthly P&I
- —
- Monthly cashflow
- —
- DSCR
- —
- Eligible?
- —
Personal DTI + credit; lowest rate.
DSCR
20% down · 8.5% · 30yr
- Down + closing
- —
- Monthly P&I
- —
- Monthly cashflow
- —
- DSCR
- —
- Eligible?
- —
No personal income docs; deal must DSCR.
Hard money
10% down · 12.0% · 12mo
- Down + closing
- —
- Monthly P&I
- —
- Monthly cashflow
- —
- DSCR
- —
- Eligible?
- —
Short-term bridge; refi at stabilization.
Rent comps 4 comps
| Address | Beds | Baths | Sqft | Rent | $/sqft | DOM | Units | Dist |
|---|---|---|---|---|---|---|---|---|
| 228 E Lobo Loop Hayden, ID | 3.0 | 2.5 | 1401 | $2,250 | $1.61 | 13d | 1 | 0.33mi |
| 11091 N Cutlass St Hayden, ID | 3.0 | 2.0 | 1456 | $2,100 | $1.44 | 21d | 1 | 0.95mi |
| 649 W Helen Ave Hayden, ID | 3.0 | 2.0 | 1273 | $2,200 | $1.73 | 13d | 1 | 1.15mi |
| 9651 N Buttercup Ln Hayden, ID | 3.0 | 2.5 | 1285 | $1,950 | $1.52 | 21d | 1 | 1.21mi |
Listing history 33 events
-
2026-06-19days on market $125,000 Active 77 DOM
-
2026-06-18days on market $125,000 Active 76 DOM
-
2026-06-17days on market $125,000 Active 75 DOM
-
2026-06-16days on market $125,000 Active 74 DOM
-
2026-06-15days on market $125,000 Active 73 DOM
-
2026-06-14days on market $125,000 Active 71 DOM
-
2026-06-13days on market $125,000 Active 70 DOM
-
2026-06-10days on market $125,000 Active 68 DOM
-
2026-06-09days on market $125,000 Active 67 DOM
-
2026-06-08days on market $125,000 Active 66 DOM
-
2026-06-07days on market $125,000 Active 65 DOM
-
2026-06-03days on market $125,000 Active 61 DOM
-
2026-06-02days on market $125,000 Active 60 DOM
-
2026-06-01days on market $125,000 Active 59 DOM
-
2026-06-01remarks 699-char remark
-
2026-05-31days on market $125,000 Active 58 DOM
-
2026-05-30days on market $125,000 Active 57 DOM
-
2026-05-01price $125,000
-
2026-04-03$130,000 Active
-
2026-03-25status Pending
-
2026-03-19price $130,000
-
2026-01-31price $140,000
-
2026-01-31price $140,000
-
2026-01-08$150,000 Active
-
2025-12-09price $160,000
-
2025-12-09price $160,000
-
2025-12-02price $170,000
-
2025-12-02price $170,000
-
2025-11-12price $175,000
-
2025-11-12status Active
-
2025-11-12price $175,000
-
2025-09-11status Pending
-
2025-08-21$185,000 Active
ⓘ Source: listings_history table (triggers on properties + properties_extension) + one-shot
backfill from property_details.listing_events for pre-trigger history.
Nearby sold comps map
Loading sold comps map…
Walkable amenities ~0.75 mi
Loading nearby amenities…
Taxation est. · year 1
- Rental income
- $28,584
- − Mortgage interest
- −$7,002
- − Property taxes
- −$1,875
- − Insurance
- −$625
- − Repairs & maintenance
- −$2,287
- − Management
- −$2,287
- − Depreciation
- −$3,636
- Taxable income
- $10,872
- Est. tax owed @ 24.0%
- −$2,609
- After-tax cash flow
- $9,606/yr
For passive investors: Depreciation is non-cash, so a rental often shows a tax loss while cash-flowing — sheltering income. Rental losses are passive: they offset passive income freely, and up to $25,000/yr can offset ordinary (W-2) income if you actively participate and your MAGI is under $100k (phasing out to $0 by $150k); unused losses carry forward. On sale, claimed depreciation is recaptured at up to 25%, and gains may owe capital-gains tax (a 1031 exchange can defer both). Figures are a year-1 estimate at your 24.0% rate — not tax advice; consult a CPA.
Condition & rehab AI · 13 photos
This updated 3-bedroom, 2-bath home offers a good condition with fresh paint and updated finishes. It's located in a quiet neighborhood with easy access to recreation and amenities.
Value-add opportunities
- Resale update countertops and backsplash in kitchen — modernizes kitchen and adds value
- Both install smart home devices — enhances convenience and appeal
- Both landscape front yard — improves curb appeal and adds value
Renovation cost estimate screening
Value-add ROI direction
- Resale update countertops and backsplash in kitchen — modernizes kitchen and adds value ↑
- Both install smart home devices — enhances convenience and appeal ↑
- Both landscape front yard — improves curb appeal and adds value ↑
ⓘ Cost ranges are severity-bucket heuristics (US national rule-of-thumb). Get contractor quotes + a written scope before underwriting a rehab budget.
Schools (NCES district)
- District
- Coeur D'Alene District
- NCES district ID
- 1600780
- Math proficiency
- 44% ▼ -6.00%
- Reading proficiency
- 60% ▼ -2.00%
- Median HH income
- $47,652
- Composite
- 44.16/100
- National rank
- #2858
- State rank
- #23 of 92 in ID
Livability — Hayden
- Score
- 64/100
- State rank
- #150
- US rank
- #14103
Category grades
Schools grade is shown separately in the Schools card above.
Census & demographics
- Census place
- Hayden, ID
- County
- Kootenai County · 146,553 people
- City population
- 24,238
- Metro
- Coeur d'Alene, ID
- Population (ZIP)
- 24,238
- Household income
- $91,316
- Rent vs Own
- Severe rent burden
- 345.0
Population outlook (Kootenai County) Hauer SSP2
- Today (2025)
- 177,692 people
- By 2030
- 190,689 · +7.3%
- By 2040
- 214,704 · +20.8%
- By 2050
- 236,510 · +33.1%
- By 2075
- 285,984 · +60.9%
- By 2100
- 316,459 · +78.1%
Race, ethnicity, and origin ACS 2023
- Neighborhood character
- Predominantly White (91%)
- Race & ethnicity
- White 91% Two or more races 6% Hispanic / Latino 4%
- Common ancestry
- Portuguese 6% Italian 3% Slovak 3%
- Foreign-born
- 3% · Canada
- Languages at home
- 98% English-only · Spanish 1%
Political lean MEDSL · Kootenai
- 2024 margin
- Solid R (+51.9) · D 22.9% · R 74.8% · Other 2.2%
- 2008→2024 swing
- -25.6pp toward R · 2008: -26.3pp · 2024: -51.9pp
- All cycles
- 2024: R+51.9 2020: R+42.9 2016: R+42.5 2012: R+34.3 2008: R+26.3
Not yet ingested
- Civics
- —
Market trends
- HPI YoY
- ▼ -271.03%
- Current HPI
- 256.927
- Rent YoY
- ▲ 1.16%
- Metro
- Coeur d'Alene, ID
- State GDP YoY
- ▲ 4.51%
- F500 in state
- 6
Industry mix (Fortune 500 HQ in ID)
| Industry | F500 HQs | Revenue |
|---|---|---|
| Retail | 1 | $79B |
|
||
| Technology | 1 | $25B |
|
||
| Food / Agriculture | 1 | $6B |
|
||
Price history
-32.4% since first listed16 events — show timeline
- 2026-05-01 Price Changed $125,000 CDAMLS
- 2026-04-03 Listed $130,000 CDAMLS
- 2026-03-25 Pending — CDAMLS
- 2026-03-19 Price Changed $130,000 CDAMLS
- 2026-01-31 Price Changed $140,000 SELMLS
- 2026-01-31 Price Changed $140,000 CDAMLS
- 2026-01-08 Listed $150,000 CDAMLS
- 2025-12-09 Price Changed $160,000 SELMLS
- 2025-12-09 Price Changed $160,000 CDAMLS
- 2025-12-02 Price Changed $170,000 SELMLS
- 2025-12-02 Price Changed $170,000 CDAMLS
- 2025-11-12 Price Changed $175,000 SELMLS
- 2025-11-12 Relisted — CDAMLS
- 2025-11-12 Price Changed $175,000 CDAMLS
- 2025-09-11 Pending — CDAMLS
- 2025-08-21 Listed $185,000 CDAMLS
Cash-flow waterfall
monthlySold comps — $/sqft
last 12 mo · ≤1 miLoading sold comps…