 Duplex
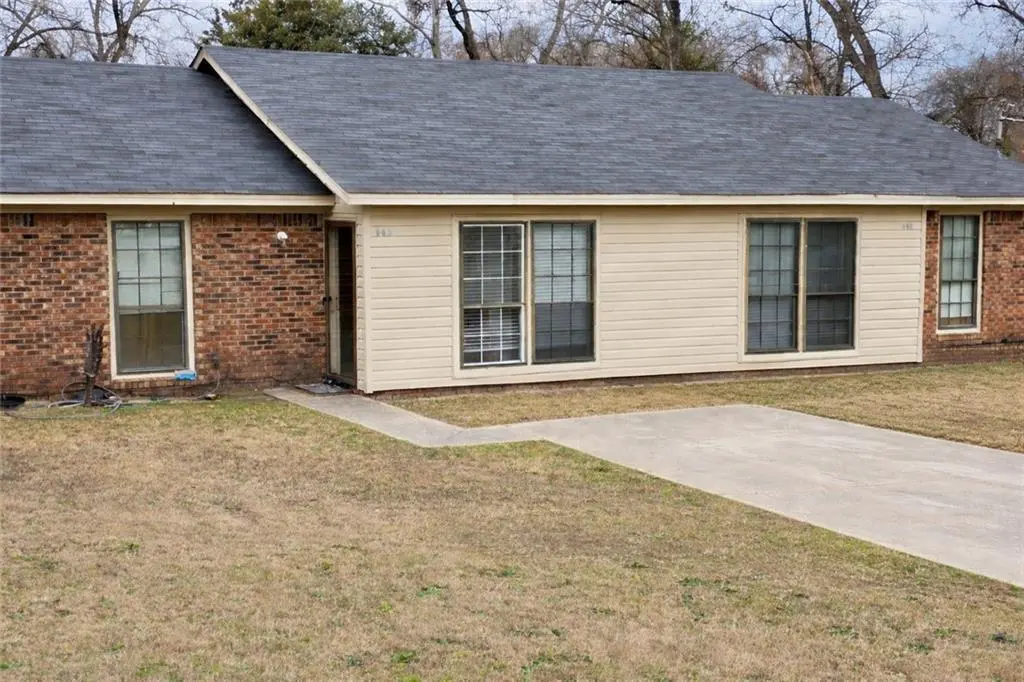
803 21st St · Phenix City, AL
Flood risk 1/10 · Minimal
- FEMA flood zone
- X (unshaded)
- Chance of flooding over 30 yrs
- 0.0%
- Est. flood insurance / yr
- $507 – $1,088
Fire risk 1/10 · Minimal
- Est. fire insurance / yr
- $916 – $1,700
Heat risk 7/10 · Major
- Hot days now (above 107°F)
- 7 days/yr
- Hot days in 30 yrs
- 18 days/yr
Wind risk 6/10 · Moderate
- Chance of severe wind over 30 yrs
- 76.0%
Air-quality risk 5/10 · Moderate
- Unhealthy air days now
- 7 days/yr
- Unhealthy air days in 30 yrs
- 8 days/yr
Risk factors via First Street. Map © Google.
Why this score? — see what drove the B- grade
The composite is a weighted blend of 9 inputs, each scored 0–100. Each bar is that input's sub-score; the figure is the points it added to the 100-point composite (weight × sub-score).
- Cash flow +29.9/30.0
- DSCR +10.0/10.0
- 1% rule +8.4/10.0
- ARV discount +6.2/15.0
- Condition / age +4.0/5.0
- Rent growth +3.8/5.0
- Livability +3.0/5.0
- Schools +2.7/10.0
- Appreciation +0.0/10.0
$180,000
🖨 Deal sheet 📄 Offer letter ✓ Due diligence
Multi-family units
County records classify this as Multi-Family (2-4 Unit). Listing-text estimate: 2 units. confirmed
Listing remarks
Investor Opportunity – Duplex with Stable Income & Portfolio Expansion Potential | $180,000 Well-maintained duplex offering immediate cash flow with long-term stability. This property is ideal for investors looking for a steady rental asset with minimal upfront improvements needed. Unit 803 is currently rented at $750/month with a lease in place through November 2026, providing consistent and predictable income. Unit 805 is also rented at $750/month with a lease in place through November 2026, creating strong, stable cash flow across both units. The property features a new roof installed in 2023, helping reduce near-term capital expenses and improving overall investment security
Key facts
- New roof
- 0.26 acre lot
- Listed 14 days
Tags
Property features AI
Exterior
- Utilities: Public water; Public sewer
- Home design: Duplex (residential income property)
- Construction: Brick construction
- Exterior features: Level lot
Interior
- Heating & cooling: Electric heating
- Interior features: Has heating
Neighborhood map
What this means for you Summary
Snapshot
- This is a 2 × 2-bed/1-bath units multifamily listed at $180k. Condition is rated good.
Deal economics
- At list price, monthly cash flow is $666 ($8k/yr) — positive. Per door: $333/mo.
- The deal already cash-flows at list — no discount required.
- Meets the 1% rule at list price ($2k rent vs $180k).
- Cap rate 10.7% vs local median 5.0% in Phenix City — top-decile yield for the area; either an underpriced asset or a hidden risk that comps aren't pricing in. Stress-test before assuming the spread holds.
Location & tenants
- Location reads 60/100 on livability (#297 in AL) — a middle-class / working-renter tenant base. Strengths: cost of living A+, housing A+; Watch: schools D+, crime F, amenities F.
- Phenix City (suburban): math 22% / reading 44% proficiency, ranked #59 of 129 in AL (top 46%) — families likely to look elsewhere, expect single-tenant / working-renter base with shorter leases; 64% free/reduced lunch — lower-income household profile, screen leases tightly.
- Market conditions: Rents rising fast (+5.3%/yr); 217 active listings in the ZIP; 2 comparable units currently listed for rent nearby; 183 units permitted in Russell County in 2024 (0 in 5+ unit buildings).
- At $2,418/mo this rent would consume 60% of the median local household income ($48k/yr) (locally 1399% of renters already pay >50% of income on rent) — very limited rent-growth headroom before tenants either downsize or default.
Forward outlook
- Local home prices are declining (-3.0%/yr); year-one equity from $1k of loan paydown is wiped out by about $5k of value loss. Plan a longer hold.
- Russell County population projected at +42% by 2050 — long-run rental-demand tailwind backs the buy-and-hold thesis.
- At projected returns (-3.0% appreciation + 5.3% rent growth), your $50k cash investment doubles in ~7 years — after that, you're playing with house money.
Negotiation context
- Only 14 days on market — expect competitive offers; lowballing is unlikely to land.
Risks & watch-outs
- Climate carrying-cost: major wind risk, 76% chance of damaging wind over 30y; extreme-heat days projected 7→18/yr by 2055 (HVAC capex compounding) — expect insurance premiums to compound above CPI over the hold.
Questions for the listing agent
- Can we see the unit-by-unit rent roll, current vacancy, and any below-market leases? What's the average tenancy length?
- What capital expenditures (roof, boiler, parking lot, exteriors) have been made in the last 5 years, and what's planned in the next 2?
- Is there a deadline driving the sale (1031 exchange, divorce, estate, relocation)? That informs how much negotiation room exists.
- Schools are D-rated, which usually means shorter tenancies and higher turnover. Who's the typical renter profile here, and what's been the actual vacancy rate?
- Crime grade is F in this area — have there been break-ins, vandalism, or insurance claims at this property in the last 3 years? What carrier currently insures it and at what premium?
- What's the average days-on-market for RENTAL listings here right now (not sales)? A rising rental-DOM trend means longer vacancies and softer asking-rent achievability than the comps imply.
- What's the recent tenant-quality profile in this submarket — average credit score on applications, eviction rate, late-payment / NSF rate, and stable-employment percentage? A property-management company in the area should have these aggregated.
- How much new apartment / multifamily construction is in the pipeline within 1–3 miles? Heavy new supply (>2% of stock underway) typically softens rents 12–24 months out; light construction supports rent growth.
Investment metrics
- 1% rule
- 1.34% ✓
- Cap rate
- 10.73%
- Cash-on-cash
- 15.86%
- DSCR
- 1.71
- GRM
- 6.2
CMA / ARV
- ARV (on-the-fly)
- $175,032
- Comps found
- 2
Show comp detail 2 sales within ~0.75 mi
| Address | Dist | Beds/Ba | Sqft | Sold | Price | $/sf | Match |
|---|---|---|---|---|---|---|---|
| 803 21st St | 0.00mi | —/— | 1,768 (0%) | 0mo | $175,000 | $99 | 100 |
| 801 21st St | 0.02mi | —/— | 1,908 (+8%) | 1mo | $177,000 | $93 | 85 |
Match score weights: distance 35% · size 25% · config 20% · recency 20%. Top-matched comps best support the ARV.
Projected returns pro-forma
-3.0% appreciation · 5.33% rent growth · sell at horizon
- IRR
- 9.4%
- Equity multiple
- 1.38×
- Total profit
- $19,105
- Equity at exit
- $26,839
- IRR
- 20.4%
- Equity multiple
- 2.91×
- Total profit
- $96,392
- Equity at exit
- $15,563
Cash invested: $50,400 (down + closing). Projections, not guarantees.
Landlord ↔ Tenant lean methodology
- Overall (STATE)
- 90 Strongly Landlord-Friendly
- State Alabama
- 90 Strongly Landlord-Friendly · R+15
- County
- — inherits STATE
- City
- — inherits STATE
ZIP-level market 36867
- Home prices YoY
- -30.1%
- Rents YoY
- 5.3%
- Active inventory
- 217
- Price-to-rent
- 12.4×
Monthly cashflow live
- Estimated rent
- $2,418 high interval (Pro) →
- Mortgage (P&I)
- −$944
- Tax est. 1.5%
- −$225 /mo · $2,700/yr
- Insurance
- −$75
- HOA
- −$0
- Vacancy / Maint / Mgmt
- −$508
- Net cashflow
- $666
Break-even live
2-unit breakdown (identical units grouped — click to expand)
| Units | Beds | Baths | Est. rent |
|---|---|---|---|
| 2× units | 2 | 1 | $2,418 |
| #1 | 2 | 1 | $1,209 |
| #2 | 2 | 1 | $1,209 |
| Total (2 units) | $2,418 | ||
UW: 25.0% down · 7.5% · 30yr · 1.5% tax · 5.0% vac · 8.0% maint · 8.0% mgmt
Financing live
Cash to close
- Down payment
- $45,000
- Closing costs
- $5,400
- Reserves months
- —
- Total cash needed
- —
Loan-product check · same deal, 3 products live
Conventional
25% down · 7.5% · 30yr
- Down + closing
- —
- Monthly P&I
- —
- Monthly cashflow
- —
- DSCR
- —
- Eligible?
- —
Personal DTI + credit; lowest rate.
DSCR
20% down · 8.5% · 30yr
- Down + closing
- —
- Monthly P&I
- —
- Monthly cashflow
- —
- DSCR
- —
- Eligible?
- —
No personal income docs; deal must DSCR.
Hard money
10% down · 12.0% · 12mo
- Down + closing
- —
- Monthly P&I
- —
- Monthly cashflow
- —
- DSCR
- —
- Eligible?
- —
Short-term bridge; refi at stabilization.
Rent comps 2 comps
| Address | Beds | Baths | Sqft | Rent | $/sqft | DOM | Units | Dist |
|---|---|---|---|---|---|---|---|---|
| 1346 Ingersoll Dr Phenix City, AL | 3.0 | 2.0 | 1453 | $1,700 | $1.17 | 13d | 1 | 1.17mi |
| 707 28th St Columbus, GA | 3.0 | 1.0 | 1384 | $1,000 | $0.72 | 13d | 1 | 1.31mi |
Listing history 2 events
-
2026-05-07status Pending
-
2026-04-10$180,000 Active
ⓘ Source: listings_history table (triggers on properties + properties_extension) + one-shot
backfill from property_details.listing_events for pre-trigger history.
Climate risk First Street
- Flood 1/10 Low FEMA zone X (unshaded) · 0% chance over 30 yrs
- Wildfire 1/10 Low
- Heat 7/10 Severe 7 d/yr ≥107°F today · 18 d/yr by 30 yrs out
- Wind 6/10 Major 76% chance of damaging wind over 30 yrs
- Air quality 5/10 Major 7 unhealthy d/yr today · 8 by 30 yrs out
Nearby sold comps map
Loading sold comps map…
Walkable amenities ~0.75 mi
Loading nearby amenities…
Taxation est. · year 1
- Rental income
- $29,016
- − Mortgage interest
- −$10,083
- − Property taxes
- −$2,700
- − Insurance
- −$900
- − Repairs & maintenance
- −$2,321
- − Management
- −$2,321
- − Depreciation
- −$5,236
- Taxable income
- $5,454
- Est. tax owed @ 24.0%
- −$1,309
- After-tax cash flow
- $6,686/yr
For passive investors: Depreciation is non-cash, so a rental often shows a tax loss while cash-flowing — sheltering income. Rental losses are passive: they offset passive income freely, and up to $25,000/yr can offset ordinary (W-2) income if you actively participate and your MAGI is under $100k (phasing out to $0 by $150k); unused losses carry forward. On sale, claimed depreciation is recaptured at up to 25%, and gains may owe capital-gains tax (a 1031 exchange can defer both). Figures are a year-1 estimate at your 24.0% rate — not tax advice; consult a CPA.
Condition & rehab AI · 2 photos
This well-maintained duplex with a new roof offers stable income and minimal upfront improvements needed. Landscaping and interior updates would further enhance its value.
Value-add opportunities
- Rental Landscaping — Improved curb appeal can attract more renters
- Both Interior updates — Fresh paint and minor updates can increase both resale and rental value
Renovation cost estimate screening
Value-add ROI direction
- Rental Landscaping — Improved curb appeal can attract more renters ↑
- Both Interior updates — Fresh paint and minor updates can increase both resale and rental value ↑
ⓘ Cost ranges are severity-bucket heuristics (US national rule-of-thumb). Get contractor quotes + a written scope before underwriting a rehab budget.
Schools (NCES district)
- District
- Phenix City
- NCES district ID
- 0102700
- Math proficiency
- 22% ▼ -24.00%
- Reading proficiency
- 44% ▼ -1.00%
- Median HH income
- $36,228
- Composite
- 27.29/100
- National rank
- #7001
- State rank
- #59 of 129 in AL
Livability — Phenix City
- Score
- 60/100
- State rank
- #297
- US rank
- #19037
Category grades
Schools grade is shown separately in the Schools card above.
Census & demographics
- Census place
- Phenix City, AL
- County
- Russell County · 53,055 people
- City population
- 62,290
- Metro
- Columbus, GA-AL
- Population (ZIP)
- 22,821
- Household income
- $48,026
- Rent vs Own
- Severe rent burden
- 1399.0
Population outlook (Russell County) Hauer SSP2
- Today (2025)
- 70,137 people
- By 2030
- 75,826 · +8.1%
- By 2040
- 87,858 · +25.3%
- By 2050
- 99,721 · +42.2%
- By 2075
- 128,009 · +82.5%
- By 2100
- 149,251 · +112.8%
Race, ethnicity, and origin ACS 2023
- Neighborhood character
- Diverse neighborhood (Simpson 0.60)
- Race & ethnicity
- White 53% Black 34% Hispanic / Latino 7% Two or more races 7% Asian 2%
- Hispanic origin (detail)
- Mexican 1% Puerto Rican 2% Cuban 2%
- Common ancestry
- Romanian 2% Italian 2% Slovak 1%
- Foreign-born
- 4% · Canada, China, South Korea
- Languages at home
- 94% English-only · Spanish 4% Tagalog/Filipino 1%
Political lean MEDSL · Russell
- 2024 margin
- Toss-up / Even · D 50.4% · R 48.7%
- 2008→2024 swing
- -5.6pp toward R · 2008: 7.3pp · 2024: 1.7pp
- All cycles
- 2024: D+1.7 2020: D+6.4 2016: D+1.9 2012: D+11.8 2008: D+7.3
Not yet ingested
- Civics
- —
Market trends
- HPI YoY
- ▼ -74.10%
- Current HPI
- 171.8426
- Rent YoY
- ▲ 5.33%
- Metro
- Columbus, GA-AL
- State GDP YoY
- ▲ 2.94%
- F500 in state
- 4
Industry mix (Fortune 500 HQ in AL)
| Industry | F500 HQs | Revenue |
|---|---|---|
| Financial Services | 1 | $8B |
|
||
| Healthcare | 1 | $5B |
|
||
Price history
2 events — show timeline
- 2026-05-07 Pending — CBOR
- 2026-04-10 Listed $180,000 CBOR
Cash-flow waterfall
monthlySold comps — $/sqft
last 12 mo · ≤1 miLoading sold comps…