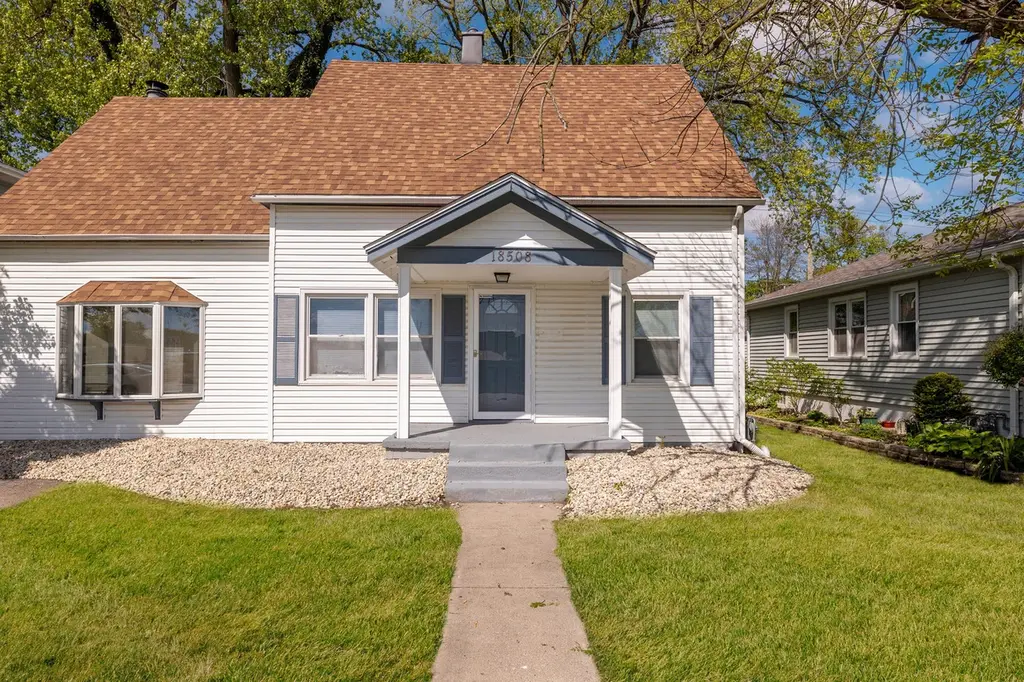
18508 Chicago Ave · Lansing, IL
Flood risk 1/10 · Minimal
- FEMA flood zone
- X (unshaded)
- Chance of flooding over 30 yrs
- 0.0%
- Est. flood insurance / yr
- $507 – $1,088
Fire risk 3/10 · Minor
- Est. fire insurance / yr
- $804 – $1,492
Heat risk 3/10 · Minor
- Hot days now (above 102°F)
- 7 days/yr
- Hot days in 30 yrs
- 15 days/yr
Wind risk 2/10 · Minimal
- Chance of severe wind over 30 yrs
- 0.0%
Air-quality risk 4/10 · Minor
- Unhealthy air days now
- 5 days/yr
- Unhealthy air days in 30 yrs
- 6 days/yr
Risk factors via First Street. Map © Google.
Why this score? — see what drove the F grade
The composite is a weighted blend of 9 inputs, each scored 0–100. Each bar is that input's sub-score; the figure is the points it added to the 100-point composite (weight × sub-score).
- Cash flow +7.6/30.0
- Livability +3.7/5.0
- 1% rule +3.2/10.0
- Rent growth +2.5/5.0
- Condition / age +2.5/5.0
- DSCR +1.7/10.0
- Schools +1.0/10.0
- ARV discount +0.0/15.0
- Appreciation +0.0/10.0
$259,000
🖨 Deal sheet (PDF) 📄 Offer letter ✓ Due diligence
Listing remarks MLS
Welcome to 18508 Chicago Ave. in Lansing, IL-a charming 4-bedroom, 2-bathroom Cape Cod with plenty of space and potential! The main floor offers a cozy living room, a spacious family room perfect for entertaining, an eat-in kitchen, and a main floor bedroom for added convenience. Upstairs, you'll find three additional bedrooms, including a primary en suite for extra comfort and privacy. This home provides a great opportunity to make it your own with some updates and personal touches. Home is being sold AS IS. Don't miss out-schedule your showing today!
Key facts
- Master suite
- Fenced yard
- New appliances
Tags
Property features AI
Finance
- Other: Lot dimensions approximately 60 x 127 (less than 0.25 acre); Located in the corporate limits of Lansing, Township of Thornton
- HOA & community: No master association required
Exterior
- Parking: Two parking spaces; Concrete parking, off-alley access
- Utilities: Lake Michigan water source; Public sewer; 100 amp electric service
- Home design: Detached single-family home; 1.5-story design; Fee simple ownership; Property is over 100 years old; Built before 1978
- Construction: Aluminum and vinyl siding; Asphalt roof; Estimated living area
- Exterior features: Deck; Curbs and sidewalks
Interior
- Kitchen: Kitchen with eating area / table space
- Bedrooms: 5 bedrooms (including a main-level bedroom and a second-floor primary bedroom); Bedroom dimensions include 17x12, 12x9, 10x11, 9x9, and 17x9
- Flooring: Carpet in most living spaces and bedrooms; Vinyl flooring in the kitchen
- Bathrooms: 2 full bathrooms
- Heating & cooling: Natural gas heating; Central air conditioning
- Interior features: Finished attic; Separate dining room; Unfinished/partial basement; 1st floor bedroom; Ceiling fan(s); One fireplace located in the master bedroom; Nine total rooms
- Laundry & utility: Laundry room
Neighborhood map
What this means for you Summary
Snapshot
- This is a 3-bed/1.5-bath single-family listed at $259k.
Deal economics
- At list price, monthly cash flow is $-312 ($-4k/yr) — negative.
- To cash-flow at today's rent, offer at most $204k (21.3% below list).
- To meet the 1% rule (rent ≥ 1% of price), the offer needs to be $212k (18.0% below list).
- Recommended offer: $204k (21.3% below list) — sets the bar for cash-flow.
Location & tenants
- Location reads 73/100 on livability (#296 in IL) — a middle-class / working-renter tenant base. Strengths: commute A+, cost of living A+, housing A+; Watch: schools D+, crime D+, health & safety D+.
- Thornton Fractional Twp Hsd 215 (suburban): math 9% / reading 13% proficiency, ranked #563 of 620 in IL (top 91%) — low school quality limits family demand, transient renter base, plan for 1-2y turnover.
- Market conditions: 136 active listings in the ZIP; 15 comparable units currently listed for rent nearby; rentals leasing fast (median 4d on market — plan ~1-2 weeks tenant-placement turnaround); solid renter incomes; 6,272 units permitted in Cook County in 2024 (4,658 in 5+ unit buildings).
- This rent runs 34% of the median local income ($76k/yr) — at the standard rent-burdened threshold; future hikes will face affordability resistance.
Forward outlook
- Local home prices are declining (-3.0%/yr); year-one equity from $2k of loan paydown is wiped out by about $8k of value loss. Plan a longer hold.
Negotiation context
- It's been on market 40 days — a 3% lower offer ($251k) is reasonable based on typical stale-listing flexibility.
- 6 sale attempts since 17y ago with the ask held roughly flat each time — persistent listings suggest the price (not the market) is what's stuck; bring a comps-based counter.
- Current owner paid $159k; list at $259k implies a 63% gain — meaningful room to come down on a strong offer.
Risks & watch-outs
- Watch-outs: built in 1915 — expect roof / HVAC / electrical / plumbing capex.
Questions for the listing agent
- What do current leases actually rent for vs. the listed asking? Can we see a recent rent roll and the last 12 months of T-12 income?
- It's been on market 40 days. Have you received any prior offers? Is the seller open to a 21% concession, seller financing, or rate buy-down credit?
- Built in 1915 — when were the roof, HVAC, electrical panel, plumbing, and water heater last replaced?
- Is there a deadline driving the sale (1031 exchange, divorce, estate, relocation)? That informs how much negotiation room exists.
- Schools are D-rated, which usually means shorter tenancies and higher turnover. Who's the typical renter profile here, and what's been the actual vacancy rate?
- Crime grade is D in this area — have there been break-ins, vandalism, or insurance claims at this property in the last 3 years? What carrier currently insures it and at what premium?
- The area grade is low — what's the realistic commute time and amenity access for the typical tenant pool here? Any planned neighborhood developments (good or bad) we should know about?
- What's the average days-on-market for RENTAL listings here right now (not sales)? A rising rental-DOM trend means longer vacancies and softer asking-rent achievability than the comps imply.
- What's the recent tenant-quality profile in this submarket — average credit score on applications, eviction rate, late-payment / NSF rate, and stable-employment percentage? A property-management company in the area should have these aggregated.
- How much new for-sale + rental construction is in the pipeline within 1–3 miles? Heavy new supply typically softens prices + rents 12–24 months out; constrained supply supports both.
Investment metrics
- 1% rule
- 0.82% ✗
- Cap rate
- 4.85%
- Cash-on-cash
- -5.17%
- DSCR
- 0.77
- GRM
- 10.2
CMA / ARV
- ARV (on-the-fly)
- $209,880
- Comps found
- 12
Show comp detail 12 sales within ~0.75 mi
| Address | Dist | Beds/Ba | Sqft | Sold | Price | $/sf | Match |
|---|---|---|---|---|---|---|---|
| 18240 Wildwood Ave | 0.36mi | 3/2.0 | 1,400 (+6%) | 6mo | $264,000 | $189 | 66 |
| 3316 Ann St | 0.46mi | 3/2.5 | 1,264 (-4%) | 3mo | $260,000 | $206 | 65 |
| 2621 Ridge Rd | 0.58mi | 4/2.0 (+1) | 1,323 (+0%) | 2mo | $216,000 | $163 | 64 |
| 18302 Roy St | 0.44mi | 4/1.5 (+1) | 1,254 (-5%) | 6mo | $200,000 | $159 | 61 |
| 18032 Wildwood Ave | 0.61mi | 3/1.5 | 1,224 (-7%) | 1mo | $170,000 | $139 | 59 |
| 3007 190th St | 0.60mi | 3/1.0 | 1,232 (-7%) | 2mo | $199,900 | $162 | 57 |
| 17913 Oakwood Ave | 0.75mi | 3/1.0 | 1,257 (-5%) | 2mo | $182,000 | $145 | 54 |
| 18518 Glen Oak Ave | 0.69mi | 4/2.0 (+1) | 1,338 (+1%) | 6mo | $257,000 | $192 | 54 |
| 18013 Park Ave | 0.62mi | 3/2.0 | 1,200 (-9%) | 3mo | $180,000 | $150 | 51 |
| 2643 Ridge Rd | 0.55mi | 3/2.0 | 1,502 (+14%) | 2mo | $234,000 | $156 | 48 |
| 3048 189th St | 0.52mi | 3/1.0 | 1,500 (+14%) | 6mo | $230,000 | $153 | 46 |
| 2444 187th St | 0.66mi | 3/2.0 | 1,514 (+15%) | 4mo | $205,000 | $135 | 39 |
Match score weights: distance 35% · size 25% · config 20% · recency 20%. Top-matched comps best support the ARV.
Projected returns pro-forma
-3.0% appreciation · 3.0% rent growth · sell at horizon
- IRR
- -25.0%
- Equity multiple
- 0.15×
- Total profit
- $-61,697
- Equity at exit
- $38,618
- IRR
- -20.7%
- Equity multiple
- -0.09×
- Total profit
- $-78,698
- Equity at exit
- $22,394
Cash invested: $72,520 (down + closing). Projections, not guarantees.
Landlord ↔ Tenant lean methodology
- Overall (STATE)
- 43 Moderately Tenant-Leaning
- State Illinois
- 43 Moderately Tenant-Leaning · D+7
- County
- — inherits STATE
- City
- — inherits STATE
ZIP-level market 60438
- Active inventory
- 136
- Price-to-rent
- 10.2×
Monthly cashflow live
- Estimated rent
- $2,124 high interval (Pro) →
- Mortgage (P&I)
- −$1,358
- Tax from tax record
- −$524 /mo · $6,290/yr
- Insurance
- −$108
- HOA
- −$0
- Vacancy / Maint / Mgmt
- −$446
- Net cashflow
- $-312
Break-even live
Sensitivity live
| Price | -10% $-166 | -5% $-239 | +0% $-312 | +5% $-385 | +10% $-459 |
|---|---|---|---|---|---|
| Rent | -10% $-480 | -5% $-396 | +0% $-312 | +5% $-228 | +10% $-144 |
| Rate | -1.0pp $-182 | -0.5pp $-246 | base $-312 | +0.5pp $-379 | +1.0pp $-448 |
UW: 25.0% down · 7.5% · 30yr · 1.5% tax · 5.0% vac · 8.0% maint · 8.0% mgmt
Financing live
Cash to close
- Down payment
- $64,750
- Closing costs
- $7,770
- Reserves months
- —
- Total cash needed
- —
Loan-product check · same deal, 3 products live
Conventional
25% down · 7.5% · 30yr
- Down + closing
- —
- Monthly P&I
- —
- Monthly cashflow
- —
- DSCR
- —
- Eligible?
- —
Personal DTI + credit; lowest rate.
DSCR
20% down · 8.5% · 30yr
- Down + closing
- —
- Monthly P&I
- —
- Monthly cashflow
- —
- DSCR
- —
- Eligible?
- —
No personal income docs; deal must DSCR.
Hard money
10% down · 12.0% · 12mo
- Down + closing
- —
- Monthly P&I
- —
- Monthly cashflow
- —
- DSCR
- —
- Eligible?
- —
Short-term bridge; refi at stabilization.
Rent comps 15 comps
| Address | Beds | Baths | Sqft | Rent | $/sqft | DOM | Units | Dist |
|---|---|---|---|---|---|---|---|---|
| 2824 186th St Lansing, IL | 3.0 | 2.0 | 1400 | $2,900 | $2.07 | 11d | 1 | 0.20mi |
| 18343 Oakwood Ave Lansing, IL | 4.0 | 2.0 | 1700 | $2,700 | $1.59 | 0d | 1 | 0.22mi |
| 3341 S Schultz Dr Lansing, IL | 4.0 | 2.0 | 1452 | $2,250 | $1.55 | 11d | 1 | 0.47mi |
| 18108 Oakwood Ave Lansing, IL | 3.0 | 1.0 | 1800 | $2,300 | $1.28 | 0d | 1 | 0.52mi |
| 18335 Sherman St Unit 3 Lansing, IL | 3.0 | 1.0 | 1000 | $1,700 | $1.70 | 0d | 1 | 0.62mi |
| 18361 Glen Oak Ave Unit 1E Lansing, IL | 2.0 | 1.0 | 900 | $1,400 | $1.56 | 26d | 1 | 0.70mi |
| 18381 Torrence Ave Lansing, IL | 2.0 | 1.0 | 900 | $1,300 | $1.44 | 26d | 1 | 0.76mi |
| 18550 Torrence Ave #25 Lansing, IL | 2.0 | 1.0 | 1000 | $1,300 | $1.30 | 13d | 1 | 0.78mi |
| 3020 178th St Unit C1 Lansing, IL | 2.0 | 1.0 | 900 | $1,550 | $1.72 | 0d | 1 | 0.92mi |
| 3020 178th St Apt C7 Lansing, IL | 2.0 | 1.0 | 900 | $1,550 | $1.72 | 26d | 1 | 0.92mi |
| 17723 Exchange Ave Unit 17723-1N Lansing, IL | 3.0 | 2.0 | 1100 | $1,800 | $1.64 | 0d | 1 | 1.04mi |
| 3023 Bernice Rd Unit 3030 3N Lansing, IL | 3.0 | 1.0 | 1000 | $1,400 | $1.40 | 0d | 1 | 1.38mi |
| 3023 Bernice Rd Apt 2S Lansing, IL | 3.0 | 1.0 | 1000 | $1,600 | $1.60 | 0d | 1 | 1.38mi |
| 3069 Bernice Rd Apt 2N Lansing, IL | 3.0 | 1.0 | 950 | $1,535 | $1.62 | 22d | 1 | 1.38mi |
| 3069 Bernice Rd Apt 2S Lansing, IL | 3.0 | 1.0 | 950 | $1,535 | $1.62 | 4d | 1 | 1.38mi |
Listing history 44 events
-
2026-06-21days on market $259,000 Active 40 DOM
-
2026-06-18days on market $259,000 Active 37 DOM
-
2026-06-17days on market $259,000 Active 36 DOM
-
2026-06-16days on market $259,000 Active 35 DOM
-
2026-06-15days on market $259,000 Active 34 DOM
-
2026-06-13days on market $259,000 Active 32 DOM
-
2026-06-09days on market $259,000 Active 28 DOM
-
2026-06-08days on market $259,000 Active 27 DOM
-
2026-06-08price $259,000 Active 26 DOM
-
2026-06-07days on market $269,000 Active 26 DOM
-
2026-06-04days on market $269,000 Active 23 DOM
-
2026-06-03days on market $269,000 Active 22 DOM
-
2026-06-02days on market $269,000 Active 21 DOM
-
2026-06-01days on market $269,000 Active 20 DOM
-
2026-05-31days on market $269,000 Active 19 DOM
-
2026-05-12$269,000 Active
-
2025-11-21soldstatus $159,000
-
2025-11-17soldstatus $159,000 Closed 558-char remark
Show marketing remark (558 chars)
Welcome to 18508 Chicago Ave. in Lansing, IL-a charming 4-bedroom, 2-bathroom Cape Cod with plenty of space and potential! The main floor offers a cozy living room, a spacious family room perfect for entertaining, an eat-in kitchen, and a main floor bedroom for added convenience. Upstairs, you'll find three additional bedrooms, including a primary en suite for extra comfort and privacy. This home provides a great opportunity to make it your own with some updates and personal touches. Home is being sold AS IS. Don't miss out-schedule your showing today!
-
2025-10-29status Pending 558-char remark
Show marketing remark (558 chars)
Welcome to 18508 Chicago Ave. in Lansing, IL-a charming 4-bedroom, 2-bathroom Cape Cod with plenty of space and potential! The main floor offers a cozy living room, a spacious family room perfect for entertaining, an eat-in kitchen, and a main floor bedroom for added convenience. Upstairs, you'll find three additional bedrooms, including a primary en suite for extra comfort and privacy. This home provides a great opportunity to make it your own with some updates and personal touches. Home is being sold AS IS. Don't miss out-schedule your showing today!
-
2025-10-24$165,000 Active 558-char remark
Show marketing remark (558 chars)
Welcome to 18508 Chicago Ave. in Lansing, IL-a charming 4-bedroom, 2-bathroom Cape Cod with plenty of space and potential! The main floor offers a cozy living room, a spacious family room perfect for entertaining, an eat-in kitchen, and a main floor bedroom for added convenience. Upstairs, you'll find three additional bedrooms, including a primary en suite for extra comfort and privacy. This home provides a great opportunity to make it your own with some updates and personal touches. Home is being sold AS IS. Don't miss out-schedule your showing today!
-
2024-10-14historical
-
2024-06-28Active
-
2022-06-25price $1,525
-
2016-06-24soldstatus $62,500 Closed Sale
-
2016-06-13soldstatus $62,500
-
2016-04-23status Pending
-
2016-04-06historical Contingent
-
2015-11-13status Reactivated
-
2015-10-22status Pending
-
2015-09-25price $69,000
-
2015-09-02price $77,000
-
2015-08-11price $82,000
-
2015-07-23price $88,700
-
2015-07-05price $97,600
-
2015-06-16price $114,900
-
2015-05-29$120,900 New
-
2010-04-06soldstatus $55,000
-
2010-03-30soldstatus $55,000 Closed Sale
-
2010-02-24historical Contingent
-
2010-02-22price $55,900 Price Change
-
2010-01-30price $69,900 Price Change
-
2009-12-31$89,900 New
-
2005-10-18soldstatus $148,000
-
1992-06-04soldstatus $106,500
ⓘ Source: listings_history table (triggers on properties + properties_extension) + one-shot
backfill from property_details.listing_events for pre-trigger history.
Tax reassessment forecast IL · Partial reset (capped growth)
- Current annual tax
- $6,290 · $524/mo
- Projected year-2 tax
- $6,290 · $524/mo
- Expected delta
- $0/yr ($0/mo · 0.0%)
ⓘ Screening estimate from a state-policy table — verify with the county assessor before closing.
Climate risk First Street
- Flood 1/10 Low FEMA zone X (unshaded) · 0% chance over 30 yrs
- Wildfire 3/10 Moderate
- Heat 3/10 Moderate 7 d/yr ≥102°F today · 15 d/yr by 30 yrs out
- Wind 2/10 Low 0% chance of damaging wind over 30 yrs
- Air quality 4/10 Moderate 5 unhealthy d/yr today · 6 by 30 yrs out
Nearby sold comps map
Loading sold comps map…
Walkable amenities ~0.75 mi
Loading nearby amenities…
Taxation est. · year 1
- Rental income
- $25,490
- − Mortgage interest
- −$14,508
- − Property taxes
- −$6,290
- − Insurance
- −$1,295
- − Repairs & maintenance
- −$2,039
- − Management
- −$2,039
- − Depreciation
- −$7,535
- Taxable loss
- −$8,216
- Est. tax savings @ 24.0%
- +$1,972
- After-tax cash flow
- $-1,775/yr
For passive investors: Depreciation is non-cash, so a rental often shows a tax loss while cash-flowing — sheltering income. Rental losses are passive: they offset passive income freely, and up to $25,000/yr can offset ordinary (W-2) income if you actively participate and your MAGI is under $100k (phasing out to $0 by $150k); unused losses carry forward. On sale, claimed depreciation is recaptured at up to 25%, and gains may owe capital-gains tax (a 1031 exchange can defer both). Figures are a year-1 estimate at your 24.0% rate — not tax advice; consult a CPA.
Schools (NCES district)
- District
- Thornton Fractional Twp Hsd 215
- NCES district ID
- 1738940
- Math proficiency
- 9% ▼ -3.00%
- Reading proficiency
- 13% ▼ -3.00%
- Median HH income
- $48,207
- Composite
- 10.27/100
- National rank
- #9793
- State rank
- #563 of 620 in IL
Livability — Lansing
- Score
- 73/100
- State rank
- #296
- US rank
- #5698
Category grades
Schools grade is shown separately in the Schools card above.
Census & demographics
- Census place
- Lansing, IL
- County
- Cook County · 4,486,803 people
- City population
- 28,806
- Metro
- Chicago-Naperville-Elgin, IL-IN-WI
- Population (ZIP)
- 28,806
- Household income
- $75,681
- Rent vs Own
- Severe rent burden
- 830.0
Population outlook (Cook County) Hauer SSP2
- Today (2025)
- 5,347,519 people
- By 2030
- 5,357,703 · +0.2%
- By 2040
- 5,324,924 · -0.4%
- By 2050
- 5,230,762 · -2.2%
- By 2075
- 4,785,735 · -10.5%
- By 2100
- 4,188,836 · -21.7%
Race, ethnicity, and origin ACS 2023
- Neighborhood character
- Diverse neighborhood (Simpson 0.65)
- Race & ethnicity
- Black 51% White 25% Hispanic / Latino 18% Two or more races 7% Asian 2%
- Hispanic origin (detail)
- Mexican 15%
- Common ancestry
- Romanian 5% Iranian 3% Lithuanian 1%
- Foreign-born
- 10% · Canada
- Languages at home
- 83% English-only · Spanish 12% Vietnamese 1% French/Haitian/Cajun 1%
Political lean MEDSL · Cook
- 2024 margin
- Solid D (+42.0) · D 70.4% · R 28.4% · Other 1.2%
- 2008→2024 swing
- -11.4pp toward R · 2008: 53.4pp · 2024: 42.0pp
- All cycles
- 2024: D+42.0 2020: D+50.3 2016: D+53.0 2012: D+49.4 2008: D+53.4
Not yet ingested
- Civics
- —
Market trends
- HPI YoY
- ▼ -151.65%
- Current HPI
- 210.3398
- Rent YoY
- —
- Metro
- Chicago-Naperville-Elgin, IL-IN-WI
- State GDP YoY
- ▲ 1.59%
- F500 in state
- 60
Industry mix (Fortune 500 HQ in IL)
| Industry | F500 HQs | Revenue |
|---|---|---|
| Insurance | 4 | $201B |
|
||
| Consumer Goods | 4 | $87B |
|
||
| Industrial Machinery | 3 | $64B |
|
||
| Healthcare | 2 | $55B |
|
||
| Retail / Pharmacy | 1 | $148B |
|
||
| Agriculture / Food | 1 | $86B |
|
||
Price history
+152.6% since first listed29 events — show timeline
- 2026-05-12 Listed $269,000 MRED as Distributed by MLS Grid
- 2025-11-21 Sold (Public Records) $159,000 Public Records
- 2025-11-17 Sold (MLS) $159,000 MRED as Distributed by MLS Grid
- 2025-10-29 Pending — MRED as Distributed by MLS Grid
- 2025-10-24 Listed $165,000 MRED as Distributed by MLS Grid
- 2024-10-14 Listing Removed — MRED as Distributed by MLS Grid
- 2024-06-28 Listed — MRED as Distributed by MLS Grid
- 2022-06-25 Price Changed $1,525 RENT.
- 2016-06-24 Sold (MLS) $62,500 MRED as Distributed by MLS Grid
- 2016-06-13 Sold (Public Records) $62,500 Public Records
- 2016-04-23 Pending — MRED as Distributed by MLS Grid
- 2016-04-06 Contingent — MRED as Distributed by MLS Grid
- 2015-11-13 Relisted — MRED as Distributed by MLS Grid
- 2015-10-22 Pending — MRED as Distributed by MLS Grid
- 2015-09-25 Price Changed $69,000 MRED as Distributed by MLS Grid
- 2015-09-02 Price Changed $77,000 MRED as Distributed by MLS Grid
- 2015-08-11 Price Changed $82,000 MRED as Distributed by MLS Grid
- 2015-07-23 Price Changed $88,700 MRED as Distributed by MLS Grid
- 2015-07-05 Price Changed $97,600 MRED as Distributed by MLS Grid
- 2015-06-16 Price Changed $114,900 MRED as Distributed by MLS Grid
- 2015-05-29 Listed $120,900 MRED as Distributed by MLS Grid
- 2010-04-06 Sold (Public Records) $55,000 Public Records
- 2010-03-30 Sold (MLS) $55,000 MRED as Distributed by MLS Grid
- 2010-02-24 Contingent — MRED as Distributed by MLS Grid
- 2010-02-22 Price Changed $55,900 MRED as Distributed by MLS Grid
- 2010-01-30 Price Changed $69,900 MRED as Distributed by MLS Grid
- 2009-12-31 Listed $89,900 MRED as Distributed by MLS Grid
- 2005-10-18 Sold (Public Records) $148,000 Public Records
- 1992-06-04 Sold (Public Records) $106,500 Public Records
Property tax history
+5.0%/yrLatest (2023): $6,290 · +4.8% YoY. Source: county tax records.
Cash-flow waterfall
monthlySold comps — $/sqft
last 12 mo · ≤1 miLoading sold comps…