364 W 5102 H Rd W · Cleveland, TX
Flood risk No data
- FEMA flood zone
- —
- Chance of flooding over 30 yrs
- —
- Est. flood insurance / yr
- —
Fire risk No data
- Est. fire insurance / yr
- —
Heat risk No data
- Hot days now (above threshold)
- —
- Hot days in 30 yrs
- —
Wind risk No data
- Chance of severe wind over 30 yrs
- —
Air-quality risk No data
- Unhealthy air days now
- —
- Unhealthy air days in 30 yrs
- —
Risk factors via First Street. Map © Google.
Why this score? — see what drove the B- grade
The composite is a weighted blend of 9 inputs, each scored 0–100. Each bar is that input's sub-score; the figure is the points it added to the 100-point composite (weight × sub-score).
- Cash flow +30.0/30.0
- 1% rule +10.0/10.0
- DSCR +10.0/10.0
- ARV discount +7.5/15.0
- Rent growth +3.5/5.0
- Livability +3.1/5.0
- Schools +2.1/10.0
- Condition / age +1.0/5.0
- Appreciation +0.0/10.0
$70,000
🖨 Deal sheet 📄 Offer letter ✓ Due diligence
Listing remarks MLS
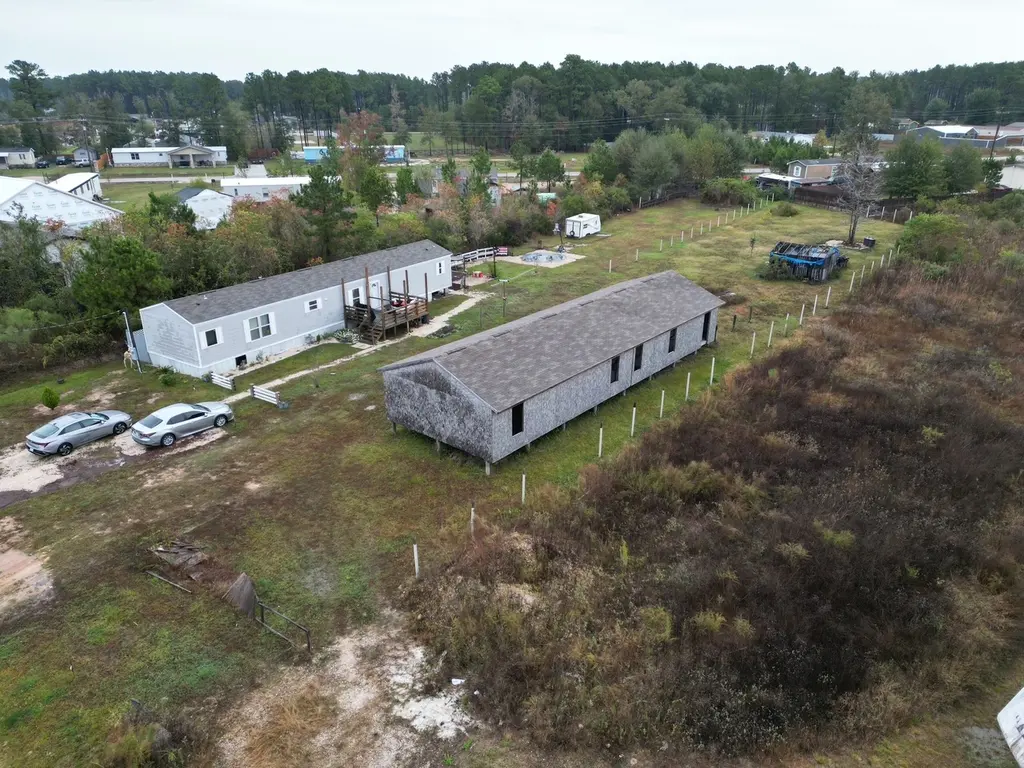
1/2 acre lot, allow your imagination to customize this home and make it yours, It still is in beginning stages to modify existing floor plan.
Key facts
- 0.52 acre lot
- Built 2022
- Listed 196 days
Neighborhood map
What this means for you Summary
Snapshot
- This is a 4-bed/1.0-bath single-family listed at $70k. Condition is rated poor.
Deal economics
- At list price, monthly cash flow is $897 ($11k/yr) — positive.
- The deal already cash-flows at list — no discount required.
- Meets the 1% rule at list price ($2k rent vs $70k).
- Recommended offer: $62k (12.0% below list) — sets the bar for market timing.
- Cap rate 21.7% vs local median 4.7% in Cleveland — top-decile yield for the area; either an underpriced asset or a hidden risk that comps aren't pricing in. Stress-test before assuming the spread holds.
Location & tenants
- Location reads 61/100 on livability (#1,013 in TX) — a middle-class / working-renter tenant base. Strengths: cost of living A+, housing A+; Watch: schools F, crime D-, amenities F.
- Cleveland ISD (town): math 24% / reading 25% proficiency, ranked #723 of 826 in TX (top 88%) — low school quality limits family demand, transient renter base, plan for 1-2y turnover; 71% free/reduced lunch — lower-income household profile, screen leases tightly.
- Market conditions: Rents rising fast (+4.0%/yr); 1574 active listings in the ZIP; 4 comparable units currently listed for rent nearby; rentals leasing fast (median 7d on market — plan ~1-2 weeks tenant-placement turnaround); 1,321 units permitted in Liberty County in 2024 (0 in 5+ unit buildings).
- This rent runs 34% of the median local income ($62k/yr) — at the standard rent-burdened threshold; future hikes will face affordability resistance.
Forward outlook
- Local home prices are declining (-3.0%/yr); year-one equity from $484 of loan paydown is wiped out by about $2k of value loss. Plan a longer hold.
- Liberty County population projected at +24% by 2050 — long-run rental-demand tailwind backs the buy-and-hold thesis.
- At projected returns (-3.0% appreciation + 4.0% rent growth), your $20k cash investment doubles in ~3 years — after that, you're playing with house money.
Negotiation context
- It's been on market 197 days — a 12% lower offer ($62k) is reasonable based on typical stale-listing flexibility.
Questions for the listing agent
- It's been on market 197 days. Have you received any prior offers? Is the seller open to a 12% concession, seller financing, or rate buy-down credit?
- Have any recent inspections been done? Can we get a copy of the seller's disclosures and any deferred-maintenance estimates?
- What does the HOA fee cover, when was the last increase, and are there any pending special assessments or reserve-fund shortfalls?
- Why hasn't it sold? Are there any deal-killer items the seller is aware of (foundation, flood, title, zoning, code violations)?
- Is there a deadline driving the sale (1031 exchange, divorce, estate, relocation)? That informs how much negotiation room exists.
- Schools are F-rated, which usually means shorter tenancies and higher turnover. Who's the typical renter profile here, and what's been the actual vacancy rate?
- Crime grade is D in this area — have there been break-ins, vandalism, or insurance claims at this property in the last 3 years? What carrier currently insures it and at what premium?
- What's the average days-on-market for RENTAL listings here right now (not sales)? A rising rental-DOM trend means longer vacancies and softer asking-rent achievability than the comps imply.
- What's the recent tenant-quality profile in this submarket — average credit score on applications, eviction rate, late-payment / NSF rate, and stable-employment percentage? A property-management company in the area should have these aggregated.
- How much new for-sale + rental construction is in the pipeline within 1–3 miles? Heavy new supply typically softens prices + rents 12–24 months out; constrained supply supports both.
Investment metrics
- 1% rule
- 2.52% ✓
- Cap rate
- 21.68%
- Cash-on-cash
- 54.95%
- DSCR
- 3.44
- GRM
- 3.3
CMA / ARV
- ARV (median comp)
- $178,461
- List price
- $70,000
- Delta
- -60.78%
- Verdict
- UNDERPRICED
- Comps
- 20 within 1.0 mi
Show comp detail 12 sales within ~0.75 mi
| Address | Dist | Beds/Ba | Sqft | Sold | Price | $/sf | Match |
|---|---|---|---|---|---|---|---|
| 4509 5914 21 | 0.00mi | 3/2.0 (-1) | 1,754 (-4%) | 3mo | $265,000 | $151 | 82 |
| 670 Maria Elena Way | 0.00mi | 4/2.5 | 1,954 (+7%) | 1mo | $206,990 | $106 | 81 |
| 677 Maria Elena Way | 0.00mi | 4/2.0 | 1,600 (-12%) | 0mo | $190,990 | $119 | 75 |
| 662 Maria Elena Way | 0.00mi | 4/2.0 | 1,600 (-12%) | 1mo | $192,990 | $121 | 75 |
| 812 Linia Alfred | 0.58mi | 4/2.5 | 1,834 (+0%) | 3mo | $279,000 | $152 | 64 |
| 501 W Houston St | 0.50mi | 4/2.5 | 1,843 (+1%) | 7mo | $250,000 | $136 | 64 |
| 211 S Cleveland Ave | 0.42mi | 3/2.0 (-1) | 1,744 (-4%) | 5mo | $229,900 | $132 | 60 |
| 509 Hancock Ave | 0.53mi | 3/2.0 (-1) | 1,747 (-4%) | 9mo | $199,000 | $114 | 52 |
| 407 Tanner Ave | 0.67mi | 3/2.0 (-1) | 1,922 (+5%) | 3mo | $142,900 | $74 | 48 |
| 315 Tanner Ave | 0.65mi | 3/2.5 (-1) | 1,933 (+6%) | 3mo | $219,900 | $114 | 47 |
| 702 S Roosevelt Ave S | 0.51mi | 3/2.0 (-1) | 1,663 (-9%) | 9mo | $225,800 | $136 | 45 |
| 1016 Rachel B Scott St | 0.72mi | 3/2.5 (-1) | 1,693 (-7%) | 0mo | $185,000 | $109 | 43 |
Match score weights: distance 35% · size 25% · config 20% · recency 20%. Top-matched comps best support the ARV.
Projected returns pro-forma
-3.0% appreciation · 4.0% rent growth · sell at horizon
- IRR
- 54.3%
- Equity multiple
- 3.43×
- Total profit
- $47,638
- Equity at exit
- $10,437
- IRR
- 59.9%
- Equity multiple
- 7.26×
- Total profit
- $122,710
- Equity at exit
- $6,052
Cash invested: $19,600 (down + closing). Projections, not guarantees.
Landlord ↔ Tenant lean methodology
- Overall (STATE)
- 87 Strongly Landlord-Friendly
- State Texas
- 87 Strongly Landlord-Friendly · R+5
- County
- — inherits STATE
- City
- — inherits STATE
ZIP-level market 77327
- Home prices YoY
- -5.2%
- Rents YoY
- 4.0%
- Active inventory
- 1574
- Price-to-rent
- 3.3×
Monthly cashflow live
- Estimated rent
- $1,761 medium interval (Pro) →
- Mortgage (P&I)
- −$367
- Tax est. 1.5%
- −$88 /mo · $1,050/yr
- Insurance
- −$29
- HOA
- −$10
- Vacancy / Maint / Mgmt
- −$370
- Net cashflow
- $897
Break-even live
UW: 25.0% down · 7.5% · 30yr · 1.5% tax · 5.0% vac · 8.0% maint · 8.0% mgmt
Financing live
Cash to close
- Down payment
- $17,500
- Closing costs
- $2,100
- Reserves months
- —
- Total cash needed
- —
Loan-product check · same deal, 3 products live
Conventional
25% down · 7.5% · 30yr
- Down + closing
- —
- Monthly P&I
- —
- Monthly cashflow
- —
- DSCR
- —
- Eligible?
- —
Personal DTI + credit; lowest rate.
DSCR
20% down · 8.5% · 30yr
- Down + closing
- —
- Monthly P&I
- —
- Monthly cashflow
- —
- DSCR
- —
- Eligible?
- —
No personal income docs; deal must DSCR.
Hard money
10% down · 12.0% · 12mo
- Down + closing
- —
- Monthly P&I
- —
- Monthly cashflow
- —
- DSCR
- —
- Eligible?
- —
Short-term bridge; refi at stabilization.
Rent comps 4 comps
| Address | Beds | Baths | Sqft | Rent | $/sqft | DOM | Units | Dist |
|---|---|---|---|---|---|---|---|---|
| 309 Johnson ST Unit J Cleveland, TX | 4.0 | 1.0 | 1346 | $1,350 | $1.00 | 7d | 1 | 0.04mi |
| 909 Jefferson Ave Cleveland, TX | 3.0 | 2.0 | 1600 | $1,870 | $1.17 | 1d | 1 | 0.86mi |
| 1018 Green Ave Cleveland, TX | 4.0 | 2.0 | 1337 | $1,500 | $1.12 | 21d | 1 | 0.96mi |
| 11040 Pelican Hill Ln Cleveland, TX | 5.0 | 3.0 | 2600 | $2,200 | $0.85 | 2d | 1 | 1.45mi |
HOA detail
- Monthly dues
- $10 · $120/yr
Listing history 18 events
-
2026-06-18days on market $70,000 Active 197 DOM
-
2026-06-17days on market $70,000 Active 196 DOM
-
2026-06-16days on market $70,000 Active 195 DOM
-
2026-06-15days on market $70,000 Active 194 DOM
-
2026-06-13days on market $70,000 Active 192 DOM
-
2026-06-09days on market $70,000 Active 188 DOM
-
2026-06-08days on market $70,000 Active 187 DOM
-
2026-06-07days on market $70,000 Active 186 DOM
-
2026-06-04days on market $70,000 Active 183 DOM
-
2026-06-03days on market $70,000 Active 182 DOM
-
2026-06-02days on market $70,000 Active 181 DOM
-
2026-06-01days on market $70,000 Active 180 DOM
-
2026-05-31days on market $70,000 Active 179 DOM
-
2026-03-26price $70,000 141-char remark
Show marketing remark (141 chars)
1/2 acre lot, allow your imagination to customize this home and make it yours, It still is in beginning stages to modify existing floor plan.
-
2026-03-09price $85,000 141-char remark
Show marketing remark (141 chars)
1/2 acre lot, allow your imagination to customize this home and make it yours, It still is in beginning stages to modify existing floor plan.
-
2026-01-29price $90,000 141-char remark
Show marketing remark (141 chars)
1/2 acre lot, allow your imagination to customize this home and make it yours, It still is in beginning stages to modify existing floor plan.
-
2026-01-06price $95,000 141-char remark
Show marketing remark (141 chars)
1/2 acre lot, allow your imagination to customize this home and make it yours, It still is in beginning stages to modify existing floor plan.
-
2025-12-03$100,000 Active 141-char remark
Show marketing remark (141 chars)
1/2 acre lot, allow your imagination to customize this home and make it yours, It still is in beginning stages to modify existing floor plan.
ⓘ Source: listings_history table (triggers on properties + properties_extension) + one-shot
backfill from property_details.listing_events for pre-trigger history.
Nearby sold comps map
Loading sold comps map…
Walkable amenities ~0.75 mi
Loading nearby amenities…
Taxation est. · year 1
- Rental income
- $21,132
- − Mortgage interest
- −$3,921
- − Property taxes
- −$1,050
- − Insurance
- −$350
- − Repairs & maintenance
- −$1,691
- − Management
- −$1,691
- − HOA
- −$120
- − Depreciation
- −$2,036
- Taxable income
- $10,274
- Est. tax owed @ 24.0%
- −$2,466
- After-tax cash flow
- $8,304/yr
For passive investors: Depreciation is non-cash, so a rental often shows a tax loss while cash-flowing — sheltering income. Rental losses are passive: they offset passive income freely, and up to $25,000/yr can offset ordinary (W-2) income if you actively participate and your MAGI is under $100k (phasing out to $0 by $150k); unused losses carry forward. On sale, claimed depreciation is recaptured at up to 25%, and gains may owe capital-gains tax (a 1031 exchange can defer both). Figures are a year-1 estimate at your 24.0% rate — not tax advice; consult a CPA.
Condition & rehab AI · 12 photos
This property requires extensive repairs and improvements to its roof, exterior, and landscaping. Immediate action is needed to stabilize the structure and improve the property's curb appeal for both resale and rental value.
Repairs flagged
- Major roof — Shingles appear damaged and uneven
- Major exterior — Structural issues with the building, possibly foundation damage
- Major landscaping — Overgrown vegetation and debris
Value-add opportunities
- Both Landscaping and curb appeal improvements — Aesthetic improvements can enhance both resale and rental value
- Both Roof repair and replacement — Critical to the structural integrity and safety of the property
- Both Exterior repairs and foundation assessment — Structural repairs can significantly increase the property's value and safety
Renovation cost estimate screening
| Repair item | Severity | Est. cost |
|---|---|---|
| roof · Shingles appear damaged and uneven | Major | $15,000–50,000 |
| exterior · Structural issues with the building, possibly foundation damage | Major | $15,000–50,000 |
| landscaping · Overgrown vegetation and debris | Major | $15,000–50,000 |
| Total estimated repair cost · 3 items | $45,000–150,000 |
Value-add ROI direction
- Both Landscaping and curb appeal improvements — Aesthetic improvements can enhance both resale and rental value ↑
- Both Roof repair and replacement — Critical to the structural integrity and safety of the property ↑
- Both Exterior repairs and foundation assessment — Structural repairs can significantly increase the property's value and safety ↑
ⓘ Cost ranges are severity-bucket heuristics (US national rule-of-thumb). Get contractor quotes + a written scope before underwriting a rehab budget.
Schools (NCES district)
- District
- Cleveland ISD
- NCES district ID
- 4814370
- Math proficiency
- 24% ▼ -13.00%
- Reading proficiency
- 25% ▼ -4.00%
- Median HH income
- $39,173
- Composite
- 20.61/100
- National rank
- #8549
- State rank
- #723 of 826 in TX
Livability — Cleveland
- Score
- 61/100
- State rank
- #1013
- US rank
- #17943
Category grades
Schools grade is shown separately in the Schools card above.
Census & demographics
- Census place
- Cleveland, TX
- County
- Liberty County · 82,189 people
- City population
- 17,208
- Metro
- Houston-The Woodlands-Sugar Land, TX
- Population (ZIP)
- 42,685
- Household income
- $62,219
- Rent vs Own
- Severe rent burden
- 437.0
Population outlook (Liberty County) Hauer SSP2
- Today (2025)
- 87,956 people
- By 2030
- 92,161 · +4.8%
- By 2040
- 100,784 · +14.6%
- By 2050
- 109,471 · +24.5%
- By 2075
- 133,470 · +51.7%
- By 2100
- 147,372 · +67.6%
Race, ethnicity, and origin ACS 2023
- Neighborhood character
- Diverse neighborhood (Simpson 0.57)
- Race & ethnicity
- Hispanic / Latino 54% White 36% Two or more races 18% Black 8% Native American 2%
- Hispanic origin (detail)
- Mexican 42%
- Common ancestry
- Lithuanian 2% Serbian 1% Slovak 0%
- Foreign-born
- 22% · Canada
- Languages at home
- 51% English-only · Spanish 48%
Political lean MEDSL · Liberty
- 2024 margin
- Solid R (+61.6) · D 19.0% · R 80.6%
- 2008→2024 swing
- -17.9pp toward R · 2008: -43.7pp · 2024: -61.6pp
- All cycles
- 2024: R+61.6 2020: R+59.7 2016: R+58.0 2012: R+53.3 2008: R+43.7
Not yet ingested
- Civics
- —
Market trends
- HPI YoY
- ▼ -12.39%
- Current HPI
- 224.9222
- Rent YoY
- ▲ 4.00%
- Metro
- Houston-The Woodlands-Sugar Land, TX
- State GDP YoY
- ▲ 3.95%
- F500 in state
- 110
Industry mix (Fortune 500 HQ in TX)
| Industry | F500 HQs | Revenue |
|---|---|---|
| Energy | 16 | $1,198B |
|
||
| Technology | 5 | $198B |
|
||
| Engineering / Construction | 4 | $72B |
|
||
| Energy Services | 3 | $60B |
|
||
| Utilities | 3 | $41B |
|
||
| Healthcare | 2 | $330B |
|
||
Price history
-30.0% since first listed5 events — show timeline
- 2026-03-26 Price Changed $70,000 HARMLS
- 2026-03-09 Price Changed $85,000 HARMLS
- 2026-01-29 Price Changed $90,000 HARMLS
- 2026-01-06 Price Changed $95,000 HARMLS
- 2025-12-03 Listed $100,000 HARMLS
Cash-flow waterfall
monthlySold comps — $/sqft
last 12 mo · ≤1 miLoading sold comps…