3837 N Irvington Ave · Indianapolis city (balance), IN
Flood risk 1/10 · Minimal
- FEMA flood zone
- X (unshaded)
- Chance of flooding over 30 yrs
- 0.0%
- Est. flood insurance / yr
- $473 – $860
Fire risk 1/10 · Minimal
- Est. fire insurance / yr
- $717 – $1,331
Heat risk 3/10 · Minor
- Hot days now (above 101°F)
- 7 days/yr
- Hot days in 30 yrs
- 18 days/yr
Wind risk 2/10 · Minimal
- Chance of severe wind over 30 yrs
- 1.0%
Air-quality risk 4/10 · Minor
- Unhealthy air days now
- 5 days/yr
- Unhealthy air days in 30 yrs
- 7 days/yr
Risk factors via First Street. Map © Google.
Why this score? — see what drove the D- grade
The composite is a weighted blend of 9 inputs, each scored 0–100. Each bar is that input's sub-score; the figure is the points it added to the 100-point composite (weight × sub-score).
- Cash flow +14.7/30.0
- 1% rule +4.6/10.0
- DSCR +4.5/10.0
- Rent growth +4.2/5.0
- Livability +2.5/5.0
- Condition / age +2.5/5.0
- ARV discount +2.1/15.0
- Schools +1.4/10.0
- Appreciation +0.0/10.0
$139,900
🖨 Deal sheet (PDF) 📄 Offer letter ✓ Due diligence
Listing remarks
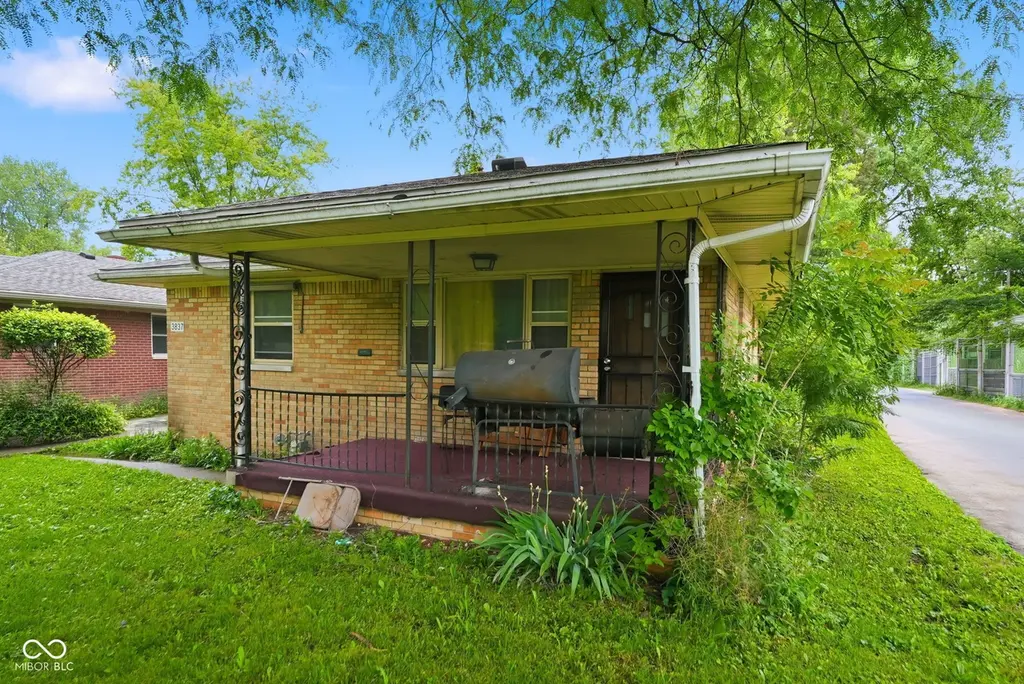
Opportunity awaits with this spacious Irvington-area ranch offering 3 bedrooms, 1 bath, and a full basement. Inside, you'll find original hardwood floors throughout much of the main level, generously sized bedrooms, and additional finished living space in the basement that provides flexibility for a second living area, rec room, home office, or storage. The large lot offers plenty of outdoor space with mature trees and room to make it your own. Conveniently located near Irvington dining, shopping, parks, and quick access to downtown Indianapolis, this home offers strong potential for an owner-occupant or investor alike. Home is currently rented at $1250 until 2/28/2027.
Key facts
- Large lot
- Conveniently located
- Mature trees
Tags
Property features AI
Exterior
- Utilities: Public water; Municipal sewer connected
- Home design: Single-family residence; One level
- Construction: Brick construction; Block foundation
- Exterior features: Lot under 1/4 acre (approximately 0.24 acre)
Interior
- Kitchen: No appliances included
- Bedrooms: 3 bedrooms on the main level
- Flooring: Hardwood
- Bathrooms: 1 full bath; 1 half bath (basement)
- Heating & cooling: Forced air heating (natural gas); Central air conditioning
- Interior features: Hardwood floors; Partially finished basement
Neighborhood map
What this means for you Summary
Snapshot
- This is a 3-bed/1.5-bath single-family listed at $140k.
Deal economics
- At list price, monthly cash flow is $35 ($424/yr) — positive.
- The deal already cash-flows at list — no discount required.
- To meet the 1% rule (rent ≥ 1% of price), the offer needs to be $134k (4.0% below list).
- Recommended offer: $134k (4.0% below list) — sets the bar for 1% rule.
- Cap rate 6.6% vs local median 4.4% in Indianapolis city (balance) — top-decile yield for the area; either an underpriced asset or a hidden risk that comps aren't pricing in. Stress-test before assuming the spread holds.
Location & tenants
- Location reads: area grade D — affects rentability + tenant quality, not the cash-flow math above.
- Indianapolis Public Schools (urban): math 14% / reading 20% proficiency, ranked #286 of 301 in IN (top 95%) — low school quality limits family demand, transient renter base, plan for 1-2y turnover; 77% free/reduced lunch — lower-income household profile, screen leases tightly.
- Zoned schools: Center For Inquiry School 84 (math 64% / reading 69%, grade B+, #65 of 994 statewide, top 7%, 469 students, 8% FRL); H L Harshman Middle School (math 3% / reading 16%, grade F, #316 of 330 statewide, top 96%, 549 students, 84% FRL) — zoned schools average 46% FRL vs 77% district-wide (31 pts lower); this property's tenant base skews higher-income than the district average.
- Zoned-school proficiency averages 38% at this address vs 17% district-wide (+21 pts) — the actual schools serving this property are materially stronger than the Indianapolis Public Schools average implies; a family-tenant draw the district grade alone would hide.
- Market conditions: Rents rising fast (+6.8%/yr); 153 active listings in the ZIP; 40 comparable units currently listed for rent nearby; rentals at typical pace (median 24d on market — plan ~3-4 weeks tenant-placement turnaround); 1,906 units permitted in Marion County in 2024 (621 in 5+ unit buildings).
- This rent runs 32% of the median local income ($50k/yr) — at the standard rent-burdened threshold; future hikes will face affordability resistance.
Forward outlook
- Local home prices are declining (-3.0%/yr); year-one equity from $967 of loan paydown is wiped out by about $4k of value loss. Plan a longer hold.
- Marion County population projected at +18% by 2050 — long-run rental-demand tailwind backs the buy-and-hold thesis.
Negotiation context
- It's been on market 24 days — a 2% lower offer ($138k) is reasonable based on typical stale-listing flexibility.
Risks & watch-outs
- Watch-outs: built in 1957 — expect roof / HVAC / electrical / plumbing capex.
Questions for the listing agent
- Built in 1957 — when were the roof, HVAC, electrical panel, plumbing, and water heater last replaced?
- Is there a deadline driving the sale (1031 exchange, divorce, estate, relocation)? That informs how much negotiation room exists.
- The area grade is low — what's the realistic commute time and amenity access for the typical tenant pool here? Any planned neighborhood developments (good or bad) we should know about?
- What's the average days-on-market for RENTAL listings here right now (not sales)? A rising rental-DOM trend means longer vacancies and softer asking-rent achievability than the comps imply.
- What's the recent tenant-quality profile in this submarket — average credit score on applications, eviction rate, late-payment / NSF rate, and stable-employment percentage? A property-management company in the area should have these aggregated.
- How much new for-sale + rental construction is in the pipeline within 1–3 miles? Heavy new supply typically softens prices + rents 12–24 months out; constrained supply supports both.
Investment metrics
- 1% rule
- 0.96% ✗
- Cap rate
- 6.60%
- Cash-on-cash
- 1.08%
- DSCR
- 1.05
- GRM
- 8.7
CMA / ARV
- ARV (on-the-fly)
- $124,845
- Comps found
- 12
Show comp detail 12 sales within ~0.75 mi
| Address | Dist | Beds/Ba | Sqft | Sold | Price | $/sf | Match |
|---|---|---|---|---|---|---|---|
| 3946 N Layman Ave | 0.18mi | 3/1.5 | 1,200 (+1%) | 6mo | $115,000 | $96 | 85 |
| 5601 Glencoe St | 0.34mi | 3/1.0 | 1,152 (-3%) | 9mo | $173,000 | $150 | 70 |
| 3715 N Irvington Ave | 0.20mi | 4/1.0 (+1) | 1,104 (-7%) | 5mo | $120,000 | $109 | 68 |
| 3904 N Graham Ave | 0.35mi | 3/1.0 | 1,080 (-9%) | 1mo | $107,000 | $99 | 66 |
| 4934 E 41st St | 0.61mi | 3/1.5 | 1,178 (-1%) | 9mo | $47,000 | $40 | 62 |
| 3536 N Audubon Rd | 0.46mi | 3/1.0 | 1,140 (-4%) | 10mo | $120,000 | $105 | 61 |
| 3536 N Priscilla Ct | 0.53mi | 3/1.0 | 1,102 (-7%) | 5mo | $133,500 | $121 | 57 |
| 3607 N Graham Ave | 0.50mi | 3/1.0 | 1,102 (-7%) | 8mo | $116,000 | $105 | 56 |
| 5660 E 34th St | 0.64mi | 3/1.5 | 1,104 (-7%) | 4mo | $115,000 | $104 | 55 |
| 5605 Glencoe St | 0.35mi | 4/1.5 (+1) | 1,056 (-11%) | 10mo | $158,500 | $150 | 51 |
| 3912 N Webster Ave | 0.67mi | 4/1.0 (+1) | 1,274 (+7%) | 2mo | $125,000 | $98 | 48 |
| 3901 Wallace Ave | 0.65mi | 2/1.0 (-1) | 1,047 (-12%) | 0mo | $55,000 | $53 | 42 |
Match score weights: distance 35% · size 25% · config 20% · recency 20%. Top-matched comps best support the ARV.
Projected returns pro-forma
-3.0% appreciation · 6.76% rent growth · sell at horizon
- IRR
- -10.2%
- Equity multiple
- 0.61×
- Total profit
- $-15,086
- Equity at exit
- $20,860
- IRR
- 4.0%
- Equity multiple
- 1.34×
- Total profit
- $13,384
- Equity at exit
- $12,096
Cash invested: $39,172 (down + closing). Projections, not guarantees.
Landlord ↔ Tenant lean methodology
- Overall (STATE)
- 90 Strongly Landlord-Friendly
- State Indiana
- 90 Strongly Landlord-Friendly · R+11
- County
- — inherits STATE
- City
- — inherits STATE
ZIP-level market 46226
- Rents YoY
- 6.8%
- Active inventory
- 153
- Price-to-rent
- 8.7×
Monthly cashflow live
- Estimated rent
- $1,344 high interval (Pro) →
- Mortgage (P&I)
- −$734
- Tax from tax record
- −$234 /mo · $2,810/yr
- Insurance
- −$58
- HOA
- −$0
- Vacancy / Maint / Mgmt
- −$282
- Net cashflow
- $35
Break-even live
Sensitivity live
| Price | -10% $115 | -5% $75 | +0% $35 | +5% $-4 | +10% $-44 |
|---|---|---|---|---|---|
| Rent | -10% $-71 | -5% $-18 | +0% $35 | +5% $88 | +10% $142 |
| Rate | -1.0pp $106 | -0.5pp $71 | base $35 | +0.5pp $-1 | +1.0pp $-38 |
UW: 25.0% down · 7.5% · 30yr · 1.5% tax · 5.0% vac · 8.0% maint · 8.0% mgmt
Financing live
Cash to close
- Down payment
- $34,975
- Closing costs
- $4,197
- Reserves months
- —
- Total cash needed
- —
Loan-product check · same deal, 3 products live
Conventional
25% down · 7.5% · 30yr
- Down + closing
- —
- Monthly P&I
- —
- Monthly cashflow
- —
- DSCR
- —
- Eligible?
- —
Personal DTI + credit; lowest rate.
DSCR
20% down · 8.5% · 30yr
- Down + closing
- —
- Monthly P&I
- —
- Monthly cashflow
- —
- DSCR
- —
- Eligible?
- —
No personal income docs; deal must DSCR.
Hard money
10% down · 12.0% · 12mo
- Down + closing
- —
- Monthly P&I
- —
- Monthly cashflow
- —
- DSCR
- —
- Eligible?
- —
Short-term bridge; refi at stabilization.
Rent comps 40 comps
| Address | Beds | Baths | Sqft | Rent | $/sqft | DOM | Units | Dist |
|---|---|---|---|---|---|---|---|---|
| 3636 N Whittier Pl Indianapolis, IN | 3.0 | 1.0 | 912 | $995 | $1.09 | 9d | 1 | 0.29mi |
| 3815 N Grand Ave Unit 3815 Indianapolis, IN | 2.0 | 1.0 | 965 | $1,250 | $1.30 | 6d | 1 | 0.30mi |
| 3718 N Audubon Rd Indianapolis, IN | 3.0 | 1.0 | 875 | $1,300 | $1.49 | 25d | 1 | 0.32mi |
| 5602 Glencoe St Indianapolis, IN | 3.0 | 1.0 | 1000 | $1,749 | $1.75 | 19d | 1 | 0.34mi |
| 3836 Priscilla Ave Indianapolis, IN | 3.0 | 1.5 | 1040 | $1,275 | $1.23 | 4d | 1 | 0.39mi |
| 3516 N Hawthorne Ln Indianapolis, IN | 3.0 | 1.0 | 925 | $1,225 | $1.32 | 6d | 1 | 0.46mi |
| 3639 N Emerson Ave Indianapolis, IN | 4.0 | 1.0 | 1000 | $1,450 | $1.45 | 24d | 1 | 0.46mi |
| 3912 N Webster Ave Indianapolis, IN | 4.0 | 1.0 | 1274 | $1,350 | $1.06 | 24d | 1 | 0.64mi |
| 3319 N Hawthorne Ln Indianapolis, IN | 3.0 | 1.0 | 1084 | $1,100 | $1.01 | 25d | 1 | 0.73mi |
| 3301 Mardenna Ave Indianapolis, IN | 3.0 | 1.0 | 925 | $1,200 | $1.30 | 45d | 1 | 0.76mi |
| 3316 N Emerson Ave Indianapolis, IN | 3.0 | 1.0 | 912 | $1,100 | $1.21 | 25d | 1 | 0.80mi |
| 3734 Manor Ct Indianapolis, IN | 3.0 | 1.0 | 1414 | $1,399 | $0.99 | 9d | 1 | 0.84mi |
| 3332 Wallace Ave Indianapolis, IN | 3.0 | 1.0 | 936 | $1,600 | $1.71 | 25d | 1 | 1.00mi |
| 5865 E 46th St Indianapolis, IN | 3.0 | 2.0 | 1400 | $1,500 | $1.07 | 45d | 1 | 1.00mi |
| 3070 N Layman Ave #1 Indianapolis, IN | 3.0 | 2.0 | 1480 | $1,700 | $1.15 | 45d | 1 | 1.00mi |
| 4404 Park Forest Ct Indianapolis, IN | 2.0 | 1.0 | 928 | $1,180 | $1.27 | 24d | 2 | 1.01mi |
| 4411 Park Forest Ct Indianapolis, IN | 2.0 | 1.0 | 928 | $1,180 | $1.27 | 45d | 1 | 1.02mi |
| 4430 Park Forest Ct Indianapolis, IN | 2.0 | 1.0 | 928 | $1,180 | $1.27 | 45d | 1 | 1.03mi |
| 4438 Park Forest Ct Indianapolis, IN | 2.0 | 1.0 | 928 | $1,180 | $1.27 | 45d | 1 | 1.05mi |
| 4429 Park Forest Ct Indianapolis, IN | 2.0 | 1.0 | 928 | $1,180 | $1.27 | 0d | 1 | 1.05mi |
| 4437 Park Forest Ct Indianapolis, IN | 2.0 | 1.0 | 928 | $1,180 | $1.27 | 45d | 1 | 1.06mi |
| 4445 Park Forest Ct Indianapolis, IN | 2.0 | 1.0 | 928 | $1,180 | $1.27 | 5d | 1 | 1.07mi |
| 4555 N Arlington Ave Indianapolis, IN | 1.0–3.0 | 1.0–1.5 | 880 | $1,379 | $1.57 | 0d | 31 | 1.09mi |
| 4504 Park Forest Ct Indianapolis, IN | 2.0 | 1.0 | 928 | $1,180 | $1.27 | 5d | 1 | 1.09mi |
| 4521 Park Forest Ct Indianapolis, IN | 2.0 | 1.0 | 700 | $1,180 | $1.69 | 6d | 1 | 1.10mi |
| 4537 Park Forest Ct Indianapolis, IN | 2.0 | 1.0 | 928 | $1,180 | $1.27 | 45d | 1 | 1.16mi |
| 4545 Park Forest Ct Indianapolis, IN | 2.0 | 1.0 | 928 | $1,180 | $1.27 | 45d | 1 | 1.16mi |
| 3167 Shick Dr Indianapolis, IN | 4.0 | 1.0 | 1141 | $2,350 | $2.06 | 45d | 1 | 1.16mi |
| 3315 N Euclid Ave Indianapolis, IN | 2.0 | 1.0 | 780 | $1,300 | $1.67 | 16d | 1 | 1.16mi |
| 4405 Park Forest Ct Indianapolis, IN | 2.0 | 1.0 | 928 | $1,180 | $1.27 | 25d | 1 | 1.19mi |
| 4511 N Kenmore Rd Indianapolis, IN | 4.0 | 2.0 | 1200 | $2,095 | $1.75 | 6d | 1 | 1.31mi |
| 3142 N Euclid Ave Indianapolis, IN | 3.0 | 1.0 | 1050 | $1,050 | $1.00 | 45d | 1 | 1.34mi |
| 2703 Kristen Dr E Indianapolis, IN | 3.0 | 1.0 | 1155 | $1,700 | $1.47 | 45d | 1 | 1.34mi |
| 2950 N Dequincy St Indianapolis, IN | 3.0 | 1.0 | 888 | $1,375 | $1.55 | 16d | 1 | 1.37mi |
| 3725 N Sherman Dr #7 Indianapolis, IN | 2.0 | 1.0 | 729 | $845 | $1.16 | 6d | 1 | 1.41mi |
| 3725 N Sherman Dr #7 Indianapolis, IN | 2.0 | 1.0 | 729 | $845 | $1.16 | 0d | 1 | 1.41mi |
| 6563 E 46th St Indianapolis, IN | 3.0 | 1.5 | 1185 | $1,250 | $1.05 | 6d | 1 | 1.42mi |
| 3149 N Gladstone Ave Indianapolis, IN | 3.0 | 1.5 | 1036 | $1,350 | $1.30 | 9d | 1 | 1.42mi |
| 6005 Dickson Rd Unit 4 Indianapolis, IN | 2.0 | 1.0 | 873 | $725 | $0.83 | 45d | 1 | 1.42mi |
| 6015 Dickson Rd #1 Indianapolis, IN | 2.0 | 1.0 | 825 | $950 | $1.15 | 45d | 1 | 1.43mi |
Listing history 15 events
-
2026-06-21days on market $139,900 Active 24 DOM
-
2026-06-18days on market $139,900 Active 21 DOM
-
2026-06-17days on market $139,900 Active 20 DOM
-
2026-06-16days on market $139,900 Active 19 DOM
-
2026-06-15days on market $139,900 Active 18 DOM
-
2026-06-13days on market $139,900 Active 16 DOM
-
2026-06-13pricedays on market $139,900 Active 15 DOM
-
2026-06-09days on market $154,900 Active 12 DOM
-
2026-06-08days on market $154,900 Active 11 DOM
-
2026-06-07days on market $154,900 Active 10 DOM
-
2026-06-03days on market $154,900 Active 6 DOM
-
2026-06-02days on market $154,900 Active 5 DOM
-
2026-06-01days on market $154,900 Active 4 DOM
-
2026-05-31days on market $154,900 Active 3 DOM
-
2026-05-28$154,900 Active
ⓘ Source: listings_history table (triggers on properties + properties_extension) + one-shot
backfill from property_details.listing_events for pre-trigger history.
Tax reassessment forecast IN · Partial reset (capped growth)
- Current annual tax
- $2,810 · $234/mo
- Projected year-2 tax
- $2,810 · $234/mo
- Expected delta
- $0/yr ($0/mo · 0.0%)
ⓘ Screening estimate from a state-policy table — verify with the county assessor before closing.
Climate risk First Street
- Flood 1/10 Low FEMA zone X (unshaded) · 0% chance over 30 yrs
- Wildfire 1/10 Low
- Heat 3/10 Moderate 7 d/yr ≥101°F today · 18 d/yr by 30 yrs out
- Wind 2/10 Low 100% chance of damaging wind over 30 yrs
- Air quality 4/10 Moderate 5 unhealthy d/yr today · 7 by 30 yrs out
Nearby sold comps map
Loading sold comps map…
Walkable amenities ~0.75 mi
Loading nearby amenities…
Taxation est. · year 1
- Rental income
- $16,123
- − Mortgage interest
- −$7,837
- − Property taxes
- −$2,810
- − Insurance
- −$700
- − Repairs & maintenance
- −$1,290
- − Management
- −$1,290
- − Depreciation
- −$4,070
- Taxable loss
- −$1,872
- Est. tax savings @ 24.0%
- +$449
- After-tax cash flow
- $874/yr
For passive investors: Depreciation is non-cash, so a rental often shows a tax loss while cash-flowing — sheltering income. Rental losses are passive: they offset passive income freely, and up to $25,000/yr can offset ordinary (W-2) income if you actively participate and your MAGI is under $100k (phasing out to $0 by $150k); unused losses carry forward. On sale, claimed depreciation is recaptured at up to 25%, and gains may owe capital-gains tax (a 1031 exchange can defer both). Figures are a year-1 estimate at your 24.0% rate — not tax advice; consult a CPA.
Schools (NCES district)
- District
- Indianapolis Public Schools
- NCES district ID
- 1804770
- Math proficiency
- 14% ▼ -7.00%
- Reading proficiency
- 20% ▼ -3.00%
- Median HH income
- $32,034
- Composite
- 13.69/100
- National rank
- #9499
- State rank
- #286 of 301 in IN
Livability — Indianapolis city (balance)
No livability data for this city. (Only ~50 U.S. cities are tracked.)
Census & demographics
- Census place
- Indianapolis city (balance), IN
- County
- Marion County · 998,460 people
- City population
- 881,119
- Metro
- Indianapolis-Carmel-Anderson, IN
- Population (ZIP)
- 47,099
- Household income
- $50,325
- Rent vs Own
- Severe rent burden
- 2742.0
Population outlook (Marion County) Hauer SSP2
- Today (2025)
- 1,025,572 people
- By 2030
- 1,065,727 · +3.9%
- By 2040
- 1,141,577 · +11.3%
- By 2050
- 1,208,920 · +17.9%
- By 2075
- 1,367,288 · +33.3%
- By 2100
- 1,438,201 · +40.2%
Race, ethnicity, and origin ACS 2023
- Neighborhood character
- Diverse neighborhood (Simpson 0.62)
- Race & ethnicity
- Black 53% White 25% Hispanic / Latino 17% Two or more races 9% Asian 2%
- Hispanic origin (detail)
- Mexican 11%
- Common ancestry
- Lithuanian 1% Italian 1% Romanian 1%
- Foreign-born
- 11% · Canada
- Languages at home
- 86% English-only · Spanish 10% French/Haitian/Cajun 1% Other Asian/Pacific 1%
Political lean MEDSL · Marion
- 2024 margin
- Strong D (+27.7) · D 63.0% · R 35.3% · Other 1.7%
- 2008→2024 swing
- -0.7pp no change · 2008: 28.4pp · 2024: 27.7pp
- All cycles
- 2024: D+27.7 2020: D+29.1 2016: D+22.8 2012: D+22.2 2008: D+28.4
Not yet ingested
- Civics
- —
Market trends
- HPI YoY
- ▼ -218.85%
- Current HPI
- 239.43
- Rent YoY
- ▲ 6.76%
- Metro
- Indianapolis-Carmel-Anderson, IN
- State GDP YoY
- ▲ 2.90%
- F500 in state
- 18
Industry mix (Fortune 500 HQ in IN)
| Industry | F500 HQs | Revenue |
|---|---|---|
| Industrial Machinery | 2 | $37B |
|
||
| Healthcare | 1 | $177B |
|
||
| Pharmaceuticals | 1 | $45B |
|
||
| Metals / Steel | 1 | $18B |
|
||
| Agriculture | 1 | $17B |
|
||
| Packaging | 1 | $12B |
|
||
Price history
1 event — show timeline
- 2026-05-28 Listed $154,900 MIBOR as Distributed by MLS Grid
Property tax history
+6.5%/yrLatest (2025): $2,810 · +11.8% YoY. Source: county tax records.
Cash-flow waterfall
monthlySold comps — $/sqft
last 12 mo · ≤1 miLoading sold comps…